46218 Investment Properties for Sale
Browse homes for sale and investment properties in 46218. Refine your search by price, property type, or more.
Best cash flowing properties in 46218
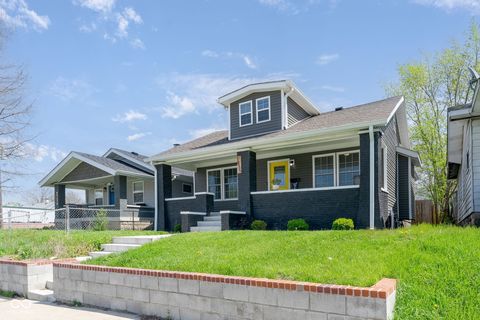
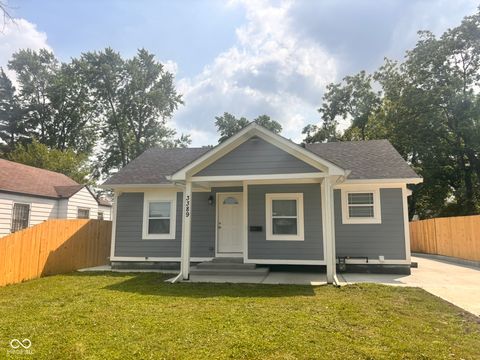
Active
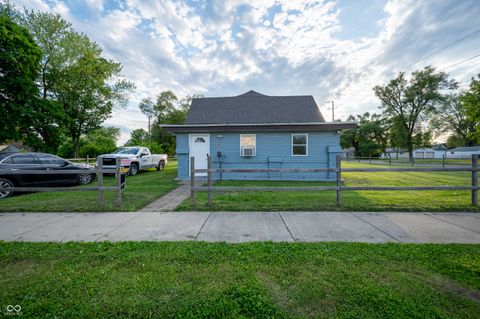
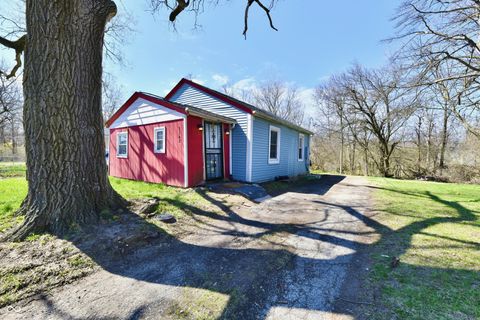
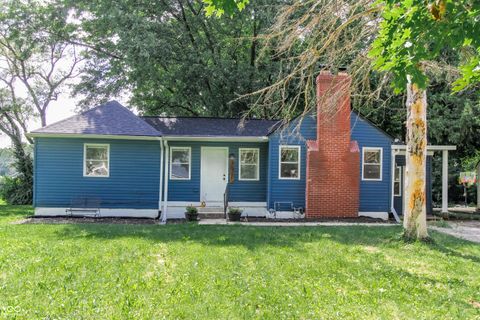
$39,900
1
bds
|
1
ba
|
806
sqft
|
built
1921
2820 N Gladstone Ave, Indianapolis, IN 46218
$966
Cash flow
28.2%
Cash-on-Cash Return
29.1%
Cap rate
3.5%
Rent to Value Ratio

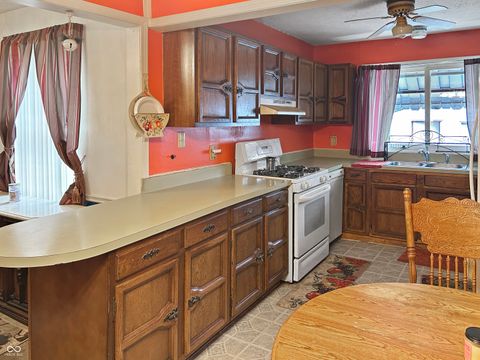
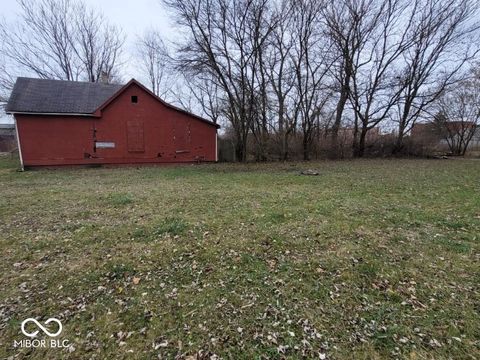
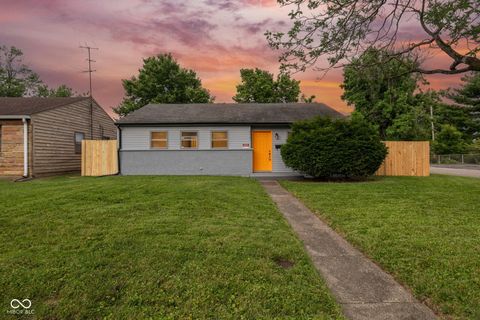
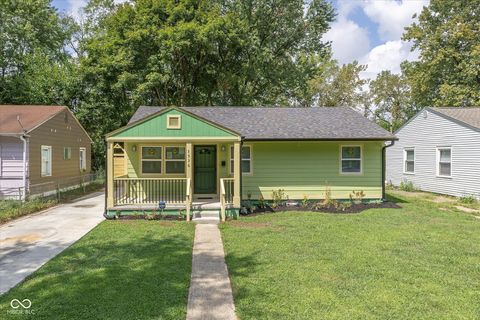
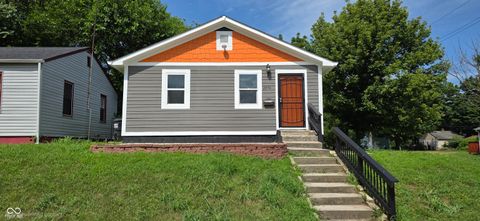
Active
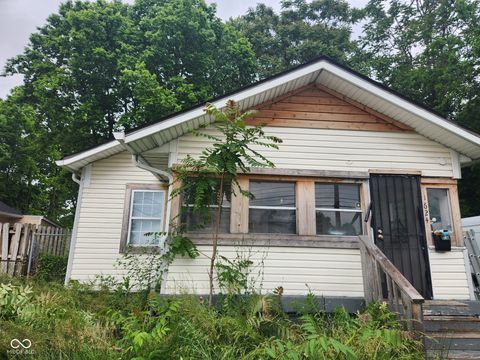
$94,999
2
bds
|
1
ba
|
720
sqft
|
built
1951
5349 E 19th Pl, Indianapolis, IN 46218
$479
Cash flow
26.3%
Cash-on-Cash Return
12.2%
Cap rate
1.5%
Rent to Value Ratio
85 out of 89 properties for sale in 46218
Limited Results Shown
Create a free account, or log in to reveal all property listings and enjoy the complete experience.
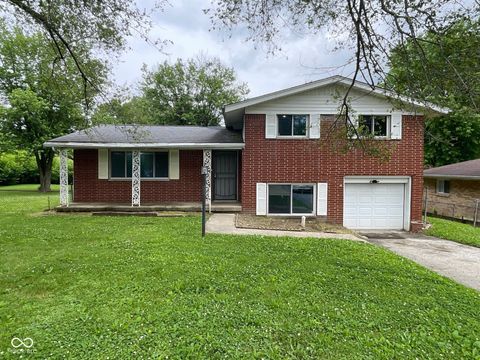
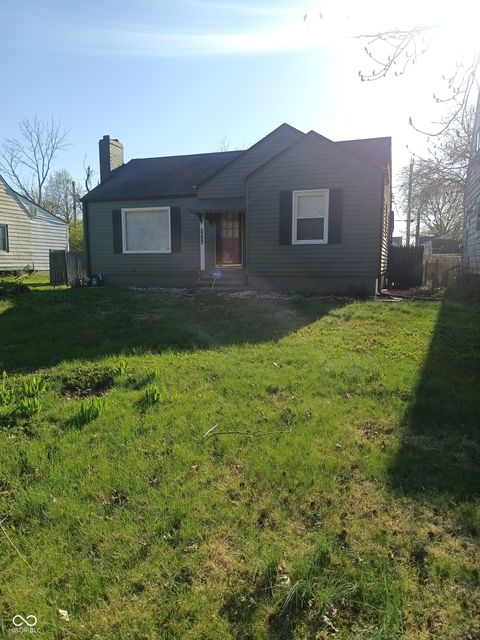
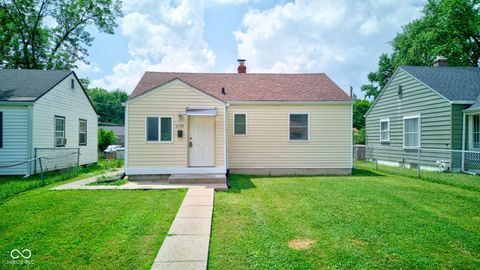
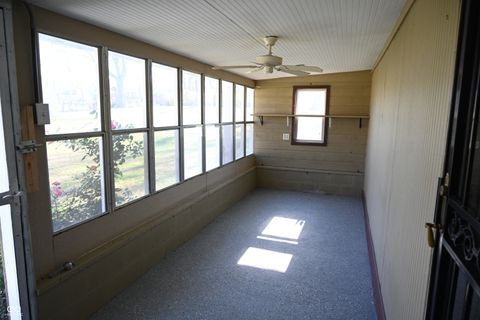
Active
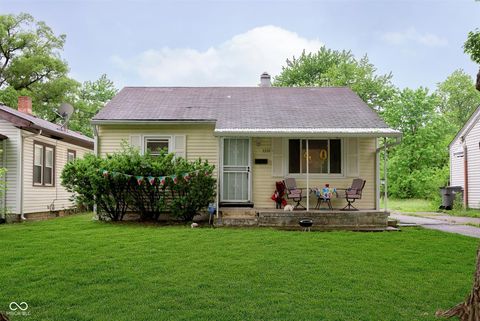
$156,900
2
bds
|
1
ba
|
1,072
sqft
|
built
1923
2127 Wallace Ave, Indianapolis, IN 46218
$93
Cash flow
3.1%
Cash-on-Cash Return
6.9%
Cap rate
0.8%
Rent to Value Ratio
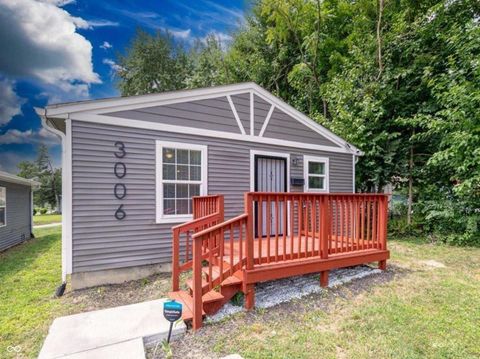
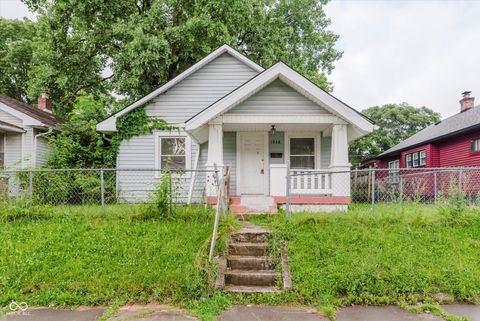
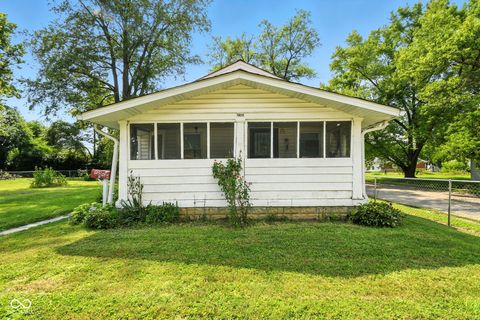
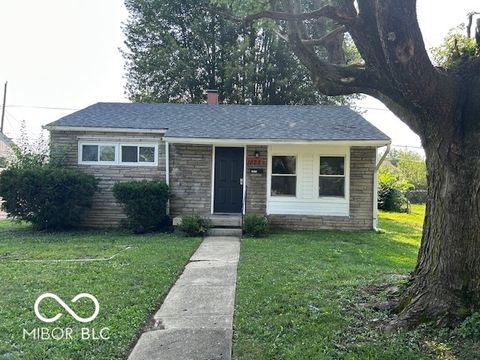
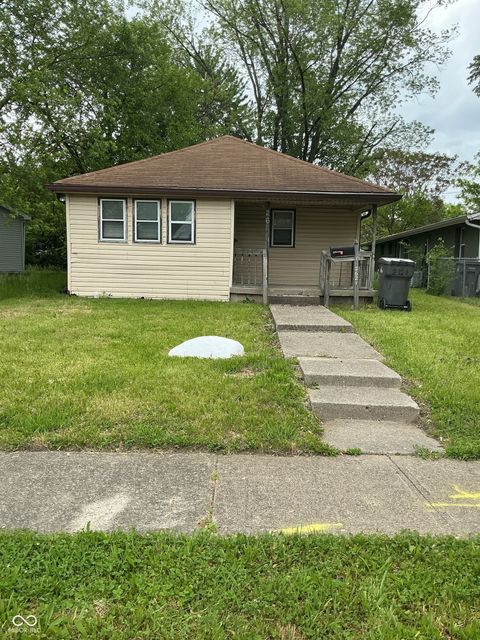
Active
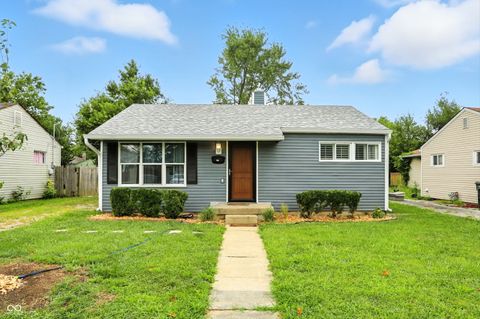
$170,000
3
bds
|
2
ba
|
912
sqft
|
built
2021
3006 N Olney St, Indianapolis, IN 46218
$233
Cash flow
7.2%
Cash-on-Cash Return
7.8%
Cap rate
0.9%
Rent to Value Ratio
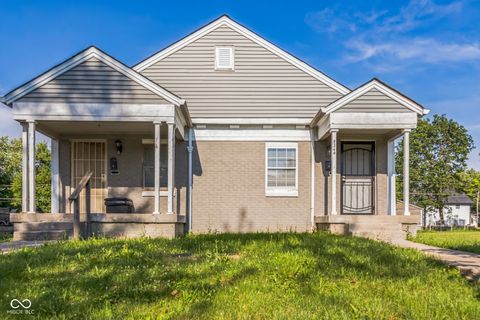
Active
$180,000
3
bds
|
2
ba
|
1,589
sqft
|
built
1955
1414 E 24th St, Indianapolis, IN 46218
$44
Cash flow
1.3%
Cash-on-Cash Return
6.4%
Cap rate
0.8%
Rent to Value Ratio
Active
$174,900
4
bds
|
1
ba
|
1,152
sqft
|
built
1927
2358 Hovey St, Indianapolis, IN 46218
$1
Cash flow
0.0%
Cash-on-Cash Return
6.2%
Cap rate
0.7%
Rent to Value Ratio
Active
$150,000
3
bds
|
1
ba
|
1,809
sqft
|
built
1949
3305 N Keystone Ave, Indianapolis, IN 46218
$129
Cash flow
4.5%
Cash-on-Cash Return
7.2%
Cap rate
0.9%
Rent to Value Ratio
Active
$162,000
3
bds
|
2
ba
|
1,456
sqft
|
built
1961
1749 N Graham Ave, Indianapolis, IN 46218
$274
Cash flow
8.8%
Cash-on-Cash Return
8.2%
Cap rate
1.0%
Rent to Value Ratio
Active
$119,900
2
bds
|
2
ba
|
1,162
sqft
|
built
1920
1938 N Dearborn St, Indianapolis, IN 46218
$352
Cash flow
15.3%
Cash-on-Cash Return
9.7%
Cap rate
1.2%
Rent to Value Ratio
Active
$120,000
3
bds
|
1
ba
|
840
sqft
|
built
1920
3142 N Euclid Ave, Indianapolis, IN 46218
$144
Cash flow
6.3%
Cash-on-Cash Return
7.6%
Cap rate
0.9%
Rent to Value Ratio
Active
$150,000
2
bds
|
1
ba
|
720
sqft
|
built
1910
1624 E 30th St, Indianapolis, IN 46218
$129
Cash flow
4.5%
Cash-on-Cash Return
7.2%
Cap rate
0.9%
Rent to Value Ratio
Active
$122,000
2
bds
|
1
ba
|
750
sqft
|
built
1950
3338 Orchard Ave, Indianapolis, IN 46218
$272
Cash flow
11.6%
Cash-on-Cash Return
8.8%
Cap rate
1.1%
Rent to Value Ratio
Active
$150,000
2
bds
|
1
ba
|
768
sqft
|
built
1952
1732 N Ritter Ave, Indianapolis, IN 46218
$198
Cash flow
6.9%
Cash-on-Cash Return
7.7%
Cap rate
0.9%
Rent to Value Ratio
Active
$173,700
2
bds
|
1
ba
|
1,295
sqft
|
built
1946
3153 N Layman Ave, Indianapolis, IN 46218
$214
Cash flow
6.4%
Cash-on-Cash Return
7.6%
Cap rate
0.9%
Rent to Value Ratio
Active
$95,000
2
bds
|
1
ba
|
990
sqft
|
built
1949
3481 Hillside Ave, Indianapolis, IN 46218
$410
Cash flow
22.5%
Cash-on-Cash Return
11.3%
Cap rate
1.4%
Rent to Value Ratio
Active
$144,900
2
bds
|
1
ba
|
1,040
sqft
|
built
1935
3640 N Temple Ave, Indianapolis, IN 46218
$224
Cash flow
8.1%
Cash-on-Cash Return
8.0%
Cap rate
1.0%
Rent to Value Ratio
Active
$150,000
3
bds
|
1
ba
|
864
sqft
|
built
1947
3514 Orchard Ave, Indianapolis, IN 46218
$198
Cash flow
6.9%
Cash-on-Cash Return
7.7%
Cap rate
0.9%
Rent to Value Ratio
Active
$199,999
3
bds
|
2
ba
|
1,638
sqft
|
built
1926
1835 N Rural St, Indianapolis, IN 46218
$218
Cash flow
5.7%
Cash-on-Cash Return
7.5%
Cap rate
0.9%
Rent to Value Ratio
Active
$85,000
2
bds
|
1
ba
|
960
sqft
|
built
1955
1724 Sheldon St, Indianapolis, IN 46218
$393
Cash flow
24.1%
Cash-on-Cash Return
11.7%
Cap rate
1.4%
Rent to Value Ratio
Active
$110,000
2
bds
|
1
ba
|
1,925
sqft
|
built
1951
3505 N Layman Ave, Indianapolis, IN 46218
$403
Cash flow
19.1%
Cash-on-Cash Return
10.5%
Cap rate
1.3%
Rent to Value Ratio
Active
$125,000
3
bds
|
1
ba
|
960
sqft
|
built
1930
2860 Eastern Ave, Indianapolis, IN 46218
$188
Cash flow
7.8%
Cash-on-Cash Return
7.9%
Cap rate
1.0%
Rent to Value Ratio
Active
$199,000
3
bds
|
2
ba
|
1,599
sqft
|
built
1940
3510 N Tacoma Ave, Indianapolis, IN 46218
$-122
Cash flow
-3.2%
Cash-on-Cash Return
5.4%
Cap rate
0.7%
Rent to Value Ratio
Active
$185,000
3
bds
|
1
ba
|
1,064
sqft
|
built
1963
2701 Sangster Ave, Indianapolis, IN 46218
$-189
Cash flow
-5.3%
Cash-on-Cash Return
4.9%
Cap rate
0.6%
Rent to Value Ratio
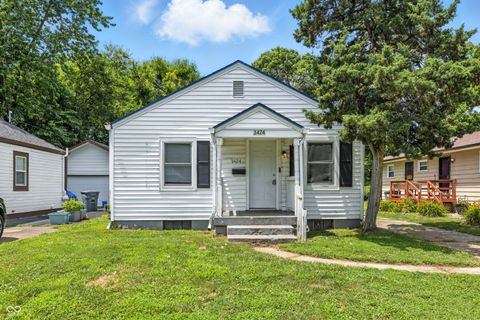
Active
$119,900
2
bds
|
1
ba
|
720
sqft
|
built
1941
3424 Orchard Ave, Indianapolis, IN 46218
$145
Cash flow
6.3%
Cash-on-Cash Return
7.6%
Cap rate
0.9%
Rent to Value Ratio
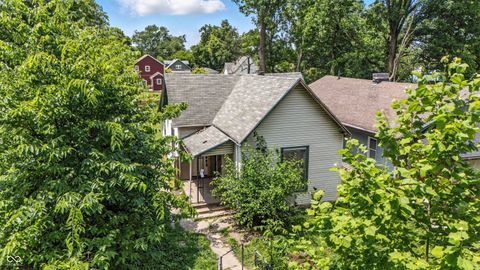
Active
$100,000
2
bds
|
1
ba
|
984
sqft
|
built
1893
2426 N Lasalle St, Indianapolis, IN 46218
$178
Cash flow
9.3%
Cash-on-Cash Return
8.3%
Cap rate
1.0%
Rent to Value Ratio
Active
$181,700
3
bds
|
2
ba
|
925
sqft
|
built
1951
3536 N Hawthorne Ln, Indianapolis, IN 46218
$-34
Cash flow
-1.0%
Cash-on-Cash Return
5.9%
Cap rate
0.7%
Rent to Value Ratio
Active
$174,999
3
bds
|
1
ba
|
992
sqft
|
built
1948
3426 N Olney St, Indianapolis, IN 46218
$1
Cash flow
0.0%
Cash-on-Cash Return
6.2%
Cap rate
0.7%
Rent to Value Ratio
Active
$124,900
2
bds
|
1
ba
|
768
sqft
|
built
1952
1825 N Hawthorne Ln, Indianapolis, IN 46218
$326
Cash flow
13.6%
Cash-on-Cash Return
9.3%
Cap rate
1.1%
Rent to Value Ratio
Active
$175,000
1
bds
|
1
ba
|
660
sqft
|
built
1950
2349 N Lasalle St, Indianapolis, IN 46218
$-413
Cash flow
-12.3%
Cash-on-Cash Return
3.3%
Cap rate
0.4%
Rent to Value Ratio
Active
$260,000
5
bds
|
3
ba
|
801
sqft
|
built
1947
3389 N Denny St, Indianapolis, IN 46218
$-504
Cash flow
-10.1%
Cash-on-Cash Return
3.8%
Cap rate
0.5%
Rent to Value Ratio
Active
$172,900
2
bds
|
2
ba
|
792
sqft
|
built
1944
2970 N Olney St, Indianapolis, IN 46218
$-196
Cash flow
-5.9%
Cash-on-Cash Return
4.8%
Cap rate
0.6%
Rent to Value Ratio
Active
$239,900
3
bds
|
2
ba
|
1,464
sqft
|
built
1955
3235 Adams St, Indianapolis, IN 46218
$13
Cash flow
0.3%
Cash-on-Cash Return
6.2%
Cap rate
0.8%
Rent to Value Ratio
Active
$115,000
2
bds
|
1
ba
|
780
sqft
|
built
1930
2621 N Tacoma Ave, Indianapolis, IN 46218
$101
Cash flow
4.6%
Cash-on-Cash Return
7.2%
Cap rate
0.9%
Rent to Value Ratio
Active
$130,000
2
bds
|
1
ba
|
750
sqft
|
built
1947
3109 Forest Manor Ave, Indianapolis, IN 46218
$24
Cash flow
1.0%
Cash-on-Cash Return
6.4%
Cap rate
0.8%
Rent to Value Ratio
Active
$149,999
3
bds
|
1
ba
|
1,176
sqft
|
built
1950
3420 N Chester Ave, Indianapolis, IN 46218
$198
Cash flow
6.9%
Cash-on-Cash Return
7.7%
Cap rate
0.9%
Rent to Value Ratio
Active
$332,900
3
bds
|
2
ba
|
1,589
sqft
|
built
1912
2301 Coyner Ave, Indianapolis, IN 46218
$227
Cash flow
3.6%
Cash-on-Cash Return
7.0%
Cap rate
0.8%
Rent to Value Ratio

Active
$189,900
3
bds
|
1
ba
|
1,296
sqft
|
built
1945
3601 N Colorado Ave, Indianapolis, IN 46218
$-7
Cash flow
-0.2%
Cash-on-Cash Return
6.1%
Cap rate
0.7%
Rent to Value Ratio

Active
$77,500
2
bds
|
1
ba
|
576
sqft
|
built
1948
2843 Adams St, Indianapolis, IN 46218
$86
Cash flow
5.8%
Cash-on-Cash Return
7.5%
Cap rate
0.9%
Rent to Value Ratio

Active
$174,900
3
bds
|
1
ba
|
1,032
sqft
|
built
1925
3561 N Chester Ave, Indianapolis, IN 46218
$1
Cash flow
0.0%
Cash-on-Cash Return
6.2%
Cap rate
0.7%
Rent to Value Ratio

Active
$152,500
3
bds
|
2
ba
|
1,130
sqft
|
built
1926
2822 E 19th St, Indianapolis, IN 46218
$185
Cash flow
6.3%
Cash-on-Cash Return
7.6%
Cap rate
0.9%
Rent to Value Ratio