46218 Investment Properties for Sale
Browse homes for sale and investment properties in 46218. Refine your search by price, property type, or more.
Best cash flowing properties in 46218
Active
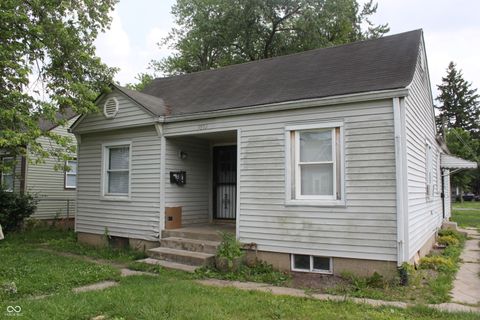
$67,900
2
bds
|
1
ba
|
720
sqft
|
built
1951
2959 N Lasalle St, Indianapolis, IN 46218
$759
Cash flow
13.0%
Cash-on-Cash Return
13.4%
Cap rate
1.6%
Rent to Value Ratio

Active
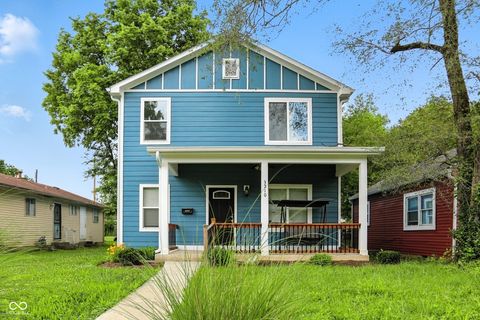
$112,000
4
bds
|
2
ba
|
1,680
sqft
|
built
1927
2006 N Olney St, Indianapolis, IN 46218
$519
Cash flow
24.2%
Cash-on-Cash Return
11.8%
Cap rate
1.4%
Rent to Value Ratio
109 out of 114 properties for sale in 46218
Limited Results Shown
Create a free account, or log in to reveal all property listings and enjoy the complete experience.

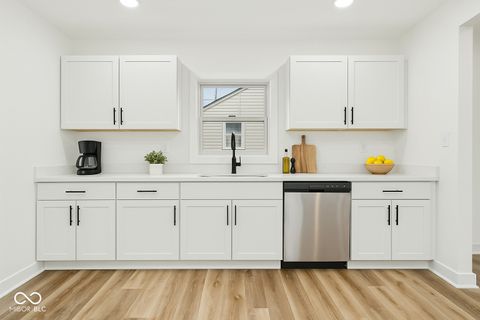
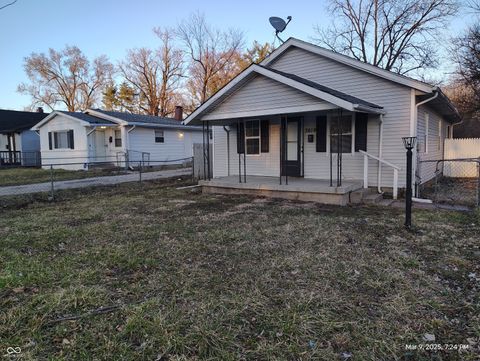
Active
$155,000
3
bds
|
1
ba
|
1,809
sqft
|
built
1949
3305 N Keystone Ave, Indianapolis, IN 46218
$88
Cash flow
3.0%
Cash-on-Cash Return
6.9%
Cap rate
0.8%
Rent to Value Ratio
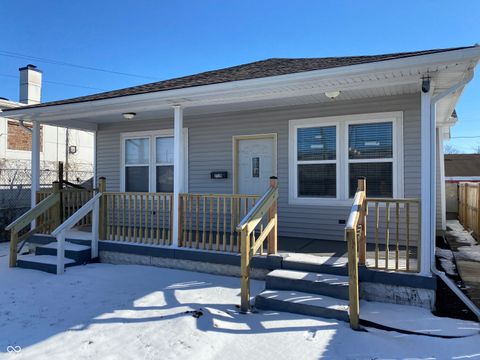
Active
$67,900
2
bds
|
1
ba
|
720
sqft
|
built
1951
2959 N Lasalle St, Indianapolis, IN 46218
$759
Cash flow
13.0%
Cash-on-Cash Return
13.4%
Cap rate
1.6%
Rent to Value Ratio
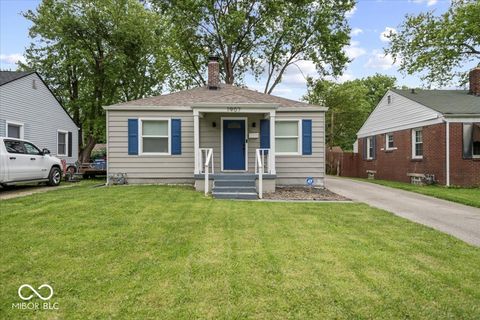
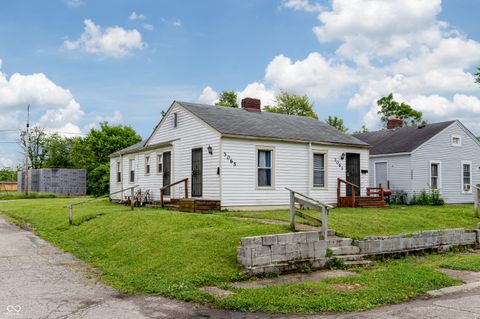
Active
$359,000
4
bds
|
2
ba
|
1,576
sqft
|
built
1948
1649 N Arsenal Ave, Indianapolis, IN 46218
$-873
Cash flow
-12.7%
Cash-on-Cash Return
3.2%
Cap rate
0.4%
Rent to Value Ratio
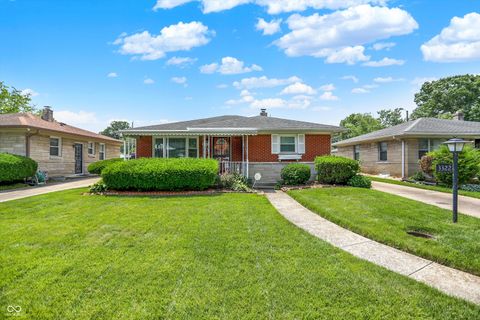
Active
$130,000
2
bds
|
1
ba
|
813
sqft
|
built
1948
1940 N Drexel Ave, Indianapolis, IN 46218
$231
Cash flow
9.3%
Cash-on-Cash Return
8.3%
Cap rate
1.0%
Rent to Value Ratio
Active
$89,900
4
bds
|
2
ba
|
1,846
sqft
|
built
1910
3602 E 22nd St, Indianapolis, IN 46218
$428
Cash flow
24.8%
Cash-on-Cash Return
12.0%
Cap rate
1.4%
Rent to Value Ratio
Active
$119,900
3
bds
|
2
ba
|
896
sqft
|
built
1910
1826 Tallman Ave, Indianapolis, IN 46218
$202
Cash flow
8.8%
Cash-on-Cash Return
8.3%
Cap rate
1.0%
Rent to Value Ratio
Active
$175,000
3
bds
|
2
ba
|
1,104
sqft
|
built
1970
3125 N Tacoma Ave, Indianapolis, IN 46218
$190
Cash flow
5.7%
Cash-on-Cash Return
7.6%
Cap rate
0.9%
Rent to Value Ratio
Active
$115,000
2
bds
|
1
ba
|
696
sqft
|
built
1950
1902 N Colorado Ave, Indianapolis, IN 46218
$228
Cash flow
10.3%
Cash-on-Cash Return
8.6%
Cap rate
1.0%
Rent to Value Ratio
Active
$165,000
3
bds
|
1
ba
|
1,178
sqft
|
built
1940
3755 N Hawthorne Ln, Indianapolis, IN 46218
$105
Cash flow
3.3%
Cash-on-Cash Return
7.0%
Cap rate
0.8%
Rent to Value Ratio
Active
$212,000
2
bds
|
1
ba
|
720
sqft
|
built
1950
5441 E 17th St, Indianapolis, IN 46218
$66
Cash flow
1.6%
Cash-on-Cash Return
6.6%
Cap rate
0.8%
Rent to Value Ratio

Active
$154,900
3
bds
|
1
ba
|
1,104
sqft
|
built
1971
1948 Bloyd Ave, Indianapolis, IN 46218
$-50
Cash flow
-1.7%
Cash-on-Cash Return
5.9%
Cap rate
0.7%
Rent to Value Ratio
Active
$122,000
3
bds
|
1
ba
|
1,816
sqft
|
built
1950
1741 N Riley Ave, Indianapolis, IN 46218
$260
Cash flow
11.1%
Cash-on-Cash Return
8.8%
Cap rate
1.1%
Rent to Value Ratio
Active
$220,000
5
bds
|
2
ba
|
2,280
sqft
|
built
1949
3712 N Olney St, Indianapolis, IN 46218
$-252
Cash flow
-6.0%
Cash-on-Cash Return
4.9%
Cap rate
0.6%
Rent to Value Ratio
Active
$209,999
3
bds
|
2
ba
|
1,473
sqft
|
built
1947
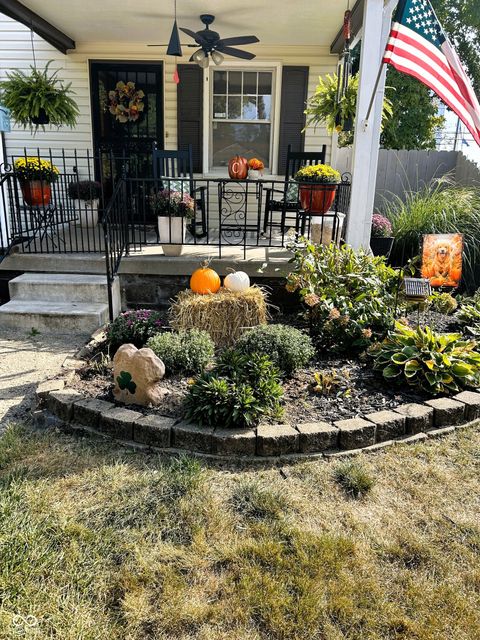
3558 N Gladstone Ave, Indianapolis, IN 46218
$-268
Cash flow
-6.7%
Cash-on-Cash Return
4.7%
Cap rate
0.6%
Rent to Value Ratio
Active
$179,000
0
bds
|
0
ba
|
0
sqft
|
built
1946
1703 E 34th St, Indianapolis, IN 46218
$-158
Cash flow
-4.6%
Cash-on-Cash Return
5.1%
Cap rate
0.6%
Rent to Value Ratio
Active
$309,900
4
bds
|
3
ba
|
2,600
sqft
|
built
2021
3210 Hovey St, Indianapolis, IN 46218
$138
Cash flow
2.3%
Cash-on-Cash Return
6.7%
Cap rate
0.8%
Rent to Value Ratio
Active
$149,900
2
bds
|
1
ba
|
696
sqft
|
built
1947
3105 N Tacoma Ave, Indianapolis, IN 46218
$-231
Cash flow
-8.0%
Cash-on-Cash Return
4.4%
Cap rate
0.5%
Rent to Value Ratio

Active
$124,900
2
bds
|
2
ba
|
720
sqft
|
built
1925
2814 Brookside Ave, Indianapolis, IN 46218
$245
Cash flow
10.2%
Cash-on-Cash Return
8.6%
Cap rate
1.0%
Rent to Value Ratio
Active
$198,000
3
bds
|
2
ba
|
1,471
sqft
|
built
1945
1907 N Drexel Ave, Indianapolis, IN 46218
$-68
Cash flow
-1.8%
Cash-on-Cash Return
5.9%
Cap rate
0.7%
Rent to Value Ratio

Active
$140,000
0
bds
|
0
ba
|
0
sqft
|
built
1941
4920 E 34th St, Indianapolis, IN 46218
$235
Cash flow
8.8%
Cash-on-Cash Return
8.3%
Cap rate
1.0%
Rent to Value Ratio

Active
$170,000
2
bds
|
1
ba
|
1,440
sqft
|
built
1940
3701 N Temple Ave, Indianapolis, IN 46218
$-60
Cash flow
-1.8%
Cash-on-Cash Return
5.8%
Cap rate
0.7%
Rent to Value Ratio
Active
$129,900
3
bds
|
2
ba
|
1,188
sqft
|
built
1930
3619 N Hawthorne Ln, Indianapolis, IN 46218
$219
Cash flow
8.8%
Cash-on-Cash Return
8.3%
Cap rate
1.0%
Rent to Value Ratio

Active
$115,000
3
bds
|
1
ba
|
925
sqft
|
built
1955
4715 E 33rd St, Indianapolis, IN 46218
$366
Cash flow
16.6%
Cash-on-Cash Return
10.1%
Cap rate
1.2%
Rent to Value Ratio
Active
$112,000
4
bds
|
2
ba
|
1,680
sqft
|
built
1927
2006 N Olney St, Indianapolis, IN 46218
$519
Cash flow
24.2%
Cash-on-Cash Return
11.8%
Cap rate
1.4%
Rent to Value Ratio

Active
$185,000
4
bds
|
2
ba
|
1,440
sqft
|
built
1930
3308 Schofield Ave, Indianapolis, IN 46218
$138
Cash flow
3.9%
Cash-on-Cash Return
7.2%
Cap rate
0.9%
Rent to Value Ratio
Active
$205,000
3
bds
|
2
ba
|
1,270
sqft
|
built
1913
2729 Massachusetts Ave, Indianapolis, IN 46218
$-380
Cash flow
-9.7%
Cash-on-Cash Return
4.0%
Cap rate
0.5%
Rent to Value Ratio

Active
$112,900
2
bds
|
1
ba
|
720
sqft
|
built
1951
3305 E 30th St, Indianapolis, IN 46218
$446
Cash flow
20.6%
Cash-on-Cash Return
11.0%
Cap rate
1.3%
Rent to Value Ratio
Active
$129,000
0
bds
|
0
ba
|
0
sqft
|
built
1942
3065 N Colorado Ave, Indianapolis, IN 46218
$-121
Cash flow
-4.9%
Cash-on-Cash Return
5.1%
Cap rate
0.6%
Rent to Value Ratio
Active
$205,000
3
bds
|
3
ba
|
1,433
sqft
|
built
1954
3322 N Riley Ave, Indianapolis, IN 46218
$-15
Cash flow
-0.4%
Cash-on-Cash Return
6.1%
Cap rate
0.7%
Rent to Value Ratio