46218 Investment Properties for Sale
Browse homes for sale and investment properties in 46218. Refine your search by price, property type, or more.
Best cash flowing properties in 46218
Active
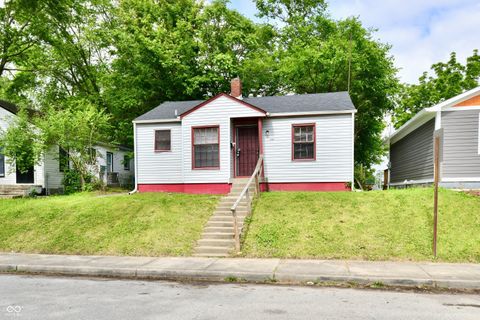
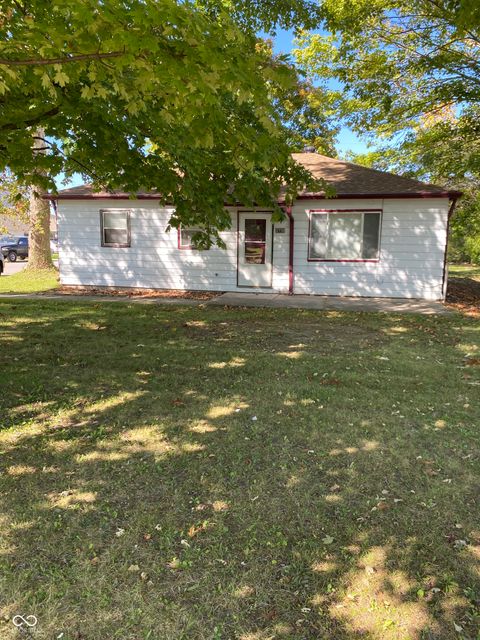
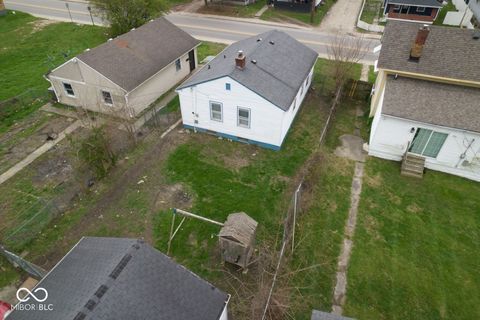
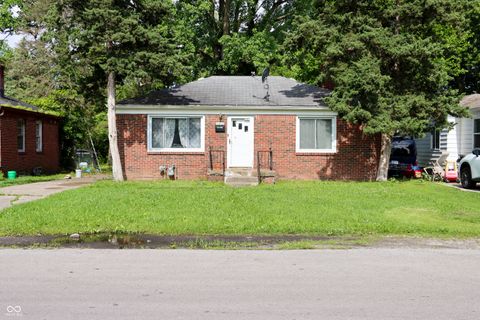
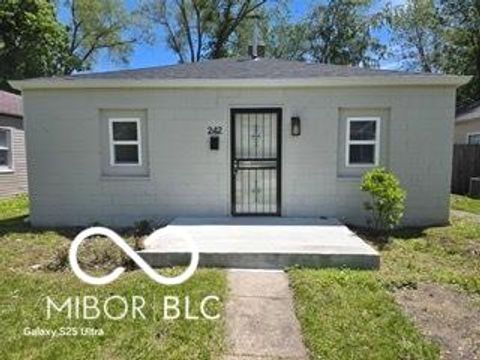
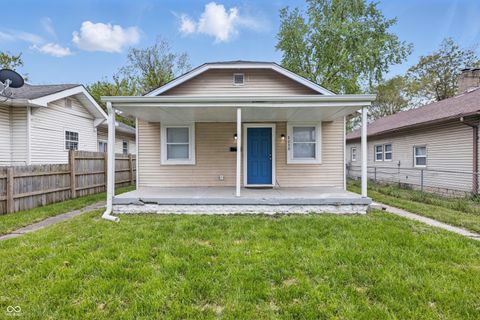
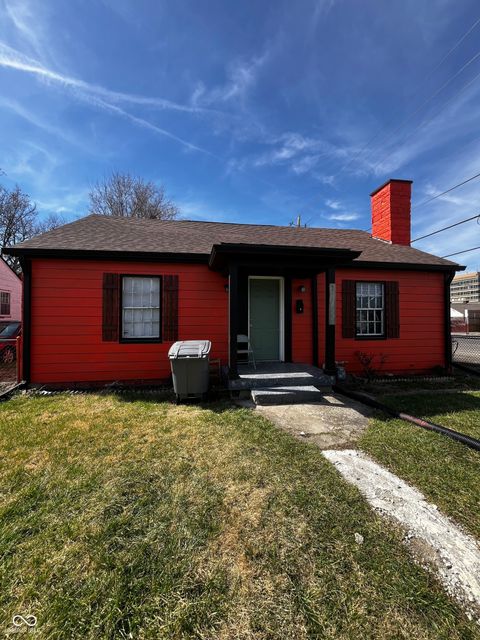
$67,900
2
bds
|
1
ba
|
720
sqft
|
built
1951
2959 N Lasalle St, Indianapolis, IN 46218
$759
Cash flow
13.0%
Cash-on-Cash Return
13.4%
Cap rate
1.6%
Rent to Value Ratio

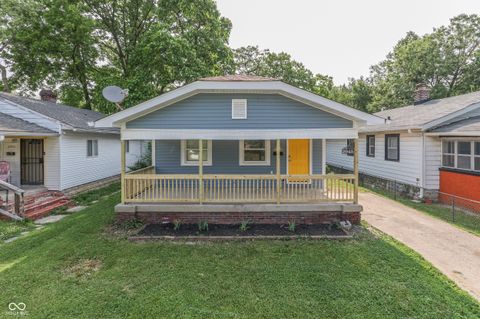
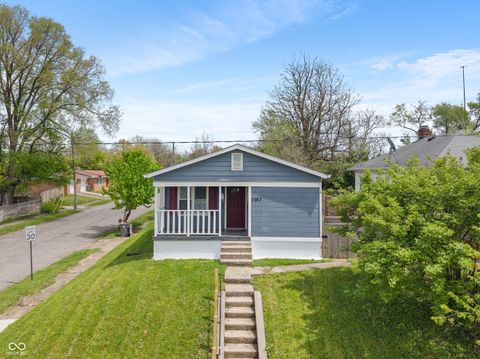
Active
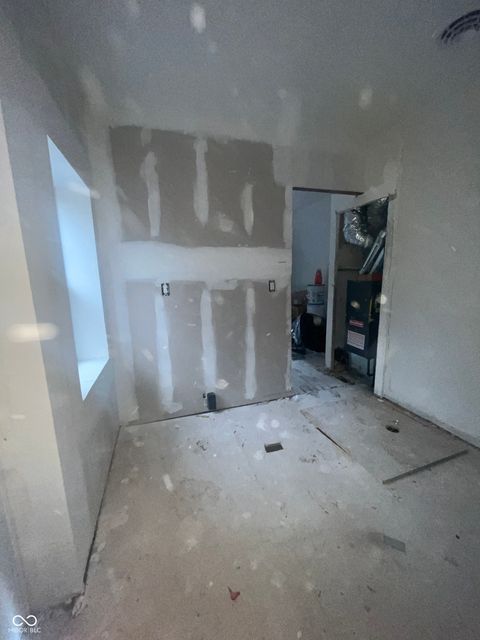
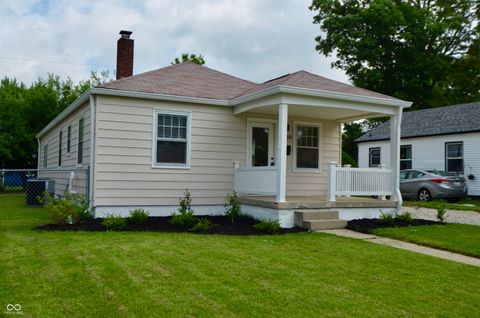
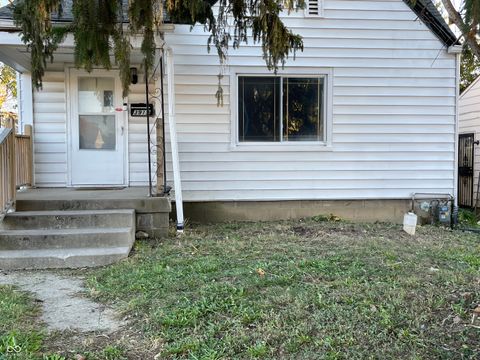
$94,900
2
bds
|
1
ba
|
1,260
sqft
|
built
1947
3101 N Temple Ave, Indianapolis, IN 46218
$402
Cash flow
22.1%
Cash-on-Cash Return
11.3%
Cap rate
1.4%
Rent to Value Ratio
109 out of 114 properties for sale in 46218
Limited Results Shown
Create a free account, or log in to reveal all property listings and enjoy the complete experience.

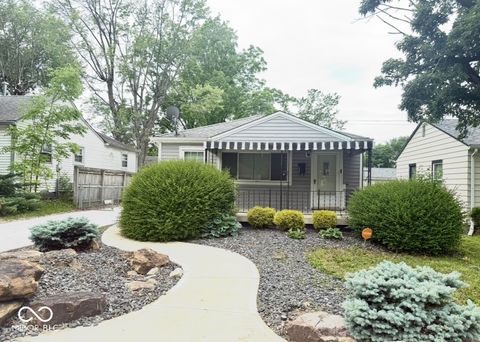
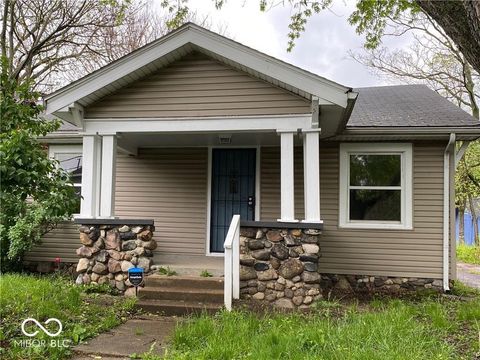
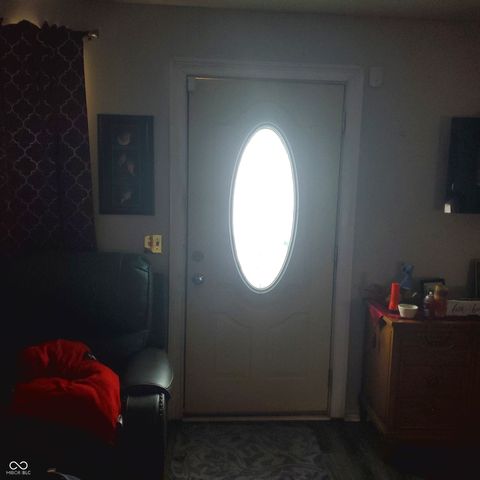
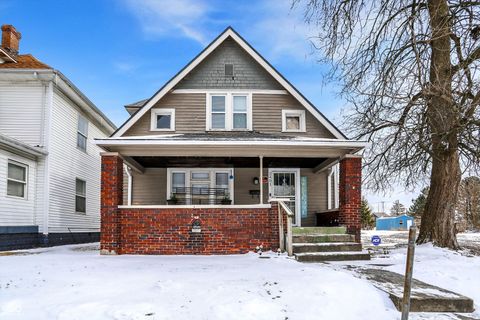
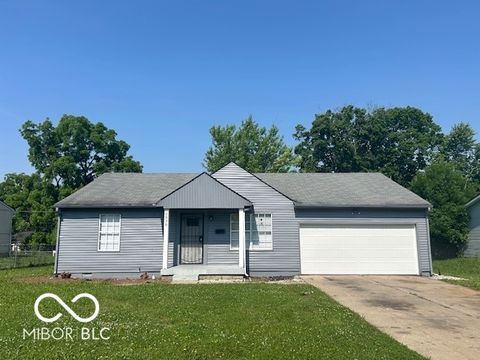
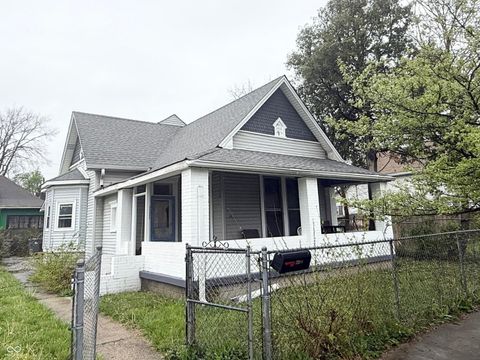
Active
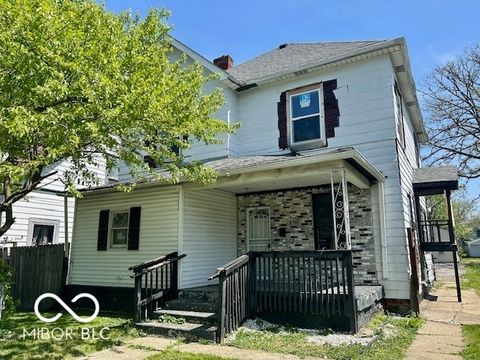
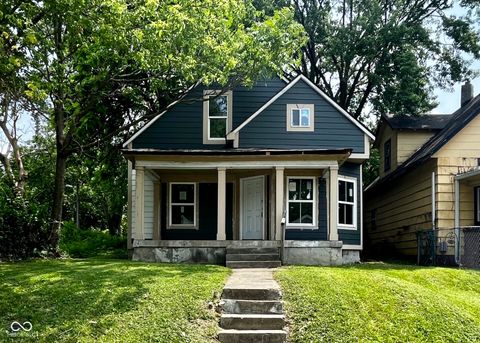
$190,000
3
bds
|
2
ba
|
1,152
sqft
|
built
1971
3026 Stuart St, Indianapolis, IN 46218
$-233
Cash flow
-6.4%
Cash-on-Cash Return
4.8%
Cap rate
0.6%
Rent to Value Ratio
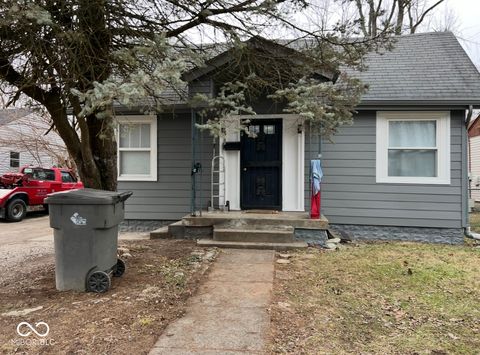
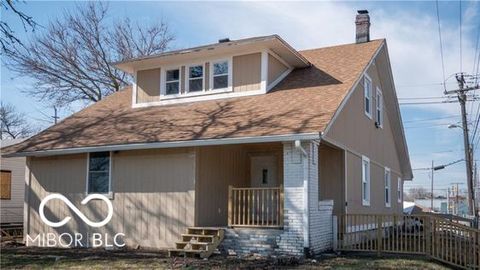
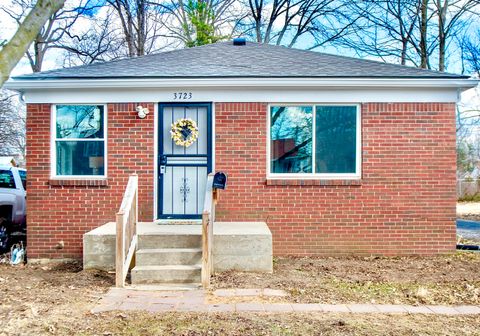
Active
$94,900
2
bds
|
1
ba
|
1,260
sqft
|
built
1947
3101 N Temple Ave, Indianapolis, IN 46218
$402
Cash flow
22.1%
Cash-on-Cash Return
11.3%
Cap rate
1.4%
Rent to Value Ratio
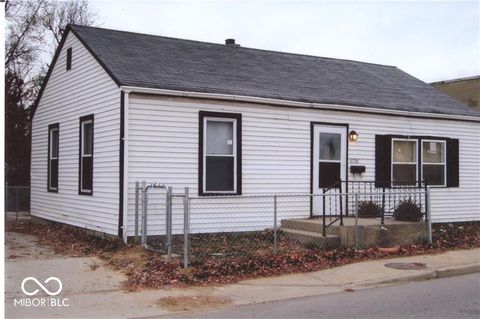
Active
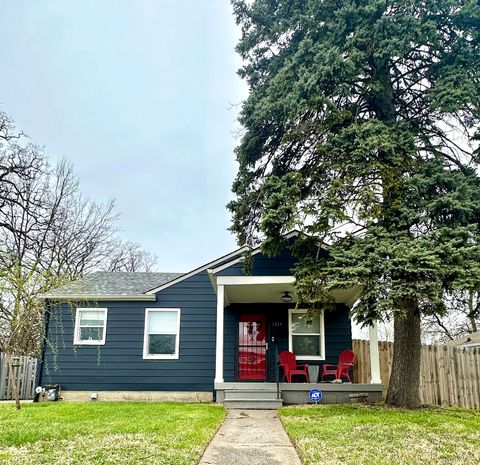
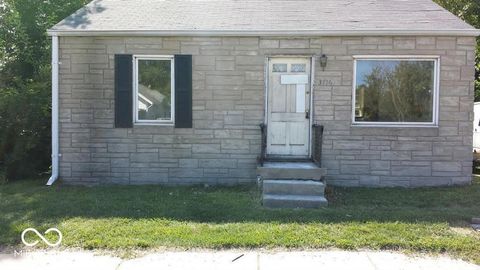
$150,000
3
bds
|
2
ba
|
1,236
sqft
|
built
1940
3626 N Denny St, Indianapolis, IN 46218
$114
Cash flow
4.0%
Cash-on-Cash Return
7.2%
Cap rate
0.9%
Rent to Value Ratio
Active
$180,000
3
bds
|
2
ba
|
1,528
sqft
|
built
1955
2309 N Dearborn St, Indianapolis, IN 46218
$26
Cash flow
0.8%
Cash-on-Cash Return
6.4%
Cap rate
0.8%
Rent to Value Ratio
Active
$114,900
2
bds
|
1
ba
|
938
sqft
|
built
1928
3031 E 38th St, Indianapolis, IN 46218
$159
Cash flow
7.2%
Cash-on-Cash Return
7.9%
Cap rate
1.0%
Rent to Value Ratio
Active
$125,000
2
bds
|
1
ba
|
720
sqft
|
built
1946
2966 N Olney St, Indianapolis, IN 46218
$37
Cash flow
1.5%
Cash-on-Cash Return
6.6%
Cap rate
0.8%
Rent to Value Ratio

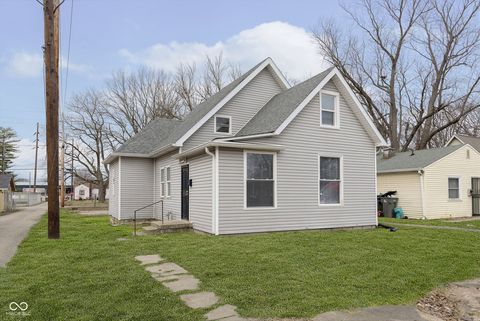
Active
$110,000
3
bds
|
1
ba
|
836
sqft
|
built
1910
2221 Langley Ave, Indianapolis, IN 46218
$254
Cash flow
12.0%
Cash-on-Cash Return
9.0%
Cap rate
1.1%
Rent to Value Ratio
Active
$180,000
3
bds
|
2
ba
|
960
sqft
|
built
1930
2945 N Denny St, Indianapolis, IN 46218
$-43
Cash flow
-1.2%
Cash-on-Cash Return
6.0%
Cap rate
0.7%
Rent to Value Ratio
Active
$169,999
3
bds
|
1
ba
|
912
sqft
|
built
1954
1844 N Riley Ave, Indianapolis, IN 46218
$78
Cash flow
2.4%
Cash-on-Cash Return
6.8%
Cap rate
0.8%
Rent to Value Ratio
Active
$139,900
3
bds
|
1
ba
|
1,152
sqft
|
built
1930
3306 N Drexel Ave, Indianapolis, IN 46218
$98
Cash flow
3.7%
Cash-on-Cash Return
7.1%
Cap rate
0.9%
Rent to Value Ratio
Active
$155,000
3
bds
|
1
ba
|
864
sqft
|
built
1956
5778 E 30th St, Indianapolis, IN 46218
$-119
Cash flow
-4.0%
Cash-on-Cash Return
5.3%
Cap rate
0.6%
Rent to Value Ratio
Active
$200,000
4
bds
|
2
ba
|
1,752
sqft
|
built
1930
1722 N Parker Ave, Indianapolis, IN 46218
$60
Cash flow
1.6%
Cash-on-Cash Return
6.6%
Cap rate
0.8%
Rent to Value Ratio
Active
$129,999
2
bds
|
1
ba
|
672
sqft
|
built
1950
2954 N Drexel Ave, Indianapolis, IN 46218
$80
Cash flow
3.2%
Cash-on-Cash Return
7.0%
Cap rate
0.8%
Rent to Value Ratio
Active
$182,500
3
bds
|
2
ba
|
912
sqft
|
built
1962
3262 Orchard Ave, Indianapolis, IN 46218
$13
Cash flow
0.4%
Cash-on-Cash Return
6.4%
Cap rate
0.8%
Rent to Value Ratio
Active
$98,000
2
bds
|
1
ba
|
836
sqft
|
built
1950
3924 E 30th St, Indianapolis, IN 46218
$247
Cash flow
13.1%
Cash-on-Cash Return
9.3%
Cap rate
1.1%
Rent to Value Ratio
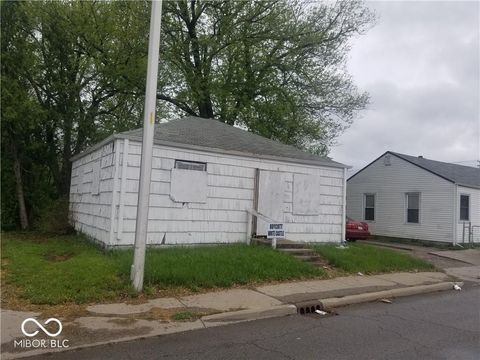
Active
$99,000
2
bds
|
0
ba
|
0
sqft
|
built
1948
2870 Stuart St, Indianapolis, IN 46218
$-103
Cash flow
-5.4%
Cash-on-Cash Return
5.0%
Cap rate
0.6%
Rent to Value Ratio
Active
$105,000
4
bds
|
2
ba
|
1,876
sqft
|
built
1876
2701 N Gale St, Indianapolis, IN 46218
$280
Cash flow
13.9%
Cash-on-Cash Return
9.5%
Cap rate
1.1%
Rent to Value Ratio
Active
$200,000
2
bds
|
2
ba
|
720
sqft
|
built
1948
1624 N Whittier Pl, Indianapolis, IN 46218
$129
Cash flow
3.4%
Cash-on-Cash Return
7.0%
Cap rate
0.9%
Rent to Value Ratio
Active
$99,000
2
bds
|
1
ba
|
816
sqft
|
built
1950
3616 N Dearborn St, Indianapolis, IN 46218
$390
Cash flow
20.6%
Cash-on-Cash Return
10.9%
Cap rate
1.3%
Rent to Value Ratio
Active
$205,000
3
bds
|
3
ba
|
1,840
sqft
|
built
1958
2263 N Rural St, Indianapolis, IN 46218
$-104
Cash flow
-2.6%
Cash-on-Cash Return
5.7%
Cap rate
0.7%
Rent to Value Ratio
Active
$235,000
2
bds
|
1
ba
|
800
sqft
|
built
1920
2624 E 17th St, Indianapolis, IN 46218
$-537
Cash flow
-11.9%
Cash-on-Cash Return
3.5%
Cap rate
0.4%
Rent to Value Ratio
Active
$154,900
2
bds
|
3
ba
|
1,252
sqft
|
built
1952
3701 N Audubon Rd, Indianapolis, IN 46218
$157
Cash flow
5.3%
Cash-on-Cash Return
7.5%
Cap rate
0.9%
Rent to Value Ratio
Active
$124,000
2
bds
|
1
ba
|
625
sqft
|
built
1947
2421 N Arsenal Ave, Indianapolis, IN 46218
$181
Cash flow
7.6%
Cash-on-Cash Return
8.0%
Cap rate
1.0%
Rent to Value Ratio
Active
$138,000
2
bds
|
1
ba
|
1,492
sqft
|
built
1917
2401 N Olney St, Indianapolis, IN 46218
$246
Cash flow
9.3%
Cash-on-Cash Return
8.4%
Cap rate
1.0%
Rent to Value Ratio
Active
$250,000
5
bds
|
5
ba
|
1,711
sqft
|
built
1920
2968 N Arsenal Ave, Indianapolis, IN 46218
$-684
Cash flow
-14.3%
Cash-on-Cash Return
3.0%
Cap rate
0.4%
Rent to Value Ratio
Active
$219,900
3
bds
|
2
ba
|
1,032
sqft
|
built
1951
3726 N Emerson Ave, Indianapolis, IN 46218
$-320
Cash flow
-7.6%
Cash-on-Cash Return
4.5%
Cap rate
0.5%
Rent to Value Ratio
Active
$190,000
3
bds
|
2
ba
|
1,600
sqft
|
built
1982
2930 N Rural St, Indianapolis, IN 46218
$-26
Cash flow
-0.7%
Cash-on-Cash Return
6.1%
Cap rate
0.7%
Rent to Value Ratio
Active
$189,995
4
bds
|
2
ba
|
2,043
sqft
|
built
1930
3102 N Arsenal Ave, Indianapolis, IN 46218
$-95
Cash flow
-2.6%
Cash-on-Cash Return
5.7%
Cap rate
0.7%
Rent to Value Ratio
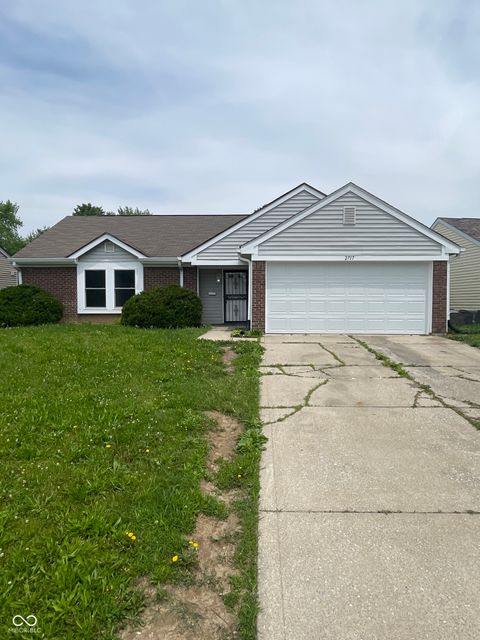
Active
$195,000
3
bds
|
2
ba
|
1,064
sqft
|
built
1994
2717 N Rural St, Indianapolis, IN 46218
$-52
Cash flow
-1.4%
Cash-on-Cash Return
5.9%
Cap rate
0.7%
Rent to Value Ratio
Active
$219,900
2
bds
|
1
ba
|
672
sqft
|
built
1950
3722 N Emerson Ave, Indianapolis, IN 46218
$-458
Cash flow
-10.9%
Cash-on-Cash Return
3.8%
Cap rate
0.5%
Rent to Value Ratio
Active
$155,000
3
bds
|
2
ba
|
912
sqft
|
built
1931
2030 Houston St, Indianapolis, IN 46218
$295
Cash flow
9.9%
Cash-on-Cash Return
8.5%
Cap rate
1.0%
Rent to Value Ratio
Active
$194,900
2
bds
|
1
ba
|
1,296
sqft
|
built
1950
5430 E 17th St, Indianapolis, IN 46218
$106
Cash flow
2.8%
Cash-on-Cash Return
6.8%
Cap rate
0.8%
Rent to Value Ratio
Active
$110,900
3
bds
|
1
ba
|
1,780
sqft
|
built
1935
2955 N Olney St, Indianapolis, IN 46218
$387
Cash flow
18.2%
Cash-on-Cash Return
10.5%
Cap rate
1.3%
Rent to Value Ratio
Active
$67,900
2
bds
|
1
ba
|
720
sqft
|
built
1951
2959 N Lasalle St, Indianapolis, IN 46218
$759
Cash flow
13.0%
Cash-on-Cash Return
13.4%
Cap rate
1.6%
Rent to Value Ratio
Active
$219,900
2
bds
|
1
ba
|
672
sqft
|
built
1950
3716 N Emerson Ave, Indianapolis, IN 46218
$-389
Cash flow
-9.2%
Cash-on-Cash Return
4.1%
Cap rate
0.5%
Rent to Value Ratio

Active
$95,000
3
bds
|
1
ba
|
1,080
sqft
|
built
1951
4109 E 21st St, Indianapolis, IN 46218
$401
Cash flow
22.0%
Cash-on-Cash Return
11.3%
Cap rate
1.4%
Rent to Value Ratio
Active
$145,000
2
bds
|
1
ba
|
2,112
sqft
|
built
1941
3752 N Oxford St, Indianapolis, IN 46218
$209
Cash flow
7.5%
Cash-on-Cash Return
8.0%
Cap rate
1.0%
Rent to Value Ratio
Active
$149,999
3
bds
|
3
ba
|
1,857
sqft
|
built
1940
3919 E 34th St, Indianapolis, IN 46218
$183
Cash flow
6.4%
Cash-on-Cash Return
7.7%
Cap rate
0.9%
Rent to Value Ratio
Active
$135,000
3
bds
|
1
ba
|
1,724
sqft
|
built
1955
2208 N Avondale Pl, Indianapolis, IN 46218
$330
Cash flow
12.8%
Cash-on-Cash Return
9.2%
Cap rate
1.1%
Rent to Value Ratio
Active
$166,900
2
bds
|
1
ba
|
900
sqft
|
built
1950
3723 N Olney St, Indianapolis, IN 46218
$-43
Cash flow
-1.3%
Cash-on-Cash Return
6.0%
Cap rate
0.7%
Rent to Value Ratio