46218 Investment Properties for Sale
Browse homes for sale and investment properties in 46218. Refine your search by price, property type, or more.
Best cash flowing properties in 46218
Active
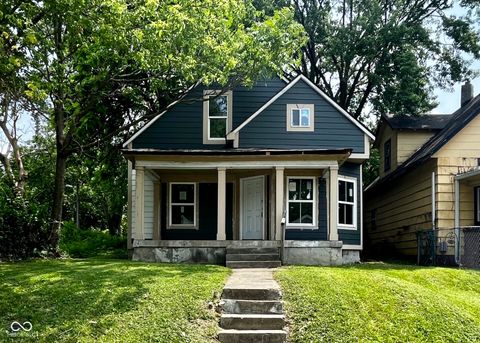
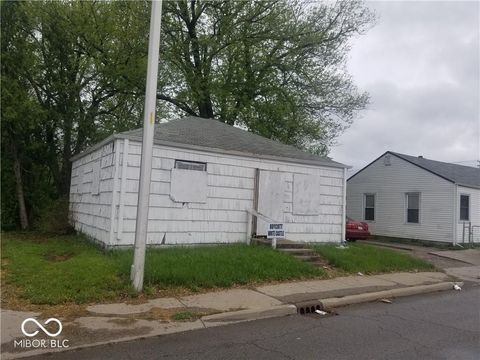
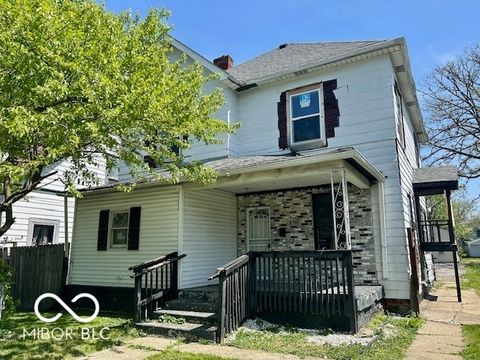
$90,900
3
bds
|
1
ba
|
1,780
sqft
|
built
1935
2955 N Olney St, Indianapolis, IN 46218
$500
Cash flow
28.7%
Cash-on-Cash Return
12.8%
Cap rate
1.5%
Rent to Value Ratio

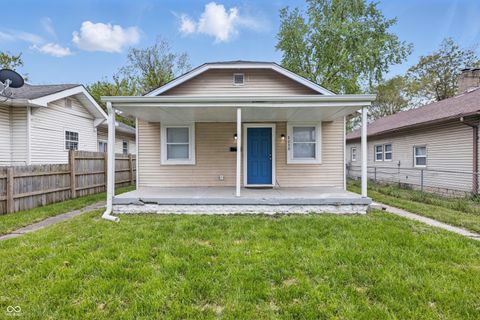
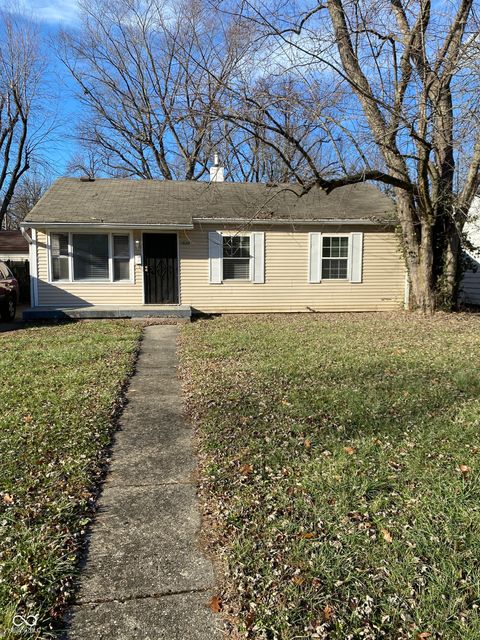
Active
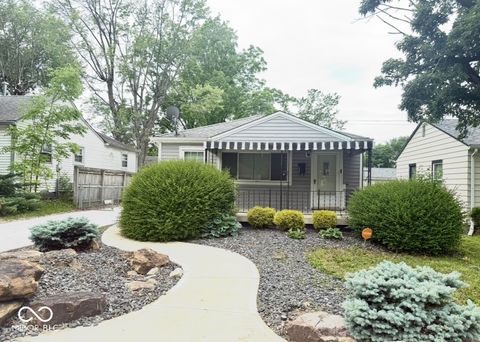
$83,000
3
bds
|
1
ba
|
1,036
sqft
|
built
1930
2866 Forest Manor Ave, Indianapolis, IN 46218
$472
Cash flow
29.7%
Cash-on-Cash Return
13.0%
Cap rate
1.6%
Rent to Value Ratio
86 out of 90 properties for sale in 46218
Limited Results Shown
Create a free account, or log in to reveal all property listings and enjoy the complete experience.

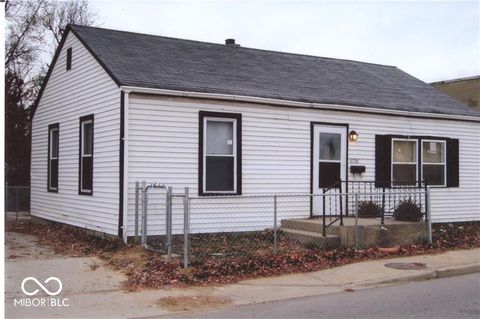
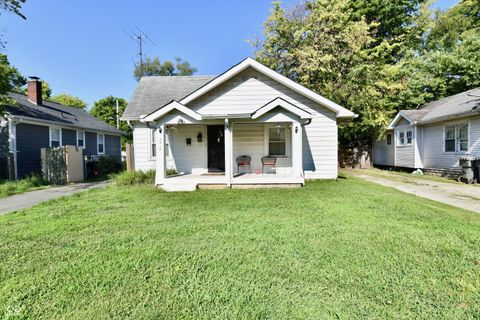
Active
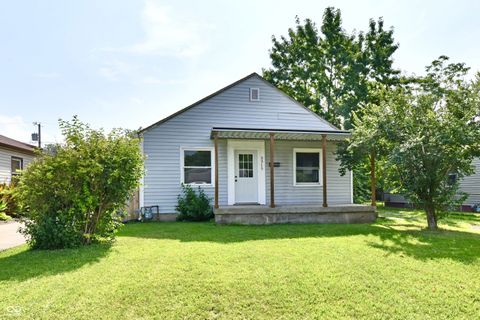
$150,000
3
bds
|
1
ba
|
1,009
sqft
|
built
1956
3107 Wallace Ave, Indianapolis, IN 46218
$129
Cash flow
4.5%
Cash-on-Cash Return
7.2%
Cap rate
0.9%
Rent to Value Ratio

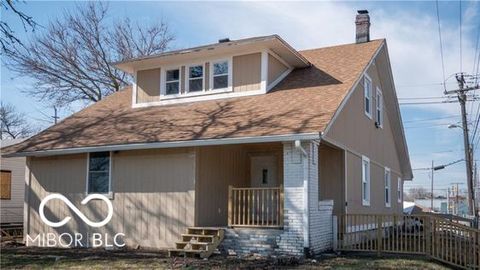
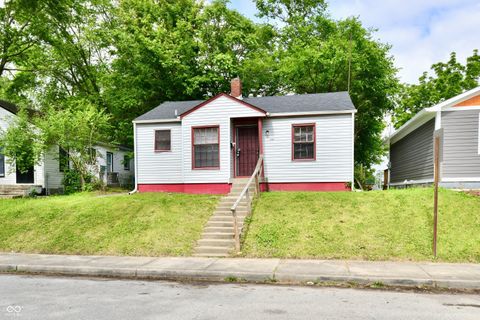
Active
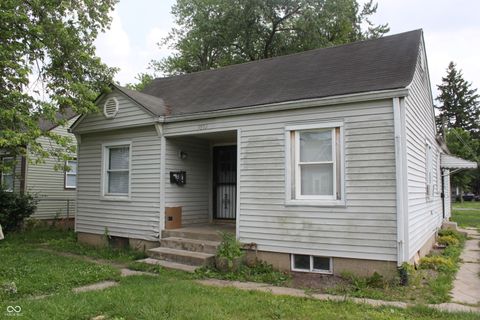
$89,900
3
bds
|
1
ba
|
1,384
sqft
|
built
1935
3547 N Emerson Ave, Indianapolis, IN 46218
$436
Cash flow
25.3%
Cash-on-Cash Return
12.0%
Cap rate
1.4%
Rent to Value Ratio

Active
$114,998
2
bds
|
1
ba
|
625
sqft
|
built
1947
2421 N Arsenal Ave, Indianapolis, IN 46218
$239
Cash flow
10.8%
Cash-on-Cash Return
8.6%
Cap rate
1.0%
Rent to Value Ratio
Active
$145,000
3
bds
|
2
ba
|
912
sqft
|
built
1931
2030 Houston St, Indianapolis, IN 46218
$361
Cash flow
13.0%
Cash-on-Cash Return
9.1%
Cap rate
1.1%
Rent to Value Ratio
Active
$219,900
3
bds
|
2
ba
|
1,032
sqft
|
built
1951
3726 N Emerson Ave, Indianapolis, IN 46218
$-298
Cash flow
-7.1%
Cash-on-Cash Return
4.5%
Cap rate
0.5%
Rent to Value Ratio
Active
$250,000
5
bds
|
5
ba
|
1,711
sqft
|
built
1920
2968 N Arsenal Ave, Indianapolis, IN 46218
$-660
Cash flow
-13.8%
Cash-on-Cash Return
3.0%
Cap rate
0.4%
Rent to Value Ratio

Active
$149,900
2
bds
|
3
ba
|
1,252
sqft
|
built
1952
3701 N Audubon Rd, Indianapolis, IN 46218
$198
Cash flow
6.9%
Cash-on-Cash Return
7.7%
Cap rate
0.9%
Rent to Value Ratio
Active
$219,900
2
bds
|
1
ba
|
672
sqft
|
built
1950
3722 N Emerson Ave, Indianapolis, IN 46218
$-436
Cash flow
-10.3%
Cash-on-Cash Return
3.8%
Cap rate
0.5%
Rent to Value Ratio

Active
$200,000
3
bds
|
1
ba
|
936
sqft
|
built
1961
3125 N Bancroft St, Indianapolis, IN 46218
$-127
Cash flow
-3.3%
Cash-on-Cash Return
5.4%
Cap rate
0.7%
Rent to Value Ratio

Active
$150,000
3
bds
|
2
ba
|
1,082
sqft
|
built
1990
2740 N Rural St, Indianapolis, IN 46218
$336
Cash flow
11.7%
Cash-on-Cash Return
8.8%
Cap rate
1.1%
Rent to Value Ratio

Active
$299,999
2
bds
|
0
ba
|
0
sqft
|
built
1981
5703 E 17th St, Indianapolis, IN 46218
$-709
Cash flow
-12.3%
Cash-on-Cash Return
3.3%
Cap rate
0.4%
Rent to Value Ratio

Active
$184,000
2
bds
|
1
ba
|
1,280
sqft
|
built
1951
5927 E 23rd St, Indianapolis, IN 46218
$23
Cash flow
0.7%
Cash-on-Cash Return
6.3%
Cap rate
0.8%
Rent to Value Ratio

Active
$165,000
3
bds
|
2
ba
|
1,068
sqft
|
built
1963
3320 E 26th St, Indianapolis, IN 46218
$52
Cash flow
1.6%
Cash-on-Cash Return
6.5%
Cap rate
0.8%
Rent to Value Ratio
Active
$150,000
3
bds
|
1
ba
|
925
sqft
|
built
1950
3520 N Butler Ave, Indianapolis, IN 46218
$-78
Cash flow
-2.7%
Cash-on-Cash Return
5.5%
Cap rate
0.7%
Rent to Value Ratio

Active
$98,500
1
bds
|
3
ba
|
1,490
sqft
|
built
1920
2332 N Parker Ave, Indianapolis, IN 46218
$323
Cash flow
17.1%
Cash-on-Cash Return
10.1%
Cap rate
1.2%
Rent to Value Ratio

Active
$219,000
3
bds
|
3
ba
|
1,920
sqft
|
built
1955
2341 N Rural St, Indianapolis, IN 46218
$-225
Cash flow
-5.4%
Cash-on-Cash Return
4.9%
Cap rate
0.6%
Rent to Value Ratio

Active
$159,900
3
bds
|
1
ba
|
1,802
sqft
|
built
1949
3241 N Keystone Ave, Indianapolis, IN 46218
$147
Cash flow
4.8%
Cash-on-Cash Return
7.2%
Cap rate
0.9%
Rent to Value Ratio
Active
$120,000
2
bds
|
1
ba
|
904
sqft
|
built
1930
3412 Brouse Ave, Indianapolis, IN 46218
$282
Cash flow
12.3%
Cash-on-Cash Return
9.0%
Cap rate
1.1%
Rent to Value Ratio
Active
$120,000
2
bds
|
1
ba
|
720
sqft
|
built
1946
2966 N Olney St, Indianapolis, IN 46218
$75
Cash flow
3.3%
Cash-on-Cash Return
6.9%
Cap rate
0.8%
Rent to Value Ratio

Active
$95,000
3
bds
|
1
ba
|
836
sqft
|
built
1910
2221 Langley Ave, Indianapolis, IN 46218
$341
Cash flow
18.7%
Cash-on-Cash Return
10.5%
Cap rate
1.3%
Rent to Value Ratio
Active
$100,000
4
bds
|
2
ba
|
1,876
sqft
|
built
1876
2701 N Gale St, Indianapolis, IN 46218
$316
Cash flow
16.5%
Cash-on-Cash Return
9.9%
Cap rate
1.2%
Rent to Value Ratio
Active
$164,999
3
bds
|
1
ba
|
912
sqft
|
built
1954
1844 N Riley Ave, Indianapolis, IN 46218
$121
Cash flow
3.8%
Cash-on-Cash Return
7.0%
Cap rate
0.8%
Rent to Value Ratio

Active
$269,900
4
bds
|
4
ba
|
2,000
sqft
|
built
1903
2430 Stuart St, Indianapolis, IN 46218
$-555
Cash flow
-10.7%
Cash-on-Cash Return
3.7%
Cap rate
0.4%
Rent to Value Ratio

Active
$119,999
3
bds
|
1
ba
|
1,044
sqft
|
built
1930
4311 E 30th St, Indianapolis, IN 46218
$144
Cash flow
6.3%
Cash-on-Cash Return
7.6%
Cap rate
0.9%
Rent to Value Ratio
Active
$159,900
2
bds
|
1
ba
|
780
sqft
|
built
1943
3315 N Euclid Ave, Indianapolis, IN 46218
$147
Cash flow
4.8%
Cash-on-Cash Return
7.2%
Cap rate
0.9%
Rent to Value Ratio
Active
$179,000
0
bds
|
0
ba
|
0
sqft
|
built
1946
1703 E 34th St, Indianapolis, IN 46218
$-158
Cash flow
-4.6%
Cash-on-Cash Return
5.1%
Cap rate
0.6%
Rent to Value Ratio

Active
$135,000
2
bds
|
1
ba
|
832
sqft
|
built
1952
3440 N Emerson Ave, Indianapolis, IN 46218
$136
Cash flow
5.3%
Cash-on-Cash Return
7.4%
Cap rate
0.9%
Rent to Value Ratio

Active
$100,000
3
bds
|
1
ba
|
1,365
sqft
|
built
1928
2835 N Gale St, Indianapolis, IN 46218
$454
Cash flow
23.7%
Cash-on-Cash Return
11.6%
Cap rate
1.4%
Rent to Value Ratio

Active
$239,900
4
bds
|
3
ba
|
2,093
sqft
|
built
1916
1618 N Rural St, Indianapolis, IN 46218
$13
Cash flow
0.3%
Cash-on-Cash Return
6.2%
Cap rate
0.8%
Rent to Value Ratio
Active
$122,000
3
bds
|
1
ba
|
1,200
sqft
|
built
1955
3132 Wallace Ave, Indianapolis, IN 46218
$272
Cash flow
11.6%
Cash-on-Cash Return
8.8%
Cap rate
1.1%
Rent to Value Ratio

Active
$159,900
2
bds
|
1
ba
|
900
sqft
|
built
1950
3723 N Olney St, Indianapolis, IN 46218
$9
Cash flow
0.3%
Cash-on-Cash Return
6.2%
Cap rate
0.8%
Rent to Value Ratio
Active
$219,900
2
bds
|
1
ba
|
672
sqft
|
built
1950
3716 N Emerson Ave, Indianapolis, IN 46218
$-367
Cash flow
-8.7%
Cash-on-Cash Return
4.1%
Cap rate
0.5%
Rent to Value Ratio
Active
$309,000
4
bds
|
2
ba
|
1,576
sqft
|
built
1948
1649 N Arsenal Ave, Indianapolis, IN 46218
$-617
Cash flow
-10.4%
Cash-on-Cash Return
3.8%
Cap rate
0.5%
Rent to Value Ratio

Active
$229,900
3
bds
|
1
ba
|
1,296
sqft
|
built
1927
4950 E 18th St, Indianapolis, IN 46218
$-212
Cash flow
-4.8%
Cash-on-Cash Return
5.0%
Cap rate
0.6%
Rent to Value Ratio

Active
$143,000
3
bds
|
1
ba
|
1,056
sqft
|
built
1941
3508 Brouse Ave, Indianapolis, IN 46218
$164
Cash flow
6.0%
Cash-on-Cash Return
7.5%
Cap rate
0.9%
Rent to Value Ratio

Active
$149,000
2
bds
|
2
ba
|
992
sqft
|
built
1909
2219 Hovey St, Indianapolis, IN 46218
$-73
Cash flow
-2.6%
Cash-on-Cash Return
5.6%
Cap rate
0.7%
Rent to Value Ratio

Active
$179,900
3
bds
|
2
ba
|
1,248
sqft
|
built
1998
2718 N Olney St, Indianapolis, IN 46218
$-94
Cash flow
-2.7%
Cash-on-Cash Return
5.5%
Cap rate
0.7%
Rent to Value Ratio

Active
$110,900
2
bds
|
1
ba
|
720
sqft
|
built
1951
3305 E 30th St, Indianapolis, IN 46218
$467
Cash flow
22.0%
Cash-on-Cash Return
11.2%
Cap rate
1.4%
Rent to Value Ratio