46226 Investment Properties for Sale
Browse homes for sale and investment properties in 46226. Refine your search by price, property type, or more.
Best cash flowing properties in 46226
Active
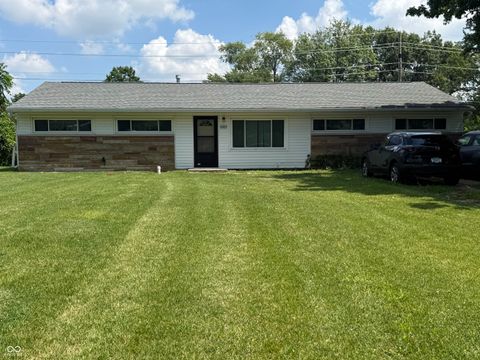
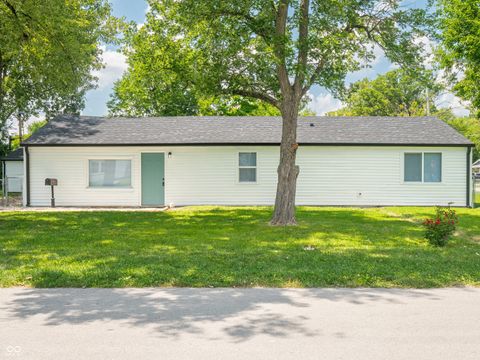
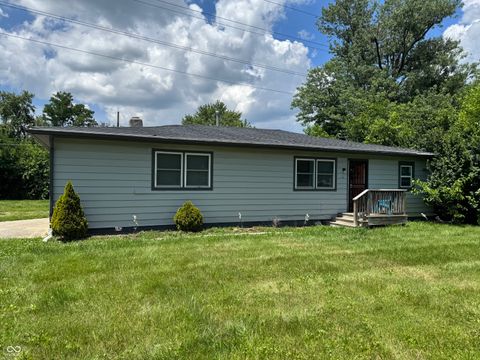
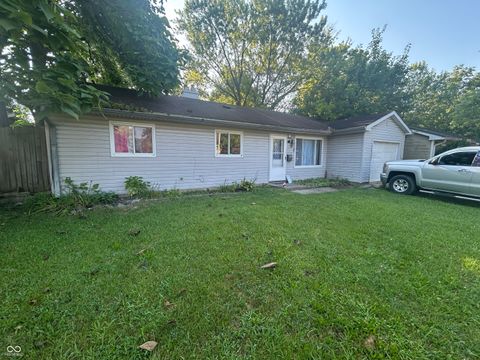
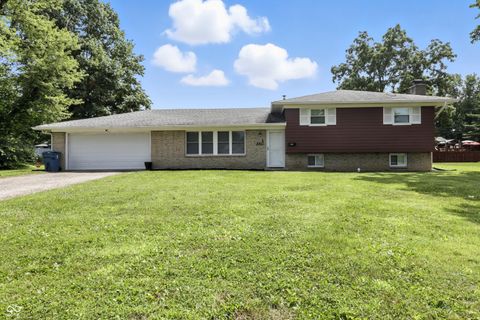
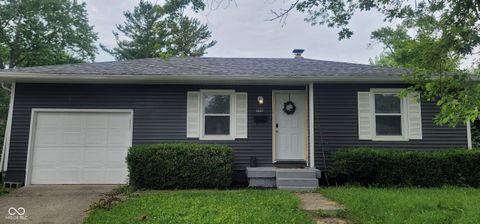
$120,000
4
bds
|
2
ba
|
1,508
sqft
|
built
1956
3107 Radford Dr, Indianapolis, IN 46226
$420
Cash flow
18.3%
Cash-on-Cash Return
10.4%
Cap rate
1.3%
Rent to Value Ratio
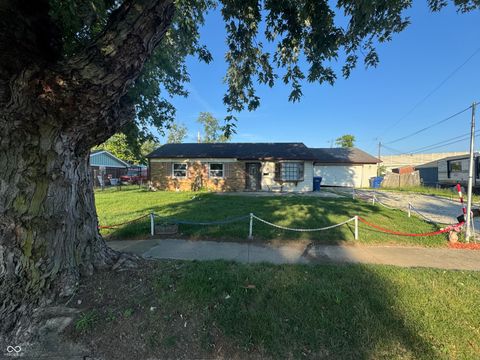
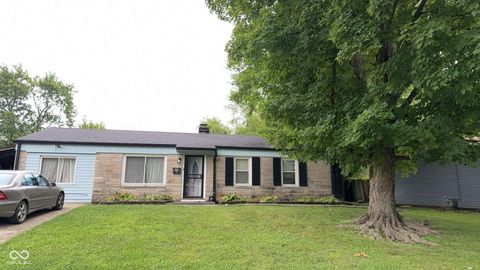
Active
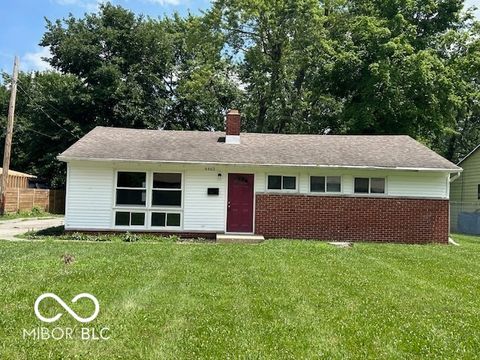
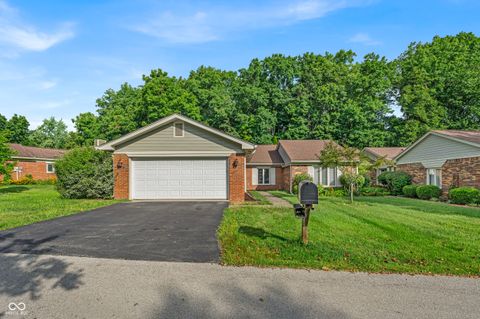
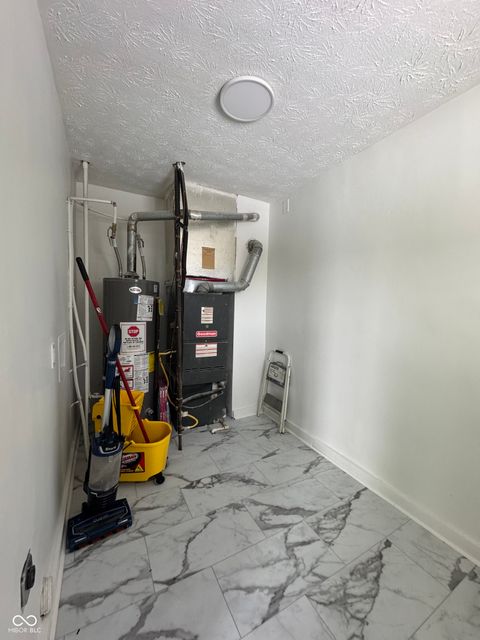
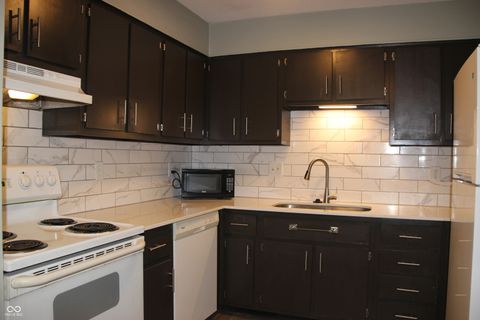
$120,000
3
bds
|
2
ba
|
976
sqft
|
built
1961
5140 Kingman Dr, Indianapolis, IN 46226
$351
Cash flow
15.3%
Cash-on-Cash Return
9.7%
Cap rate
1.2%
Rent to Value Ratio
63 out of 70 properties for sale in 46226
Limited Results Shown
Create a free account, or log in to reveal all property listings and enjoy the complete experience.
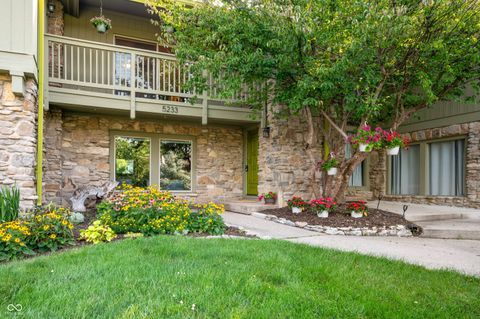
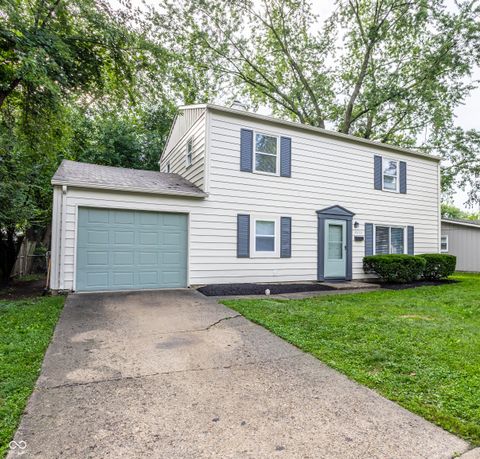
Active
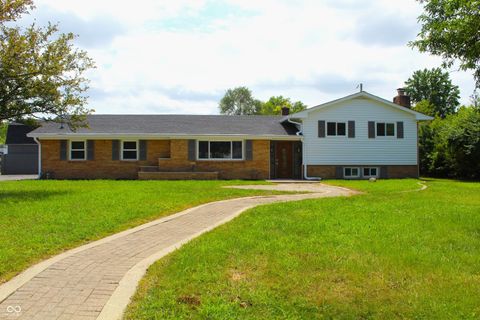
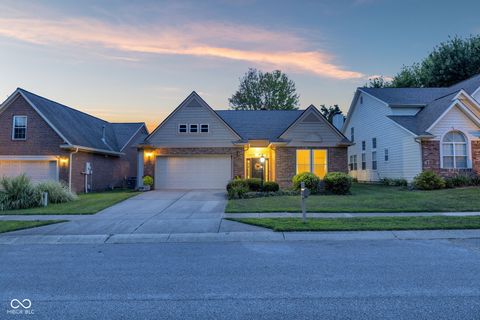
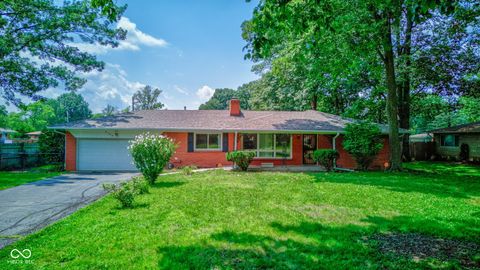
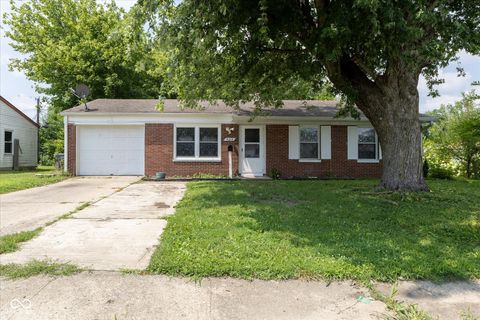
$319,900
2
bds
|
3
ba
|
1,687
sqft
|
built
1966
5233 Nob Ln, Indianapolis, IN 46226
$-763
Cash flow
-12.4%
Cash-on-Cash Return
3.3%
Cap rate
0.6%
Rent to Value Ratio
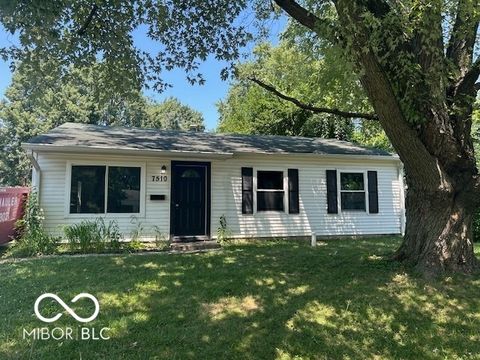
Active
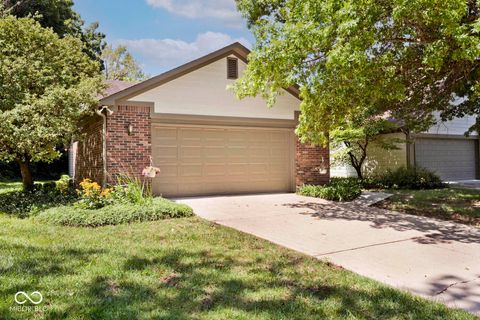
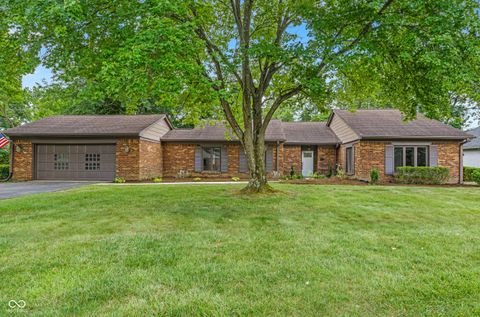
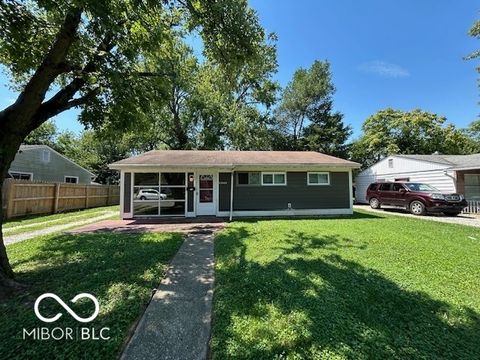
$205,000
3
bds
|
2
ba
|
1,644
sqft
|
built
1958
7422 E 33rd St, Indianapolis, IN 46226
$54
Cash flow
1.4%
Cash-on-Cash Return
6.5%
Cap rate
0.8%
Rent to Value Ratio

Active
$159,900
2
bds
|
2
ba
|
1,224
sqft
|
built
1957
5027 E 40th St, Indianapolis, IN 46226
$78
Cash flow
2.5%
Cash-on-Cash Return
6.7%
Cap rate
0.8%
Rent to Value Ratio

Active
$225,000
4
bds
|
2
ba
|
1,924
sqft
|
built
1957
6117 Marilyn Rd, Indianapolis, IN 46226
$-49
Cash flow
-1.1%
Cash-on-Cash Return
5.9%
Cap rate
0.7%
Rent to Value Ratio

Active
$435,000
4
bds
|
3
ba
|
3,115
sqft
|
built
1954
3975 Denwood Dr, Indianapolis, IN 46226
$-710
Cash flow
-8.5%
Cash-on-Cash Return
4.2%
Cap rate
0.5%
Rent to Value Ratio

Active
$210,000
bds
|
0
ba
|
0
sqft
|
built
1965
6857 E 42nd St, Indianapolis, IN 46226
$-317
Cash flow
-7.9%
Cash-on-Cash Return
4.3%
Cap rate
0.5%
Rent to Value Ratio

Active
$165,000
3
bds
|
1
ba
|
1,528
sqft
|
built
1956
4025 Campbell Ave, Indianapolis, IN 46226
$52
Cash flow
1.6%
Cash-on-Cash Return
6.5%
Cap rate
0.8%
Rent to Value Ratio
Active
$225,000
5
bds
|
3
ba
|
2,132
sqft
|
built
1960
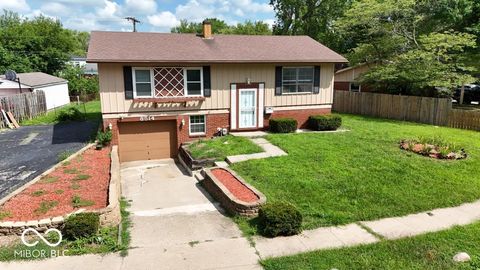
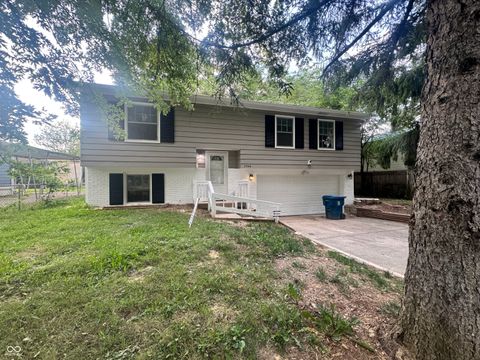
8514 E 36th Pl, Indianapolis, IN 46226
$-118
Cash flow
-2.7%
Cash-on-Cash Return
5.5%
Cap rate
0.7%
Rent to Value Ratio
Active
$196,000
4
bds
|
2
ba
|
1,960
sqft
|
built
1962
3544 Cecil Ave, Indianapolis, IN 46226
$-38
Cash flow
-1.0%
Cash-on-Cash Return
5.9%
Cap rate
0.7%
Rent to Value Ratio
Active
$139,900
3
bds
|
1
ba
|
1,053
sqft
|
built
1945
3944 N Elizabeth St, Indianapolis, IN 46226
$249
Cash flow
9.3%
Cash-on-Cash Return
8.3%
Cap rate
1.0%
Rent to Value Ratio
Active
$145,000
3
bds
|
1
ba
|
944
sqft
|
built
1957
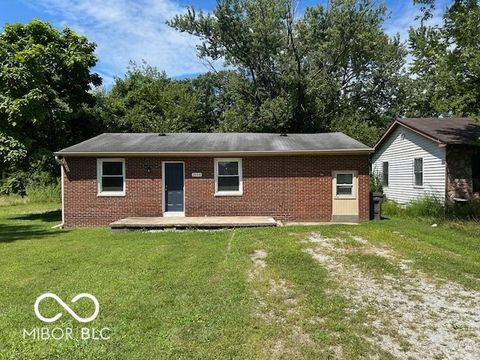
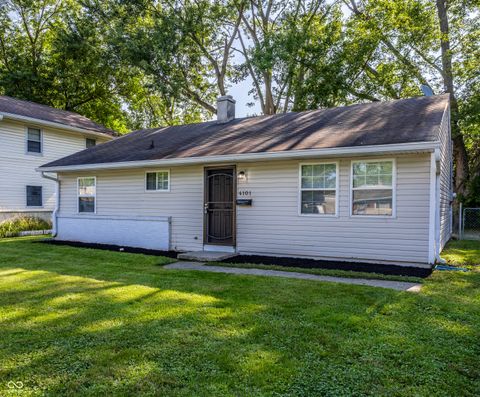
4101 N Arlington Ave, Indianapolis, IN 46226
$223
Cash flow
8.0%
Cash-on-Cash Return
8.0%
Cap rate
1.0%
Rent to Value Ratio
Active
$249,900
3
bds
|
2
ba
|
1,620
sqft
|
built
1953
4690 N Sadlier Dr, Indianapolis, IN 46226
$-176
Cash flow
-3.7%
Cash-on-Cash Return
5.3%
Cap rate
0.6%
Rent to Value Ratio
Active
$164,900
3
bds
|
1
ba
|
1,176
sqft
|
built
1956
4463 N Bolton Ave, Indianapolis, IN 46226
$-17
Cash flow
-0.5%
Cash-on-Cash Return
6.0%
Cap rate
0.7%
Rent to Value Ratio
Active
$324,500
4
bds
|
2
ba
|
2,843
sqft
|
built
1961
6327 E 52nd Pl, Indianapolis, IN 46226
$-78
Cash flow
-1.3%
Cash-on-Cash Return
5.9%
Cap rate
0.7%
Rent to Value Ratio
Active
$175,000
3
bds
|
1
ba
|
920
sqft
|
built
1953
7307 Twin Beech Dr, Indianapolis, IN 46226
$70
Cash flow
2.1%
Cash-on-Cash Return
6.6%
Cap rate
0.8%
Rent to Value Ratio

Active
$150,000
2
bds
|
1
ba
|
672
sqft
|
built
1953
7334 Westchester Dr, Indianapolis, IN 46226
$-9
Cash flow
-0.3%
Cash-on-Cash Return
6.1%
Cap rate
0.7%
Rent to Value Ratio

Active
$218,900
2
bds
|
2
ba
|
1,413
sqft
|
built
1977
5491 Vin Rose Ln, Lawrence, IN 46226
$-450
Cash flow
-10.7%
Cash-on-Cash Return
3.7%
Cap rate
0.7%
Rent to Value Ratio

Active
$144,900
2
bds
|
1
ba
|
616
sqft
|
built
1938
4715 Normal Ave, Indianapolis, IN 46226
$17
Cash flow
0.6%
Cash-on-Cash Return
6.3%
Cap rate
0.8%
Rent to Value Ratio
Active
$160,000
3
bds
|
1
ba
|
1,294
sqft
|
built
1956
4006 Kenneth Ave, Indianapolis, IN 46226
$284
Cash flow
9.3%
Cash-on-Cash Return
8.3%
Cap rate
1.0%
Rent to Value Ratio
Active
$285,000
2
bds
|
3
ba
|
1,926
sqft
|
built
1978
5228 Greenwillow Rd, Indianapolis, IN 46226
$-633
Cash flow
-11.6%
Cash-on-Cash Return
3.5%
Cap rate
0.7%
Rent to Value Ratio
Active
$500,000
3
bds
|
2
ba
|
1,826
sqft
|
built
1996
4720 Mallard View Dr, Indianapolis, IN 46226
$-696
Cash flow
-7.3%
Cash-on-Cash Return
4.5%
Cap rate
0.6%
Rent to Value Ratio
Active
$225,000
2
bds
|
2
ba
|
1,634
sqft
|
built
1990
5214 Greenwillow Ct, Indianapolis, IN 46226
$-490
Cash flow
-11.4%
Cash-on-Cash Return
3.5%
Cap rate
0.8%
Rent to Value Ratio
Active
$130,000
3
bds
|
1
ba
|
1,055
sqft
|
built
1960
3733 Harvest Ave, Indianapolis, IN 46226
$300
Cash flow
12.0%
Cash-on-Cash Return
8.9%
Cap rate
1.1%
Rent to Value Ratio

Active
$989,900
4
bds
|
4
ba
|
6,316
sqft
|
built
1947
6230 E 56th St, Indianapolis, IN 46226
$-621
Cash flow
-3.3%
Cash-on-Cash Return
5.4%
Cap rate
0.7%
Rent to Value Ratio
Active
$215,000
3
bds
|
2
ba
|
1,524
sqft
|
built
1955
7406 E 33rd St, Indianapolis, IN 46226
$-135
Cash flow
-3.3%
Cash-on-Cash Return
5.4%
Cap rate
0.7%
Rent to Value Ratio

Active
$1,999,900
bds
|
0
ba
|
0
sqft
|
built
1964
3805 Biscayne Rd, Indianapolis, IN 46226
$-9,623
Cash flow
-25.1%
Cash-on-Cash Return
0.4%
Cap rate
0.0%
Rent to Value Ratio
Active
$265,000
3
bds
|
2
ba
|
1,653
sqft
|
built
1958
5108 Chatham Pl, Indianapolis, IN 46226
$23
Cash flow
0.5%
Cash-on-Cash Return
6.2%
Cap rate
0.8%
Rent to Value Ratio
Active
$279,000
2
bds
|
2
ba
|
1,847
sqft
|
built
1978
5201 Hawks Point Rd, Indianapolis, IN 46226
$-739
Cash flow
-13.8%
Cash-on-Cash Return
3.0%
Cap rate
0.6%
Rent to Value Ratio
Active
$319,900
4
bds
|
3
ba
|
2,330
sqft
|
built
1961
5451 Daniel Dr, Indianapolis, IN 46226
$-259
Cash flow
-4.2%
Cash-on-Cash Return
5.2%
Cap rate
0.6%
Rent to Value Ratio
Active
$130,000
3
bds
|
1
ba
|
900
sqft
|
built
1958
6702 E 43rd Pl, Indianapolis, IN 46226
$300
Cash flow
12.0%
Cash-on-Cash Return
8.9%
Cap rate
1.1%
Rent to Value Ratio
Active
$194,000
4
bds
|
2
ba
|
1,700
sqft
|
built
1961
3659 N Mitchner Ave, Indianapolis, IN 46226
$110
Cash flow
3.0%
Cash-on-Cash Return
6.8%
Cap rate
0.8%
Rent to Value Ratio
Active
$134,900
3
bds
|
1
ba
|
1,008
sqft
|
built
1959
7510 E 34th St, Indianapolis, IN 46226
$137
Cash flow
5.3%
Cash-on-Cash Return
7.4%
Cap rate
0.9%
Rent to Value Ratio
Active
$182,500
3
bds
|
2
ba
|
1,526
sqft
|
built
1968
3531 Lombardy Pl, Indianapolis, IN 46226
$169
Cash flow
4.8%
Cash-on-Cash Return
7.3%
Cap rate
0.9%
Rent to Value Ratio

Active
$155,000
2
bds
|
1
ba
|
792
sqft
|
built
1954
8047 E 48th St, Indianapolis, IN 46226
$310
Cash flow
10.4%
Cash-on-Cash Return
8.5%
Cap rate
1.0%
Rent to Value Ratio
Active
$105,000
2
bds
|
2
ba
|
1,078
sqft
|
built
1974
6814 Summer Time Dr, Indianapolis, IN 46226
$264
Cash flow
13.1%
Cash-on-Cash Return
9.2%
Cap rate
1.5%
Rent to Value Ratio
Active
$190,000
3
bds
|
2
ba
|
1,116
sqft
|
built
1958
4214 N Edmondson Ave, Indianapolis, IN 46226
$-7
Cash flow
-0.2%
Cash-on-Cash Return
6.1%
Cap rate
0.7%
Rent to Value Ratio
Active
$159,900
3
bds
|
2
ba
|
936
sqft
|
built
1955
4944 N Katherine Dr, Indianapolis, IN 46226
$78
Cash flow
2.5%
Cash-on-Cash Return
6.7%
Cap rate
0.8%
Rent to Value Ratio
Active
$239,900
4
bds
|
2
ba
|
1,520
sqft
|
built
1959
4126 Flamingo West Dr, Indianapolis, IN 46226
$-263
Cash flow
-5.7%
Cash-on-Cash Return
4.8%
Cap rate
0.6%
Rent to Value Ratio