46227 Investment Properties for Sale
Browse homes for sale and investment properties in 46227. Refine your search by price, property type, or more.
Best cash flowing properties in 46227
Active
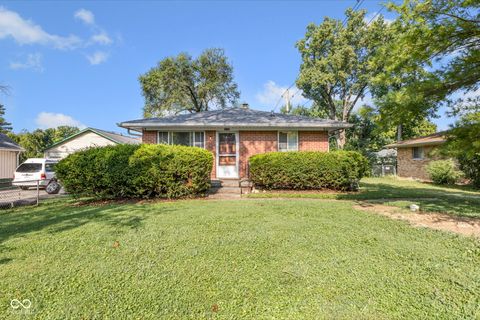
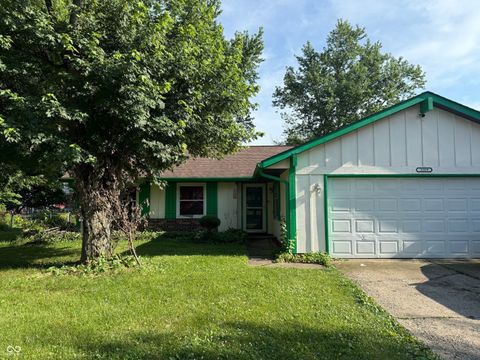
$160,000
3
bds
|
2
ba
|
999
sqft
|
built
1960
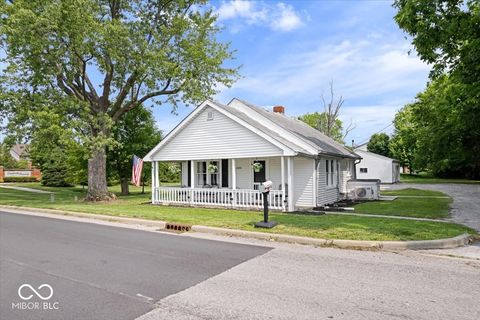
4108 S State Ave, Indianapolis, IN 46227
$284
Cash flow
9.3%
Cash-on-Cash Return
8.3%
Cap rate
1.0%
Rent to Value Ratio
Active
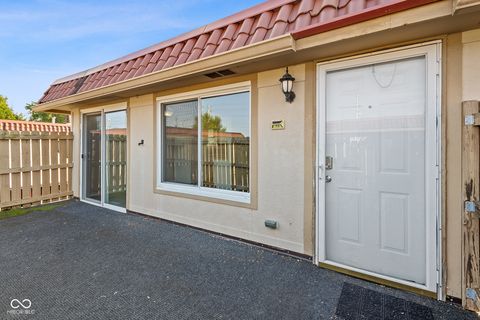
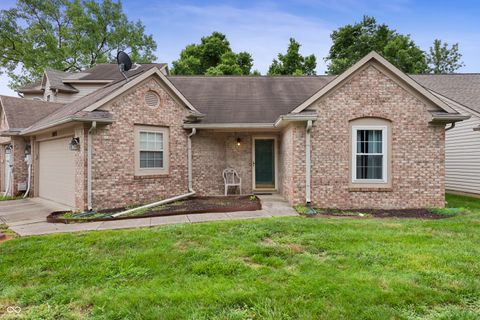
$89,900
2
bds
|
1
ba
|
968
sqft
|
built
1973
2808 Del Prado Dr, Indianapolis, IN 46227
$250
Cash flow
14.5%
Cash-on-Cash Return
9.5%
Cap rate
1.4%
Rent to Value Ratio
57 out of 63 properties for sale in 46227
Limited Results Shown
Create a free account, or log in to reveal all property listings and enjoy the complete experience.
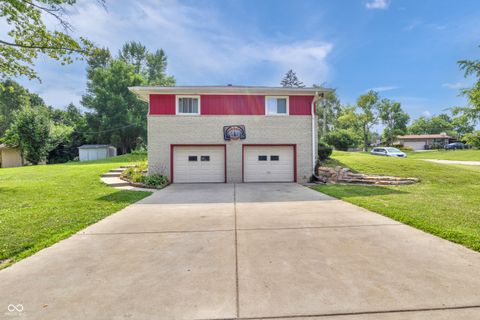
Active
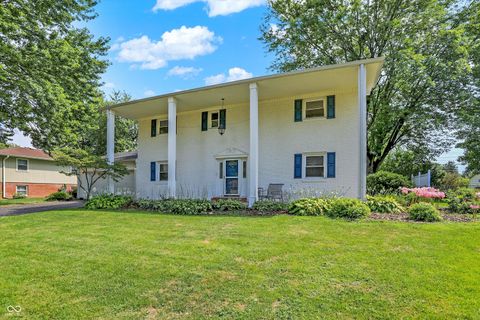
$355,000
4
bds
|
4
ba
|
3,320
sqft
|
built
1965
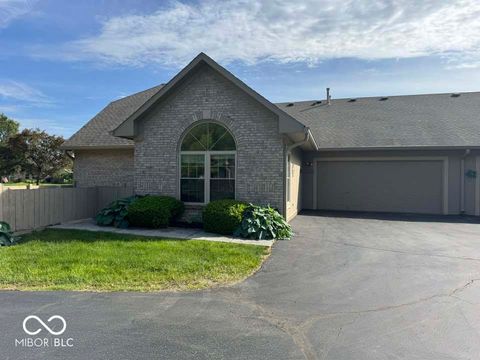
227 Narcissus Dr, Indianapolis, IN 46227
$-231
Cash flow
-3.4%
Cash-on-Cash Return
5.4%
Cap rate
0.6%
Rent to Value Ratio
Active
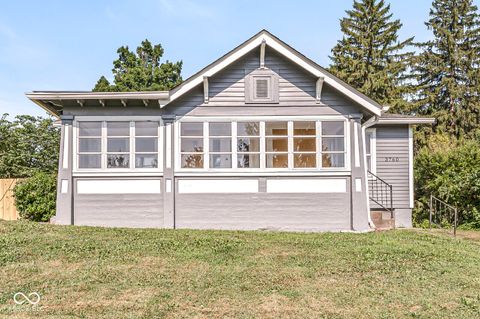
$259,900
3
bds
|
2
ba
|
1,564
sqft
|
built
1916
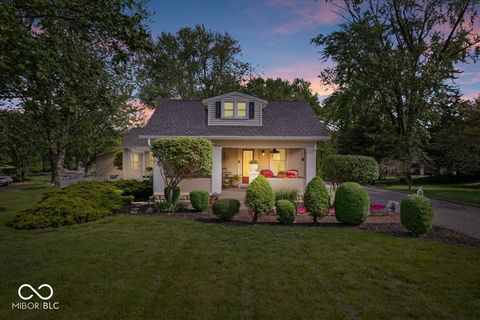
3760 Brill Rd, Indianapolis, IN 46227
$-158
Cash flow
-3.2%
Cash-on-Cash Return
5.4%
Cap rate
0.7%
Rent to Value Ratio
Active
$222,500
2
bds
|
1
ba
|
680
sqft
|
built
1939
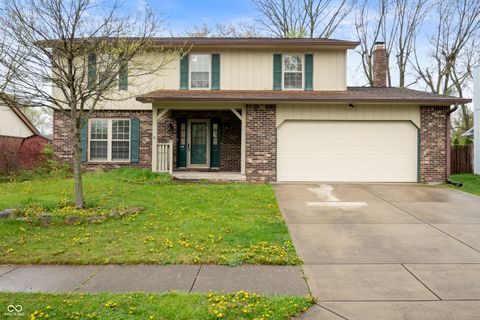
606 E County Line Rd, Indianapolis, IN 46227
$-450
Cash flow
-10.6%
Cash-on-Cash Return
3.7%
Cap rate
0.4%
Rent to Value Ratio
Active
$220,000
2
bds
|
3
ba
|
1,558
sqft
|
built
1997
7548 Briarstone Dr, Indianapolis, IN 46227
$-125
Cash flow
-3.0%
Cash-on-Cash Return
5.5%
Cap rate
0.8%
Rent to Value Ratio
Active
$399,900
3
bds
|
1
ba
|
1,535
sqft
|
built
1933
744 Gilbert Ave, Indianapolis, IN 46227
$-806
Cash flow
-10.5%
Cash-on-Cash Return
3.7%
Cap rate
0.5%
Rent to Value Ratio
Active
$325,000
4
bds
|
3
ba
|
2,622
sqft
|
built
1983
8306 Corkwood Dr, Indianapolis, IN 46227
$-147
Cash flow
-2.4%
Cash-on-Cash Return
5.6%
Cap rate
0.7%
Rent to Value Ratio
Active
$299,500
4
bds
|
3
ba
|
1,829
sqft
|
built
1966
1202 E Stop 10 Rd, Indianapolis, IN 46227
$-154
Cash flow
-2.7%
Cash-on-Cash Return
5.5%
Cap rate
0.7%
Rent to Value Ratio
Active
$180,000
2
bds
|
1
ba
|
842
sqft
|
built
1940
3916 S New Jersey St, Indianapolis, IN 46227
$44
Cash flow
1.3%
Cash-on-Cash Return
6.4%
Cap rate
0.8%
Rent to Value Ratio
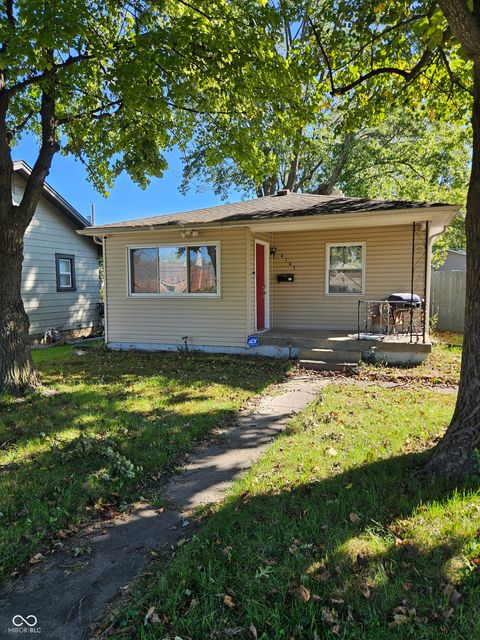
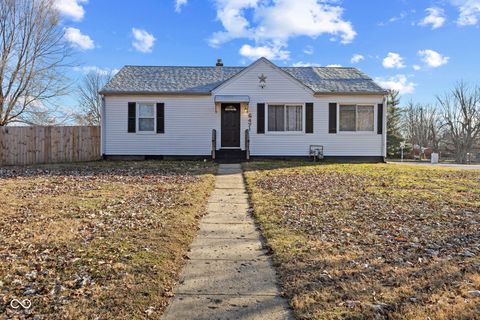
Active
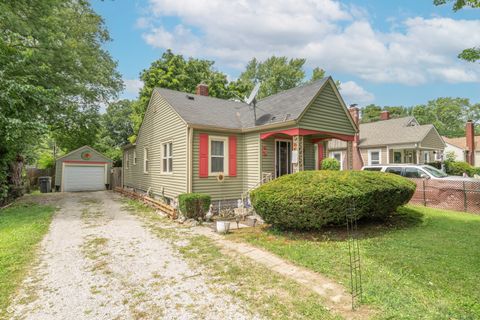
$159,900
4
bds
|
1
ba
|
1,200
sqft
|
built
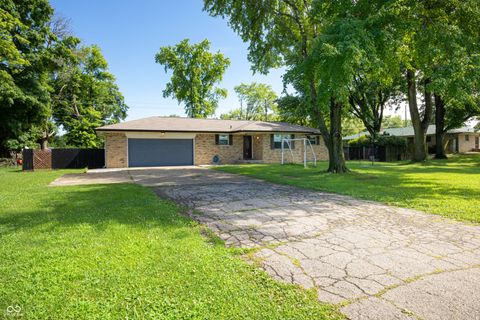
1971
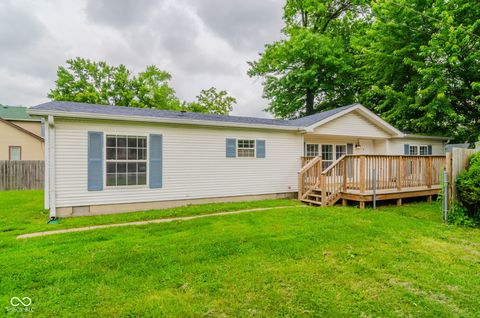
3704 S State Ave, Indianapolis, IN 46227
$216
Cash flow
7.0%
Cash-on-Cash Return
7.8%
Cap rate
0.9%
Rent to Value Ratio
Active
$140,000
2
bds
|
1
ba
|
612
sqft
|
built
1921
4201 Bowman Ave, Indianapolis, IN 46227
$-96
Cash flow
-3.6%
Cash-on-Cash Return
5.3%
Cap rate
0.6%
Rent to Value Ratio

Active
$250,000
3
bds
|
2
ba
|
1,320
sqft
|
built
1959
5902 S Gale St, Indianapolis, IN 46227
$-108
Cash flow
-2.3%
Cash-on-Cash Return
5.6%
Cap rate
0.7%
Rent to Value Ratio
Active
$310,000
4
bds
|
3
ba
|
2,449
sqft
|
built
1962
157 E Hill Valley Dr, Indianapolis, IN 46227
$-70
Cash flow
-1.2%
Cash-on-Cash Return
5.9%
Cap rate
0.7%
Rent to Value Ratio
Active
$314,900
3
bds
|
2
ba
|
2,306
sqft
|
built
1957
6332 Bryan Dr, Indianapolis, IN 46227
$-371
Cash flow
-6.1%
Cash-on-Cash Return
4.7%
Cap rate
0.6%
Rent to Value Ratio
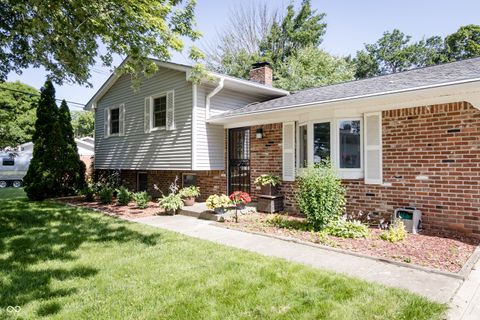
Active
$181,900
3
bds
|
1
ba
|
1,084
sqft
|
built
1962
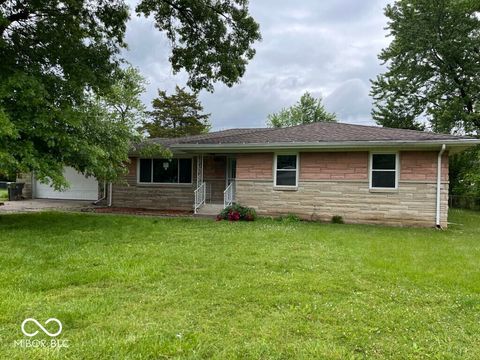
4107 Weaver Ave, Indianapolis, IN 46227
$103
Cash flow
3.0%
Cash-on-Cash Return
6.8%
Cap rate
0.8%
Rent to Value Ratio
Active
$295,000
4
bds
|
3
ba
|
2,070
sqft
|
built
1959
7725 S Oak Dr, Indianapolis, IN 46227
$-269
Cash flow
-4.8%
Cash-on-Cash Return
5.1%
Cap rate
0.6%
Rent to Value Ratio
Active
$198,000
3
bds
|
2
ba
|
1,586
sqft
|
built
1999
3149 Carson Ave, Indianapolis, IN 46227
$0
Cash flow
n/a
Cash-on-Cash Return
n/a
Cap rate
n/a
Rent to Value Ratio
Active
$224,900
3
bds
|
2
ba
|
1,776
sqft
|
built
1958
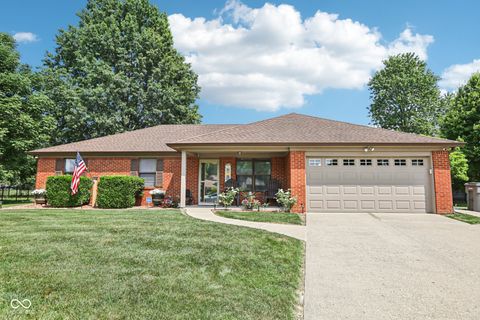
8045 Briarwood Dr, Indianapolis, IN 46227
$90
Cash flow
2.1%
Cash-on-Cash Return
6.6%
Cap rate
0.8%
Rent to Value Ratio
Active
$299,000
3
bds
|
2
ba
|
1,641
sqft
|
built
1988
3625 Wild Ivy Ct, Indianapolis, IN 46227
$-290
Cash flow
-5.1%
Cash-on-Cash Return
5.0%
Cap rate
0.6%
Rent to Value Ratio
Active
$160,000
2
bds
|
1
ba
|
1,167
sqft
|
built
1940
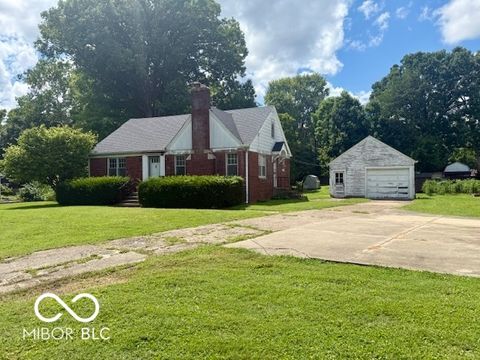
5606 Shelby St, Indianapolis, IN 46227
$215
Cash flow
7.0%
Cash-on-Cash Return
7.8%
Cap rate
0.9%
Rent to Value Ratio
Active
$559,900
4
bds
|
3
ba
|
3,541
sqft
|
built
1990
6520 Forrest Commons Blvd, Indianapolis, IN 46227
$-503
Cash flow
-4.7%
Cash-on-Cash Return
5.1%
Cap rate
0.6%
Rent to Value Ratio
Active
$229,500
4
bds
|
2
ba
|
1,788
sqft
|
built
1976
7402 Broadview Dr, Indianapolis, IN 46227
$66
Cash flow
1.5%
Cash-on-Cash Return
6.5%
Cap rate
0.8%
Rent to Value Ratio
Active
$210,000
3
bds
|
2
ba
|
1,164
sqft
|
built
1985
3635 Pleasant Creek Dr, Indianapolis, IN 46227
$28
Cash flow
0.7%
Cash-on-Cash Return
6.3%
Cap rate
0.8%
Rent to Value Ratio
Active
$330,000
3
bds
|
2
ba
|
1,805
sqft
|
built
2005
120 Golden Tree Ln, Indianapolis, IN 46227
$-334
Cash flow
-5.3%
Cash-on-Cash Return
4.9%
Cap rate
0.6%
Rent to Value Ratio
Active
$223,000
3
bds
|
2
ba
|
1,052
sqft
|
built
1981
3309 Wedgewood Dr, Indianapolis, IN 46227
$-38
Cash flow
-0.9%
Cash-on-Cash Return
5.9%
Cap rate
0.7%
Rent to Value Ratio
Active
$199,900
3
bds
|
2
ba
|
1,379
sqft
|
built
1995
1005 Buffalo Run Way, Indianapolis, IN 46227
$-446
Cash flow
-11.6%
Cash-on-Cash Return
3.5%
Cap rate
0.6%
Rent to Value Ratio
Active
$259,900
4
bds
|
1
ba
|
2,121
sqft
|
built
1948
6471 Homestead Dr, Indianapolis, IN 46227
$-227
Cash flow
-4.6%
Cash-on-Cash Return
5.1%
Cap rate
0.6%
Rent to Value Ratio
Active
$315,000
4
bds
|
3
ba
|
2,586
sqft
|
built
1966
218 Narcissus Dr, Indianapolis, IN 46227
$-234
Cash flow
-3.9%
Cash-on-Cash Return
5.3%
Cap rate
0.6%
Rent to Value Ratio
Active
$275,000
3
bds
|
2
ba
|
1,538
sqft
|
built
1928
1532 E Markwood Ave, Indianapolis, IN 46227
$-443
Cash flow
-8.4%
Cash-on-Cash Return
4.2%
Cap rate
0.5%
Rent to Value Ratio
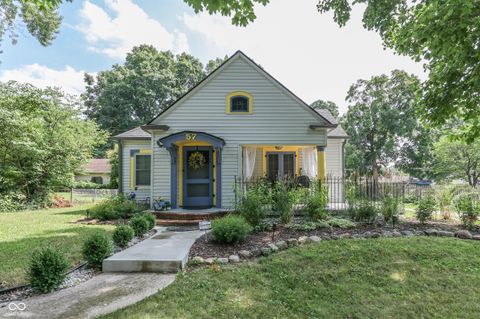
Active
$275,000
3
bds
|
2
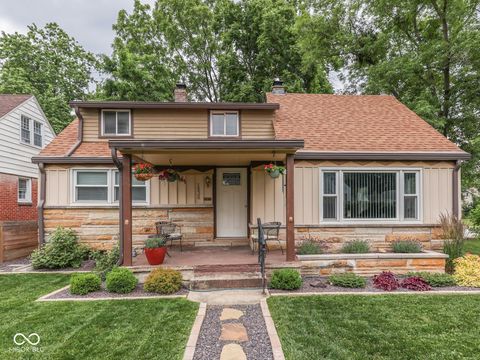
ba
|
1,567
sqft
|
built
1920
57 Worman St, Indianapolis, IN 46227
$-167
Cash flow
-3.2%
Cash-on-Cash Return
5.4%
Cap rate
0.7%
Rent to Value Ratio
Active
$299,900
4
bds
|
2
ba
|
2,250
sqft
|
built
2000
5043 Harway Ct, Indianapolis, IN 46227
$-18
Cash flow
-0.3%
Cash-on-Cash Return
6.1%
Cap rate
0.7%
Rent to Value Ratio

Active
$229,000
2
bds
|
2
ba
|
1,059
sqft
|
built
1920
800 E Markwood Ave, Indianapolis, IN 46227
$-69
Cash flow
-1.6%
Cash-on-Cash Return
5.8%
Cap rate
0.7%
Rent to Value Ratio

Active
$325,000
4
bds
|
3
ba
|
2,652
sqft
|
built
1962
8415 S Delaware St, Indianapolis, IN 46227
$-285
Cash flow
-4.6%
Cash-on-Cash Return
5.1%
Cap rate
0.6%
Rent to Value Ratio

Active
$345,000
4
bds
|
3
ba
|
2,259
sqft
|
built
1983
8413 Slippery Elm Ct, Indianapolis, IN 46227
$-249
Cash flow
-3.8%
Cash-on-Cash Return
5.3%
Cap rate
0.6%
Rent to Value Ratio
Active
$265,000
3
bds
|
2
ba
|
1,522
sqft
|
built
1956
801 Stover Ave, Indianapolis, IN 46227
$-115
Cash flow
-2.3%
Cash-on-Cash Return
5.6%
Cap rate
0.7%
Rent to Value Ratio
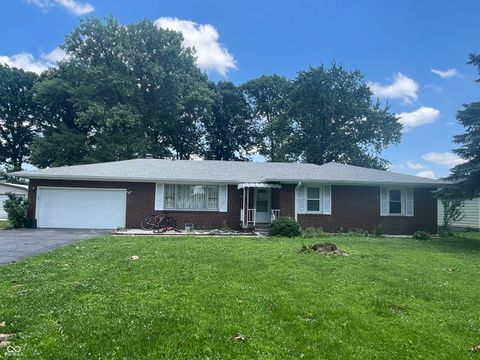
Active
$206,000
3
bds
|
2
ba
|
1,980
sqft
|
built
1965
667 E Edgewood Ave, Indianapolis, IN 46227
$49
Cash flow
1.2%
Cash-on-Cash Return
6.4%
Cap rate
0.8%
Rent to Value Ratio

Active
$255,000
3
bds
|
2
ba
|
2,304
sqft
|
built
1967
3414 Ferncliff Ave, Indianapolis, IN 46227
$-202
Cash flow
-4.1%
Cash-on-Cash Return
5.2%
Cap rate
0.6%
Rent to Value Ratio

Active
$315,000
4
bds
|
3
ba
|
3,082
sqft
|
built
1986
2747 E Midland Rd, Indianapolis, IN 46227
$-96
Cash flow
-1.6%
Cash-on-Cash Return
5.8%
Cap rate
0.7%
Rent to Value Ratio

Active
$274,500
3
bds
|
3
ba
|
1,904
sqft
|
built
1999
8408 Dahlgren Ln, Indianapolis, IN 46227
$-48
Cash flow
-0.9%
Cash-on-Cash Return
5.9%
Cap rate
0.7%
Rent to Value Ratio