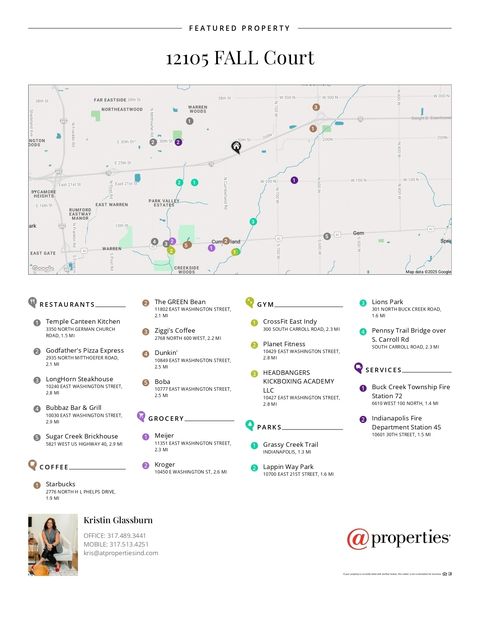
46229 Investment Properties for Sale
Browse homes for sale and investment properties in 46229. Refine your search by price, property type, or more.
Best cash flowing properties in 46229
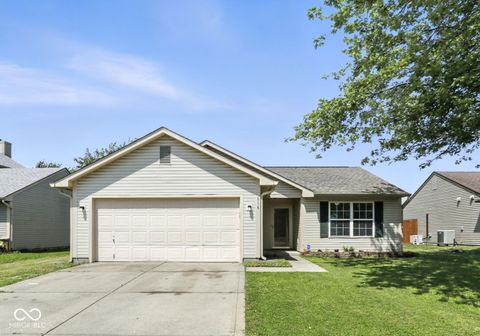
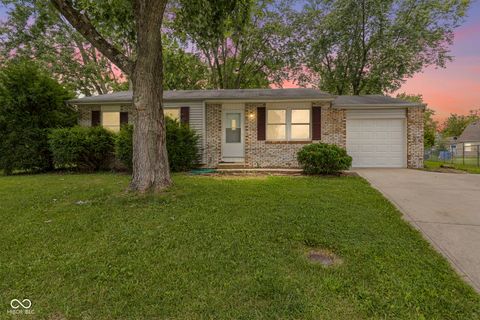
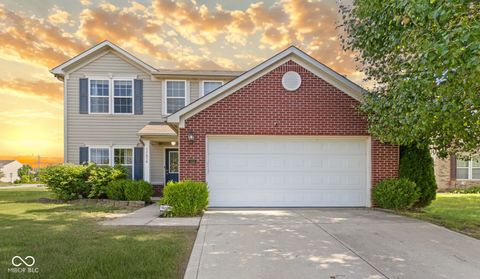
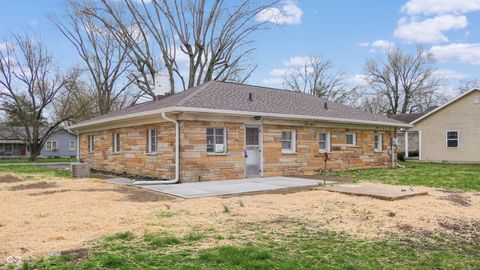
Active
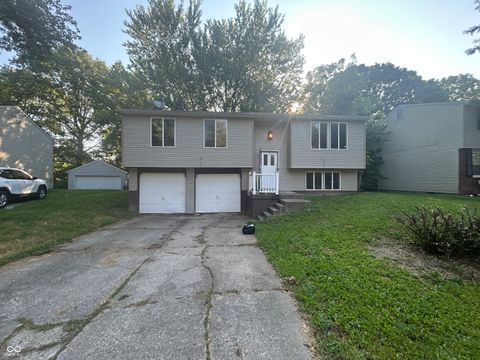
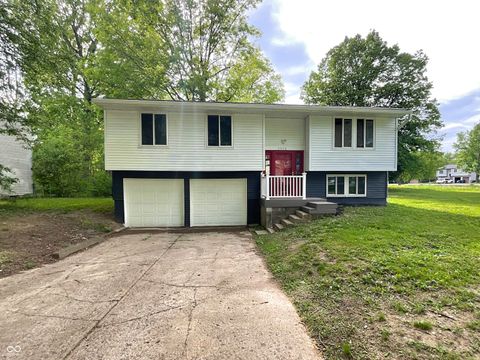
$165,000
4
bds
|
2
ba
|
1,988
sqft
|
built
1973
2815 Rouark Cir, Indianapolis, IN 46229
$397
Cash flow
12.6%
Cash-on-Cash Return
9.0%
Cap rate
1.1%
Rent to Value Ratio
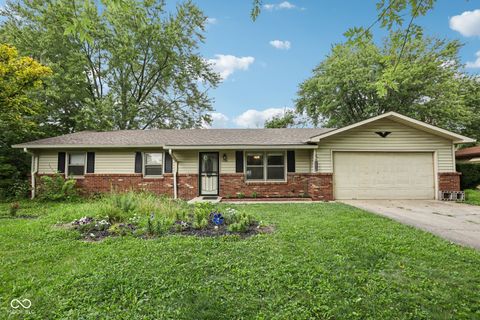
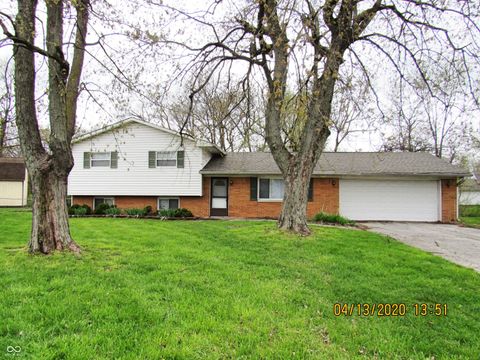
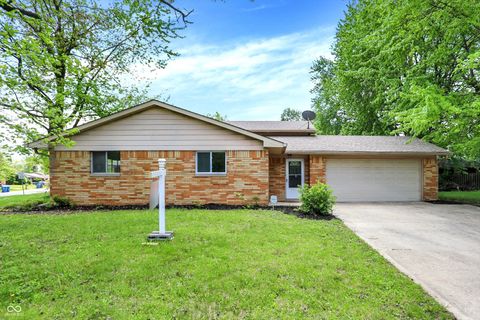
Active
$145,000
3
bds
|
2
ba
|
1,334
sqft
|
built
1968
9242 Granville Ln, Indianapolis, IN 46229
$361
Cash flow
13.0%
Cash-on-Cash Return
9.1%
Cap rate
1.1%
Rent to Value Ratio
39 out of 40 properties for sale in 46229
Limited Results Shown
Create a free account, or log in to reveal all property listings and enjoy the complete experience.
Active
$100,000
2
bds
|
2
ba
|
1,012
sqft
|
built
1973
10064 Penrith Dr, Indianapolis, IN 46229
$136
Cash flow
7.1%
Cash-on-Cash Return
7.8%
Cap rate
1.2%
Rent to Value Ratio
Active
$210,000
2
bds
|
3
ba
|
1,789
sqft
|
built
1994
11632 Coastal Way, Indianapolis, IN 46229
$8
Cash flow
0.2%
Cash-on-Cash Return
6.2%
Cap rate
0.9%
Rent to Value Ratio
Active
$310,000
4
bds
|
2
ba
|
2,278
sqft
|
built
2021
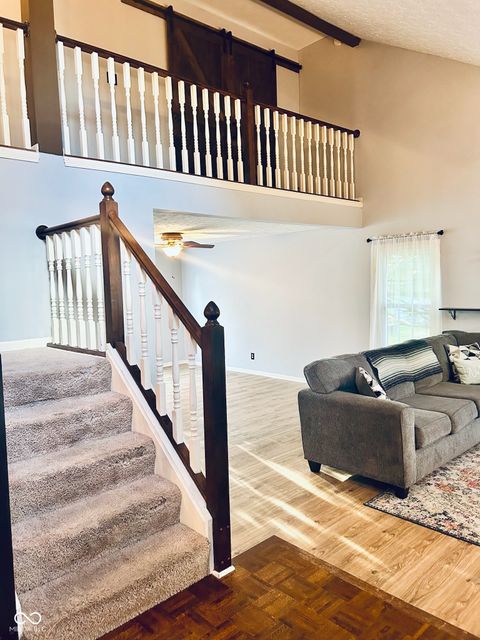
12105 Fall Ct, Indianapolis, IN 46229
$-241
Cash flow
-4.1%
Cash-on-Cash Return
5.2%
Cap rate
0.6%
Rent to Value Ratio

Active
$237,000
3
bds
|
2
ba
|
1,230
sqft
|
built
2012
2138 Rossington Ln, Indianapolis, IN 46229
$28
Cash flow
0.6%
Cash-on-Cash Return
6.3%
Cap rate
0.8%
Rent to Value Ratio
Active
$319,000
4
bds
|
3
ba
|
2,249
sqft
|
built
1989
12449 Huntington Dr, Indianapolis, IN 46229
$-49
Cash flow
-0.8%
Cash-on-Cash Return
6.0%
Cap rate
0.7%
Rent to Value Ratio
Active
$170,000
2
bds
|
2
ba
|
1,504
sqft
|
built
1996
11541 Coastal Dr, Indianapolis, IN 46229
$100
Cash flow
3.1%
Cash-on-Cash Return
6.9%
Cap rate
0.9%
Rent to Value Ratio
Active
$265,000
3
bds
|
3
ba
|
1,857
sqft
|
built
1980
11733 E 21st St, Indianapolis, IN 46229
$23
Cash flow
0.5%
Cash-on-Cash Return
6.2%
Cap rate
0.8%
Rent to Value Ratio
Active
$220,000
3
bds
|
2
ba
|
1,038
sqft
|
built
1995
914 Washington Cove Ln, Indianapolis, IN 46229
$-23
Cash flow
-0.5%
Cash-on-Cash Return
6.0%
Cap rate
0.7%
Rent to Value Ratio
Active
$234,900
4
bds
|
2
ba
|
2,112
sqft
|
built
1962
1830 Fairhaven Dr, Indianapolis, IN 46229
$39
Cash flow
0.9%
Cash-on-Cash Return
6.3%
Cap rate
0.8%
Rent to Value Ratio
Active
$265,000
3
bds
|
2
ba
|
1,727
sqft
|
built
2006
9507 Woodsong Ln, Indianapolis, IN 46229
$-4
Cash flow
-0.1%
Cash-on-Cash Return
6.1%
Cap rate
0.8%
Rent to Value Ratio
Active
$195,000
3
bds
|
2
ba
|
1,450
sqft
|
built
1962
10324 E 21st Pl, Indianapolis, IN 46229
$243
Cash flow
6.5%
Cash-on-Cash Return
7.6%
Cap rate
0.9%
Rent to Value Ratio
Active
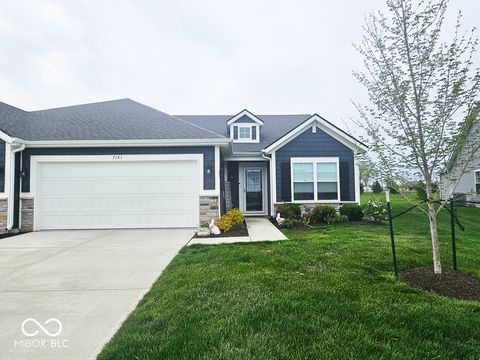
$284,900
2
bds
|
2
ba
|
1,522
sqft
|
built
2022
7141 Lillian Pl, Indianapolis, IN 46229
$-345
Cash flow
-6.3%
Cash-on-Cash Return
4.7%
Cap rate
0.7%
Rent to Value Ratio
Active
$217,000
4
bds
|
3
ba
|
1,656
sqft
|
built
1977
10321 Starview Dr, Indianapolis, IN 46229
$130
Cash flow
3.1%
Cash-on-Cash Return
6.9%
Cap rate
0.8%
Rent to Value Ratio
Active
$265,000
3
bds
|
3
ba
|
1,676
sqft
|
built
1997
2426 Borgman Ct, Indianapolis, IN 46229
$5
Cash flow
0.1%
Cash-on-Cash Return
6.2%
Cap rate
0.8%
Rent to Value Ratio
Active
$157,000
5
bds
|
1
ba
|
1,824
sqft
|
built
1961
9045 Stardust Dr, Indianapolis, IN 46229
$300
Cash flow
10.0%
Cash-on-Cash Return
8.4%
Cap rate
1.0%
Rent to Value Ratio
Active
$525,000
5
bds
|
3
ba
|
3,274
sqft
|
built
2022
210 Lynnette Way, Cumberland, IN 46229
$-640
Cash flow
-6.4%
Cash-on-Cash Return
4.7%
Cap rate
0.6%
Rent to Value Ratio
Active
$209,900
3
bds
|
2
ba
|
2,188
sqft
|
built
1978
10316 Woodhaven Cir, Indianapolis, IN 46229
$167
Cash flow
4.2%
Cash-on-Cash Return
7.1%
Cap rate
0.9%
Rent to Value Ratio
Active
$265,500
2
bds
|
2
ba
|
1,591
sqft
|
built
2021
173 Megan Way, Indianapolis, IN 46229
$-176
Cash flow
-3.5%
Cash-on-Cash Return
5.4%
Cap rate
0.8%
Rent to Value Ratio
Active
$319,999
4
bds
|
3
ba
|
2,333
sqft
|
built
1999
12117 E Harvest Glen Dr, Indianapolis, IN 46229
$-131
Cash flow
-2.1%
Cash-on-Cash Return
5.7%
Cap rate
0.7%
Rent to Value Ratio
Active
$359,900
5
bds
|
3
ba
|
2,510
sqft
|
built
2022
10125 Caprock Canyon Dr, Indianapolis, IN 46229
$-148
Cash flow
-2.1%
Cash-on-Cash Return
5.7%
Cap rate
0.7%
Rent to Value Ratio
Active
$184,000
3
bds
|
1
ba
|
1,164
sqft
|
built
1956
115 Hugo St, Indianapolis, IN 46229
$161
Cash flow
4.6%
Cash-on-Cash Return
7.2%
Cap rate
0.9%
Rent to Value Ratio
Active
$391,900
4
bds
|
3
ba
|
2,728
sqft
|
built
2022
192 Lynnette Way, Indianapolis, IN 46229
$-116
Cash flow
-1.5%
Cash-on-Cash Return
5.8%
Cap rate
0.7%
Rent to Value Ratio
Active
$270,000
3
bds
|
2
ba
|
1,820
sqft
|
built
2005
2631 Braxton Dr, Indianapolis, IN 46229
$110
Cash flow
2.1%
Cash-on-Cash Return
6.6%
Cap rate
0.8%
Rent to Value Ratio
Active
$190,000
3
bds
|
1
ba
|
946
sqft
|
built
1970
10201 Baribeau Ct, Indianapolis, IN 46229
$-76
Cash flow
-2.1%
Cash-on-Cash Return
5.7%
Cap rate
0.7%
Rent to Value Ratio
Active
$216,000
4
bds
|
2
ba
|
1,863
sqft
|
built
1962
2414 Constellation Dr, Indianapolis, IN 46229
$136
Cash flow
3.3%
Cash-on-Cash Return
6.9%
Cap rate
0.8%
Rent to Value Ratio
Active
$280,000
2
bds
|
2
ba
|
1,615
sqft
|
built
2022
7181 Lillian Pl, Indianapolis, IN 46229
$-251
Cash flow
-4.7%
Cash-on-Cash Return
5.1%
Cap rate
0.7%
Rent to Value Ratio
Active
$219,900
3
bds
|
2
ba
|
1,776
sqft
|
built
1910
221 N Munsie St, Indianapolis, IN 46229
$116
Cash flow
2.8%
Cash-on-Cash Return
6.8%
Cap rate
0.8%
Rent to Value Ratio
Active
$269,900
3
bds
|
3
ba
|
2,111
sqft
|
built
2006
11614 Gosling Dr, Indianapolis, IN 46229
$-93
Cash flow
-1.8%
Cash-on-Cash Return
5.7%
Cap rate
0.7%
Rent to Value Ratio
Active
$194,900
4
bds
|
2
ba
|
1,828
sqft
|
built
1966
2732 Morning Star Dr, Indianapolis, IN 46229
$244
Cash flow
6.5%
Cash-on-Cash Return
7.6%
Cap rate
0.9%
Rent to Value Ratio
Active
$174,999
5
bds
|
2
ba
|
1,588
sqft
|
built
1971
1809 Mutz Dr, Indianapolis, IN 46229
$208
Cash flow
6.2%
Cash-on-Cash Return
7.6%
Cap rate
0.9%
Rent to Value Ratio
Active
$95,000
2
bds
|
2
ba
|
905
sqft
|
built
1977
10057 Dedham Dr, Indianapolis, IN 46229
$92
Cash flow
5.1%
Cash-on-Cash Return
7.3%
Cap rate
1.2%
Rent to Value Ratio
Active
$179,900
2
bds
|
1
ba
|
1,158
sqft
|
built
1958
220 Monroe St, Indianapolis, IN 46229
$-163
Cash flow
-4.7%
Cash-on-Cash Return
5.1%
Cap rate
0.6%
Rent to Value Ratio
Active
$350,000
4
bds
|
3
ba
|
2,826
sqft
|
built
2021
2928 Pointe Bay Rd, Indianapolis, IN 46229
$-446
Cash flow
-6.6%
Cash-on-Cash Return
4.6%
Cap rate
0.6%
Rent to Value Ratio
Active
$265,000
3
bds
|
2
ba
|
1,367
sqft
|
built
1993
1528 Wilford Ln, Indianapolis, IN 46229
$-198
Cash flow
-3.9%
Cash-on-Cash Return
5.2%
Cap rate
0.6%
Rent to Value Ratio
Active
$235,000
3
bds
|
2
ba
|
1,692
sqft
|
built
1972
11320 Mc Dowell Dr, Indianapolis, IN 46229
$38
Cash flow
0.8%
Cash-on-Cash Return
6.3%
Cap rate
0.8%
Rent to Value Ratio
Active
$209,000
3
bds
|
2
ba
|
1,541
sqft
|
built
1972
2928 Sheffield Dr, Indianapolis, IN 46229
$171
Cash flow
4.3%
Cash-on-Cash Return
7.1%
Cap rate
0.9%
Rent to Value Ratio
Active
$209,999
3
bds
|
2
ba
|
2,152
sqft
|
built
1964
9157 Neptune Dr, Indianapolis, IN 46229
$304
Cash flow
7.6%
Cash-on-Cash Return
7.9%
Cap rate
1.0%
Rent to Value Ratio