46237 Investment Properties for Sale
Browse homes for sale and investment properties in 46237. Refine your search by price, property type, or more.
Best cash flowing properties in 46237
Active
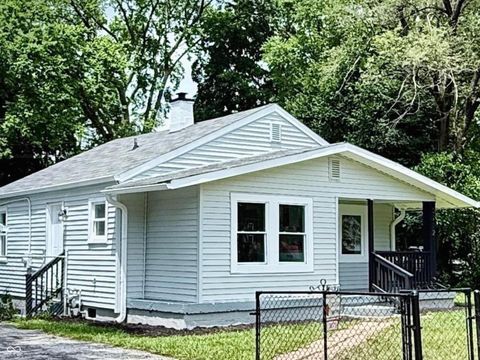
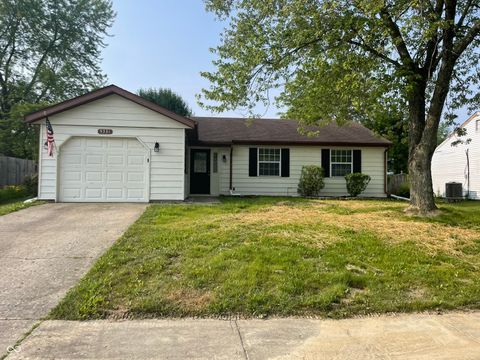
$95,000
1
bds
|
1
ba
|
700
sqft
|
built
1940
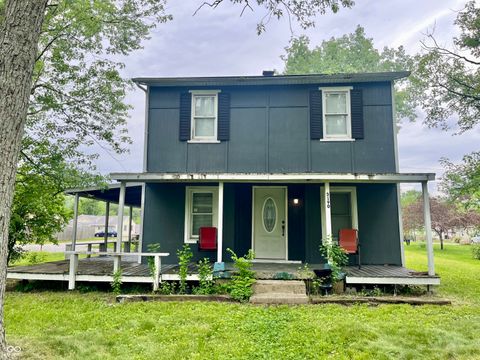
3104 Alice Ave, Indianapolis, IN 46237
$194
Cash flow
10.7%
Cash-on-Cash Return
8.7%
Cap rate
1.1%
Rent to Value Ratio
Active
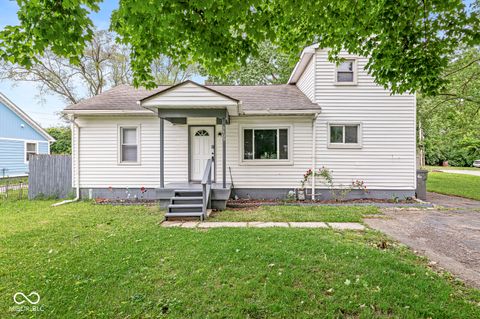
$155,000
2
bds
|
1
ba
|
1,488
sqft
|
built
1941
3190 S Tacoma Ave, Indianapolis, IN 46237
$172
Cash flow
5.8%
Cash-on-Cash Return
7.5%
Cap rate
0.9%
Rent to Value Ratio
85 out of 91 properties for sale in 46237
Limited Results Shown
Create a free account, or log in to reveal all property listings and enjoy the complete experience.

Active
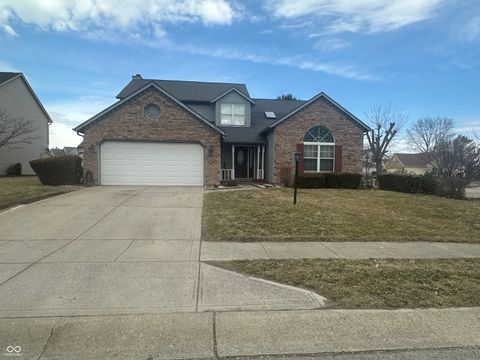
$319,900
2
bds
|
2
ba
|
1,810
sqft
|
built
2006
4134 Bella Ct, Indianapolis, IN 46237
$-344
Cash flow
-5.6%
Cash-on-Cash Return
5.0%
Cap rate
0.6%
Rent to Value Ratio

Active
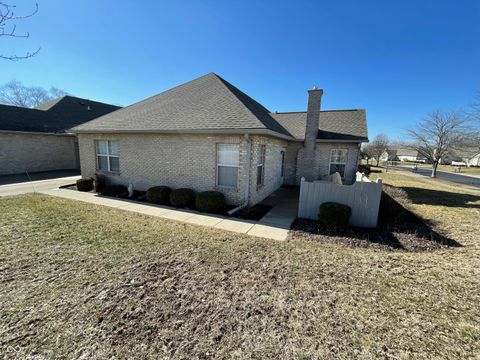
$359,999
4
bds
|
3
ba
|
2,961
sqft
|
built
2004
5522 Grassy Bank Dr, Indianapolis, IN 46237
$-385
Cash flow
-5.6%
Cash-on-Cash Return
5.0%
Cap rate
0.6%
Rent to Value Ratio

Active
$208,000
3
bds
|
2
ba
|
1,064
sqft
|
built
1982
5401 Padre Ln, Indianapolis, IN 46237
$87
Cash flow
2.2%
Cash-on-Cash Return
6.8%
Cap rate
0.8%
Rent to Value Ratio
Active
$318,900
4
bds
|
3
ba
|
2,336
sqft
|
built
1995
3916 Jekyll Ct, Indianapolis, IN 46237
$-161
Cash flow
-2.6%
Cash-on-Cash Return
5.7%
Cap rate
0.7%
Rent to Value Ratio

Active
$155,000
3
bds
|
2
ba
|
1,337
sqft
|
built
1974
4212 Foxglove Trce, Indianapolis, IN 46237
$-242
Cash flow
-8.1%
Cash-on-Cash Return
4.4%
Cap rate
0.9%
Rent to Value Ratio

Active
$657,000
5
bds
|
4
ba
|
5,118
sqft
|
built
1994
4601 Fairhope Dr, Indianapolis, IN 46237
$-959
Cash flow
-7.6%
Cash-on-Cash Return
4.5%
Cap rate
0.5%
Rent to Value Ratio
Active
$286,000
3
bds
|
3
ba
|
1,976
sqft
|
built
1964
8417 S Sherman Dr, Indianapolis, IN 46237
$-458
Cash flow
-8.4%
Cash-on-Cash Return
4.3%
Cap rate
0.5%
Rent to Value Ratio

Active
$162,500
2
bds
|
2
ba
|
1,080
sqft
|
built
1978
5713 Bradston Way, Indianapolis, IN 46237
$-155
Cash flow
-5.0%
Cash-on-Cash Return
5.1%
Cap rate
0.9%
Rent to Value Ratio
Active
$350,000
3
bds
|
3
ba
|
2,528
sqft
|
built
1991
4418 Tarragon Dr, Indianapolis, IN 46237
$-343
Cash flow
-5.1%
Cash-on-Cash Return
5.1%
Cap rate
0.6%
Rent to Value Ratio
Active
$183,000
2
bds
|
2
ba
|
1,195
sqft
|
built
1993
5850 Bradston Way, Indianapolis, IN 46237
$-141
Cash flow
-4.0%
Cash-on-Cash Return
5.3%
Cap rate
0.9%
Rent to Value Ratio

Active
$245,000
3
bds
|
2
ba
|
1,205
sqft
|
built
1989
8318 Rob Ln, Indianapolis, IN 46237
$-37
Cash flow
-0.8%
Cash-on-Cash Return
6.1%
Cap rate
0.7%
Rent to Value Ratio

Active
$355,000
4
bds
|
3
ba
|
1,848
sqft
|
built
1992
7383 Poppyseed Dr, Indianapolis, IN 46237
$-507
Cash flow
-7.5%
Cash-on-Cash Return
4.5%
Cap rate
0.6%
Rent to Value Ratio
Active
$195,000
3
bds
|
1
ba
|
1,400
sqft
|
built
1930
3712 S Kealing Ave, Indianapolis, IN 46237
$-33
Cash flow
-0.9%
Cash-on-Cash Return
5.9%
Cap rate
0.7%
Rent to Value Ratio
Active
$190,000
4
bds
|
2
ba
|
1,464
sqft
|
built
1951
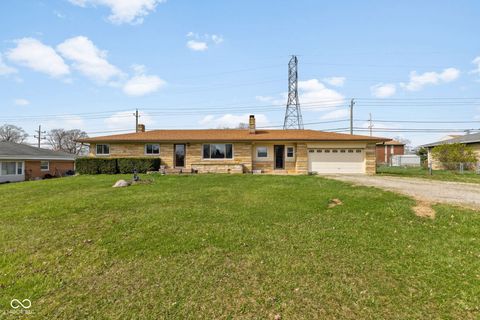
3409 S Rural St, Indianapolis, IN 46237
$112
Cash flow
3.1%
Cash-on-Cash Return
7.0%
Cap rate
0.8%
Rent to Value Ratio

Active
$289,990
3
bds
|
2
ba
|
1,764
sqft
|
built
1997
6264 Whitaker Farms Dr, Indianapolis, IN 46237
$-151
Cash flow
-2.7%
Cash-on-Cash Return
5.6%
Cap rate
0.7%
Rent to Value Ratio

Active
$177,000
2
bds
|
2
ba
|
1,375
sqft
|
built
2005
6231 Amber Creek Ln, Indianapolis, IN 46237
$-223
Cash flow
-6.6%
Cash-on-Cash Return
4.8%
Cap rate
0.8%
Rent to Value Ratio
Active
$360,000
3
bds
|
3
ba
|
2,660
sqft
|
built
1992
4549 Pepper Ct, Indianapolis, IN 46237
$-188
Cash flow
-2.7%
Cash-on-Cash Return
5.6%
Cap rate
0.7%
Rent to Value Ratio
Active
$230,000
3
bds
|
2
ba
|
1,176
sqft
|
built
1975
7922 S Sherman Dr, Indianapolis, IN 46237
$-28
Cash flow
-0.6%
Cash-on-Cash Return
6.1%
Cap rate
0.7%
Rent to Value Ratio

Active
$329,900
4
bds
|
3
ba
|
2,509
sqft
|
built
2013
8404 Alcona Dr, Indianapolis, IN 46237
$-240
Cash flow
-3.8%
Cash-on-Cash Return
5.4%
Cap rate
0.7%
Rent to Value Ratio
Active
$97,500
0
bds
|
0
ba
|
0
sqft
|
built
1960
3302 Alice Ave, Indianapolis, IN 46237
$122
Cash flow
6.5%
Cash-on-Cash Return
7.6%
Cap rate
0.9%
Rent to Value Ratio
Active
$279,900
3
bds
|
2
ba
|
1,434
sqft
|
built
2001
5642 Southern Mist Dr, Indianapolis, IN 46237
$-192
Cash flow
-3.6%
Cash-on-Cash Return
5.3%
Cap rate
0.6%
Rent to Value Ratio
Active
$295,000
3
bds
|
2
ba
|
1,770
sqft
|
built
2003
6816 Minnow Dr, Indianapolis, IN 46237
$-158
Cash flow
-2.8%
Cash-on-Cash Return
5.5%
Cap rate
0.7%
Rent to Value Ratio
Active
$155,000
2
bds
|
1
ba
|
1,488
sqft
|
built
1941
3190 S Tacoma Ave, Indianapolis, IN 46237
$172
Cash flow
5.8%
Cash-on-Cash Return
7.5%
Cap rate
0.9%
Rent to Value Ratio
Active
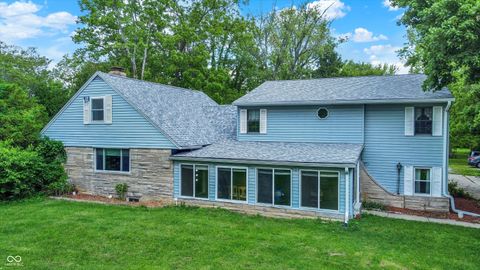
$379,900
3
bds
|
2
ba
|
2,778
sqft
|
built
1952
7104 Combs Rd, Indianapolis, IN 46237
$-51
Cash flow
-0.7%
Cash-on-Cash Return
6.1%
Cap rate
0.7%
Rent to Value Ratio
Active
$245,000
3
bds
|
2
ba
|
1,084
sqft
|
built
1999
2027 E Werges Ave, Indianapolis, IN 46237
$-313
Cash flow
-6.7%
Cash-on-Cash Return
4.7%
Cap rate
0.6%
Rent to Value Ratio
Active
$169,900
2
bds
|
2
ba
|
1,159
sqft
|
built
2005
5019 Amber Creek Pl, Indianapolis, IN 46237
$-115
Cash flow
-3.5%
Cash-on-Cash Return
5.3%
Cap rate
0.8%
Rent to Value Ratio
Active
$225,000
3
bds
|
2
ba
|
1,060
sqft
|
built
1981
5331 Yucatan Dr, Indianapolis, IN 46237
$-49
Cash flow
-1.1%
Cash-on-Cash Return
5.9%
Cap rate
0.7%
Rent to Value Ratio

Active
$250,000
3
bds
|
1
ba
|
1,040
sqft
|
built
1956
3510 Chamberlin Dr, Indianapolis, IN 46237
$-132
Cash flow
-2.8%
Cash-on-Cash Return
5.6%
Cap rate
0.7%
Rent to Value Ratio

Active
$375,000
4
bds
|
3
ba
|
2,980
sqft
|
built
2020
5303 Rum Cherry Way, Indianapolis, IN 46237
$-205
Cash flow
-2.9%
Cash-on-Cash Return
5.6%
Cap rate
0.7%
Rent to Value Ratio
Active
$600,000
6
bds
|
0
ba
|
0
sqft
|
built
1956
6430 E Southport Rd, Indianapolis, IN 46237
$-648
Cash flow
-5.6%
Cash-on-Cash Return
5.0%
Cap rate
0.6%
Rent to Value Ratio
Active
$258,000
3
bds
|
2
ba
|
2,358
sqft
|
built
1954
3638 Redfern Dr, Indianapolis, IN 46237
$-174
Cash flow
-3.5%
Cash-on-Cash Return
5.5%
Cap rate
0.7%
Rent to Value Ratio

Active
$400,000
3
bds
|
2
ba
|
2,057
sqft
|
built
1985
5431 Nathan Pl, Indianapolis, IN 46237
$-708
Cash flow
-9.2%
Cash-on-Cash Return
4.1%
Cap rate
0.5%
Rent to Value Ratio
Active
$318,900
4
bds
|
3
ba
|
1,980
sqft
|
built
2003
4620 Whitham Ln, Indianapolis, IN 46237
$-307
Cash flow
-5.0%
Cash-on-Cash Return
5.1%
Cap rate
0.6%
Rent to Value Ratio
Active
$95,000
1
bds
|
1
ba
|
700
sqft
|
built
1940
3104 Alice Ave, Indianapolis, IN 46237
$194
Cash flow
10.7%
Cash-on-Cash Return
8.7%
Cap rate
1.1%
Rent to Value Ratio

Active
$330,000
4
bds
|
3
ba
|
2,396
sqft
|
built
2003
5502 Floating Leaf Dr, Indianapolis, IN 46237
$-365
Cash flow
-5.8%
Cash-on-Cash Return
4.9%
Cap rate
0.6%
Rent to Value Ratio
Active
$175,000
2
bds
|
2
ba
|
1,174
sqft
|
built
2005
6516 Emerald Hill Ct, Indianapolis, IN 46237
$-35
Cash flow
-1.0%
Cash-on-Cash Return
6.0%
Cap rate
0.9%
Rent to Value Ratio
Active
$354,900
3
bds
|
3
ba
|
2,266
sqft
|
built
1992
4506 Tarragon Dr, Indianapolis, IN 46237
$-373
Cash flow
-5.5%
Cash-on-Cash Return
5.0%
Cap rate
0.6%
Rent to Value Ratio
Active
$428,000
3
bds
|
3
ba
|
2,303
sqft
|
built
2017
6117 Arctic Cir, Indianapolis, IN 46237
$-667
Cash flow
-8.1%
Cash-on-Cash Return
4.4%
Cap rate
0.5%
Rent to Value Ratio
Active
$273,500
3
bds
|
2
ba
|
1,410
sqft
|
built
1999
8234 Crosser Dr, Indianapolis, IN 46237
$-214
Cash flow
-4.1%
Cash-on-Cash Return
5.3%
Cap rate
0.7%
Rent to Value Ratio
Active
$298,900
2
bds
|
3
ba
|
2,441
sqft
|
built
2003
6146 Franklin Villas Way, Indianapolis, IN 46237
$-280
Cash flow
-4.9%
Cash-on-Cash Return
5.1%
Cap rate
0.7%
Rent to Value Ratio