46237 Investment Properties for Sale
Browse homes for sale and investment properties in 46237. Refine your search by price, property type, or more.
Best cash flowing properties in 46237
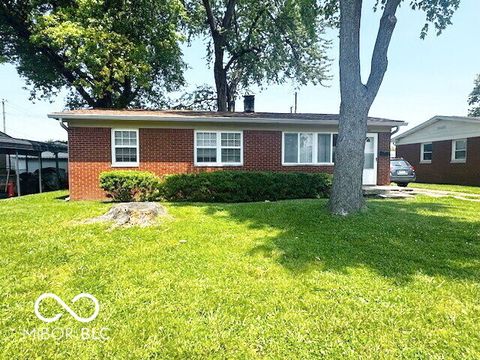
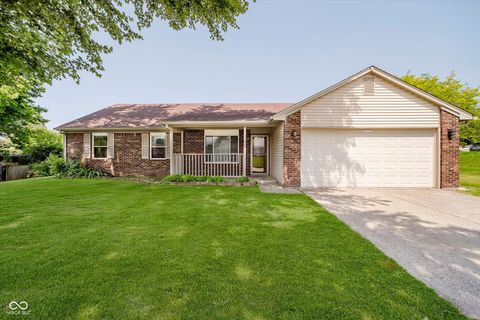
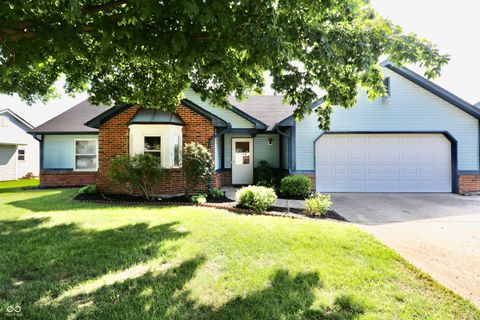
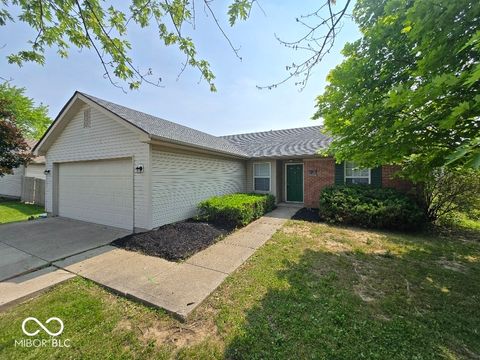
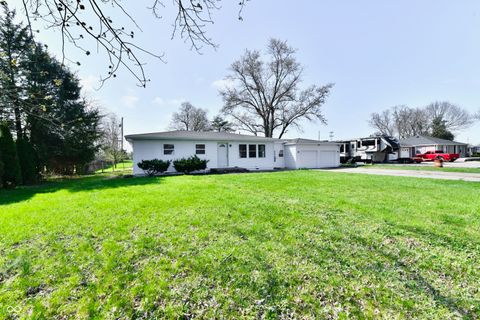
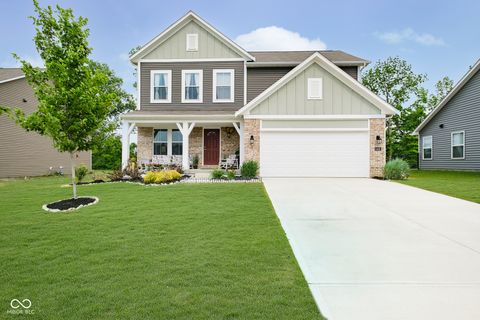
Active
$166,000
3
bds
|
1
ba
|
975
sqft
|
built
1959
1820 Martin St, Indianapolis, IN 46237
$99
Cash flow
3.1%
Cash-on-Cash Return
7.0%
Cap rate
0.8%
Rent to Value Ratio
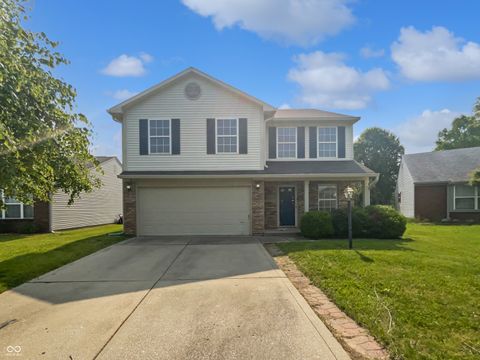
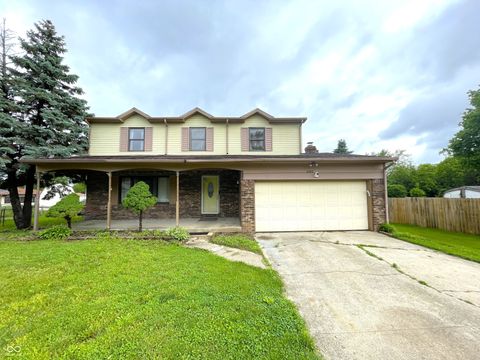
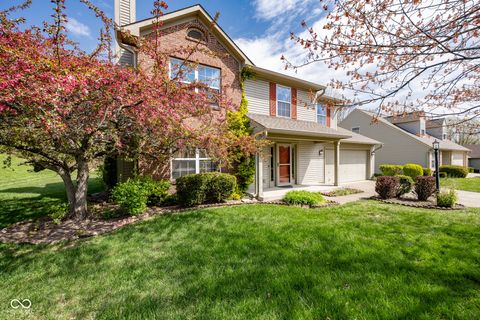
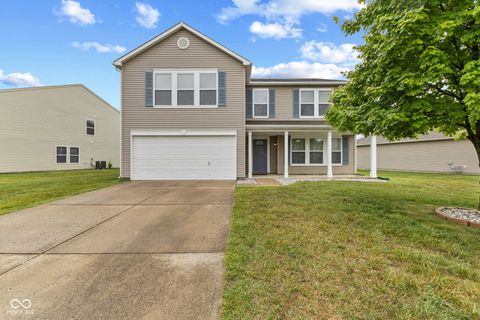
Active
$220,000
3
bds
|
1
ba
|
1,272
sqft
|
built
1972
2847 Merts Dr, Indianapolis, IN 46237
$93
Cash flow
2.2%
Cash-on-Cash Return
6.8%
Cap rate
0.8%
Rent to Value Ratio
85 out of 91 properties for sale in 46237
Limited Results Shown
Create a free account, or log in to reveal all property listings and enjoy the complete experience.
Active
$298,000
4
bds
|
3
ba
|
2,536
sqft
|
built
2004
8231 Golden Ridge Ln, Indianapolis, IN 46237
$-176
Cash flow
-3.1%
Cash-on-Cash Return
5.6%
Cap rate
0.7%
Rent to Value Ratio
Active
$329,900
4
bds
|
2
ba
|
2,396
sqft
|
built
2004
8415 Fieldfare Way, Indianapolis, IN 46237
$-240
Cash flow
-3.8%
Cash-on-Cash Return
5.4%
Cap rate
0.7%
Rent to Value Ratio
Active
$265,000
3
bds
|
2
ba
|
1,505
sqft
|
built
1988
7418 Southern Lakes Dr, Indianapolis, IN 46237
$-141
Cash flow
-2.8%
Cash-on-Cash Return
5.6%
Cap rate
0.7%
Rent to Value Ratio
Active
$300,000
4
bds
|
3
ba
|
1,964
sqft
|
built
1999
8437 Crosser Dr, Indianapolis, IN 46237
$-214
Cash flow
-3.7%
Cash-on-Cash Return
5.4%
Cap rate
0.7%
Rent to Value Ratio
Active
$329,000
4
bds
|
3
ba
|
1,905
sqft
|
built
1999
6634 Frankenberger Dr, Indianapolis, IN 46237
$-367
Cash flow
-5.8%
Cash-on-Cash Return
4.9%
Cap rate
0.6%
Rent to Value Ratio
Active
$269,900
3
bds
|
2
ba
|
1,566
sqft
|
built
1979
7607 Ardwell Ct, Indianapolis, IN 46237
$-167
Cash flow
-3.2%
Cash-on-Cash Return
5.5%
Cap rate
0.7%
Rent to Value Ratio
Active
$185,400
3
bds
|
2
ba
|
1,569
sqft
|
built
2004
6525 Emerald Hill Ct, Indianapolis, IN 46237
$-164
Cash flow
-4.6%
Cash-on-Cash Return
5.2%
Cap rate
0.9%
Rent to Value Ratio
Active
$264,000
2
bds
|
2
ba
|
1,708
sqft
|
built
2007
4835 Franklin Villas Dr, Indianapolis, IN 46237
$-98
Cash flow
-1.9%
Cash-on-Cash Return
5.8%
Cap rate
0.8%
Rent to Value Ratio
Active
$199,000
2
bds
|
1
ba
|
1,546
sqft
|
built
1948
3025 S Keystone Ave, Indianapolis, IN 46237
$-73
Cash flow
-1.9%
Cash-on-Cash Return
5.8%
Cap rate
0.7%
Rent to Value Ratio
Active
$195,900
2
bds
|
3
ba
|
1,576
sqft
|
built
2004
8160 Shores Edge Way, Indianapolis, IN 46237
$-92
Cash flow
-2.5%
Cash-on-Cash Return
5.7%
Cap rate
0.9%
Rent to Value Ratio
Active
$344,900
4
bds
|
3
ba
|
2,016
sqft
|
built
1997
6329 Whitaker Farms Dr, Indianapolis, IN 46237
$-404
Cash flow
-6.1%
Cash-on-Cash Return
4.7%
Cap rate
0.6%
Rent to Value Ratio
Active
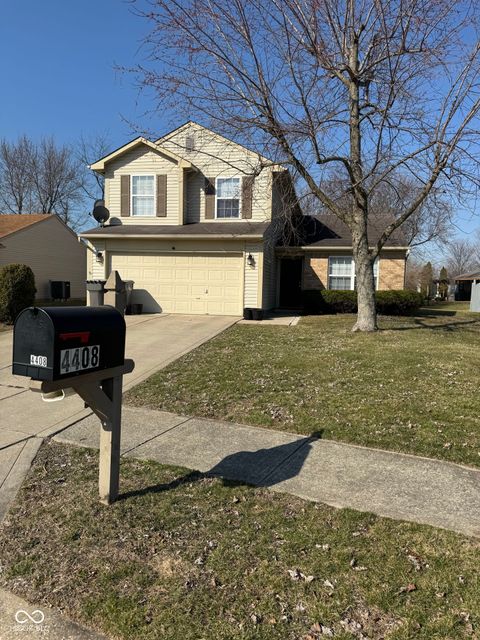
$215,000
3
bds
|
3
ba
|
1,540
sqft
|
built
1998
4408 Vestry Pl, Indianapolis, IN 46237
$52
Cash flow
1.3%
Cash-on-Cash Return
6.4%
Cap rate
0.8%
Rent to Value Ratio
Active
$224,900
3
bds
|
1
ba
|
1,373
sqft
|
built
1953
3921 S Lasalle St, Indianapolis, IN 46237
$-48
Cash flow
-1.1%
Cash-on-Cash Return
5.9%
Cap rate
0.7%
Rent to Value Ratio

Active
$369,900
4
bds
|
3
ba
|
2,581
sqft
|
built
2005
6625 Wolverine Way, Indianapolis, IN 46237
$-374
Cash flow
-5.3%
Cash-on-Cash Return
5.1%
Cap rate
0.6%
Rent to Value Ratio

Active
$260,000
2
bds
|
0
ba
|
960
sqft
|
built
1950
5159 E Edgewood Ave, Indianapolis, IN 46237
$-253
Cash flow
-5.1%
Cash-on-Cash Return
5.1%
Cap rate
0.6%
Rent to Value Ratio

Active
$173,000
2
bds
|
2
ba
|
1,124
sqft
|
built
2003
4925 Opal Ridge Ln, Indianapolis, IN 46237
$-174
Cash flow
-5.2%
Cash-on-Cash Return
5.1%
Cap rate
0.8%
Rent to Value Ratio
Active
$310,000
3
bds
|
3
ba
|
2,463
sqft
|
built
2004
5646 Skipping Stone Dr, Indianapolis, IN 46237
$-260
Cash flow
-4.4%
Cash-on-Cash Return
5.3%
Cap rate
0.6%
Rent to Value Ratio
Active
$275,000
3
bds
|
2
ba
|
1,652
sqft
|
built
1990
7567 Muirfield Pl, Indianapolis, IN 46237
$-167
Cash flow
-3.2%
Cash-on-Cash Return
5.4%
Cap rate
0.7%
Rent to Value Ratio
Active
$199,900
3
bds
|
2
ba
|
1,569
sqft
|
built
2004
6526 Jade Stream Ct, Indianapolis, IN 46237
$-166
Cash flow
-4.3%
Cash-on-Cash Return
5.3%
Cap rate
0.9%
Rent to Value Ratio
Active
$289,900
3
bds
|
2
ba
|
2,003
sqft
|
built
2000
3959 Towhees Dr, Indianapolis, IN 46237
$-170
Cash flow
-3.1%
Cash-on-Cash Return
5.6%
Cap rate
0.7%
Rent to Value Ratio
Active
$194,900
3
bds
|
2
ba
|
1,569
sqft
|
built
2004
6525 Emerald Hill Ct, Indianapolis, IN 46237
$-74
Cash flow
-2.0%
Cash-on-Cash Return
5.8%
Cap rate
0.8%
Rent to Value Ratio
Active
$349,000
3
bds
|
3
ba
|
3,005
sqft
|
built
2004
8251 Garden Ridge Rd, Indianapolis, IN 46237
$-126
Cash flow
-1.9%
Cash-on-Cash Return
5.8%
Cap rate
0.7%
Rent to Value Ratio
Active
$355,000
3
bds
|
3
ba
|
2,113
sqft
|
built
1994
7532 Perilla Ct, Indianapolis, IN 46237
$-369
Cash flow
-5.4%
Cash-on-Cash Return
5.0%
Cap rate
0.6%
Rent to Value Ratio
Active
$269,900
3
bds
|
3
ba
|
2,306
sqft
|
built
2007
4916 Franklin Villas Dr, Indianapolis, IN 46237
$-129
Cash flow
-2.5%
Cash-on-Cash Return
5.7%
Cap rate
0.7%
Rent to Value Ratio
Active
$220,000
3
bds
|
1
ba
|
1,272
sqft
|
built
1972
2847 Merts Dr, Indianapolis, IN 46237
$93
Cash flow
2.2%
Cash-on-Cash Return
6.8%
Cap rate
0.8%
Rent to Value Ratio
Active
$264,900
4
bds
|
2
ba
|
1,648
sqft
|
built
1977
4928 Dancer Dr, Indianapolis, IN 46237
$-141
Cash flow
-2.8%
Cash-on-Cash Return
5.6%
Cap rate
0.7%
Rent to Value Ratio
Active
$244,900
3
bds
|
2
ba
|
1,212
sqft
|
built
1995
5825 Sapelo Dr, Indianapolis, IN 46237
$-37
Cash flow
-0.8%
Cash-on-Cash Return
6.1%
Cap rate
0.7%
Rent to Value Ratio
Active
$265,000
4
bds
|
4
ba
|
1,794
sqft
|
built
1975
5760 Tim Tam Ct, Indianapolis, IN 46237
$-3
Cash flow
-0.1%
Cash-on-Cash Return
6.2%
Cap rate
0.8%
Rent to Value Ratio
Active
$325,000
4
bds
|
3
ba
|
2,609
sqft
|
built
1999
5340 Thompson Park Blvd, Indianapolis, IN 46237
$-138
Cash flow
-2.2%
Cash-on-Cash Return
5.8%
Cap rate
0.7%
Rent to Value Ratio
Active
$334,900
4
bds
|
3
ba
|
2,384
sqft
|
built
2013
8354 Fieldfare Way, Indianapolis, IN 46237
$-266
Cash flow
-4.1%
Cash-on-Cash Return
5.3%
Cap rate
0.7%
Rent to Value Ratio
Active
$259,900
4
bds
|
3
ba
|
1,540
sqft
|
built
1957
3015 E Sumner Ave, Indianapolis, IN 46237
$-253
Cash flow
-5.1%
Cash-on-Cash Return
5.1%
Cap rate
0.6%
Rent to Value Ratio
Active
$275,400
4
bds
|
3
ba
|
1,801
sqft
|
built
1996
3611 Owster Ln, Indianapolis, IN 46237
$-211
Cash flow
-4.0%
Cash-on-Cash Return
5.3%
Cap rate
0.7%
Rent to Value Ratio
Active
$359,000
4
bds
|
3
ba
|
2,142
sqft
|
built
2015
5859 Edelle Dr, Indianapolis, IN 46237
$-321
Cash flow
-4.7%
Cash-on-Cash Return
5.1%
Cap rate
0.6%
Rent to Value Ratio
Active
$249,500
3
bds
|
2
ba
|
1,248
sqft
|
built
1977
7645 Inverness Dr, Indianapolis, IN 46237
$-105
Cash flow
-2.2%
Cash-on-Cash Return
5.6%
Cap rate
0.7%
Rent to Value Ratio
Active
$355,000
3
bds
|
3
ba
|
2,004
sqft
|
built
2021
5335 Rum Cherry Way, Indianapolis, IN 46237
$-134
Cash flow
-2.0%
Cash-on-Cash Return
5.7%
Cap rate
0.7%
Rent to Value Ratio
Active
$360,000
5
bds
|
3
ba
|
3,502
sqft
|
built
2002
5637 Woodland Trace Blvd, Indianapolis, IN 46237
$-189
Cash flow
-2.7%
Cash-on-Cash Return
5.6%
Cap rate
0.7%
Rent to Value Ratio
Active
$345,000
4
bds
|
3
ba
|
2,842
sqft
|
built
2003
5236 Skipping Stone Dr, Indianapolis, IN 46237
$-312
Cash flow
-4.7%
Cash-on-Cash Return
5.2%
Cap rate
0.6%
Rent to Value Ratio
Active
$166,000
3
bds
|
1
ba
|
975
sqft
|
built
1959
1820 Martin St, Indianapolis, IN 46237
$99
Cash flow
3.1%
Cash-on-Cash Return
7.0%
Cap rate
0.8%
Rent to Value Ratio
Active
$259,900
3
bds
|
2
ba
|
1,634
sqft
|
built
2005
6105 Franklin Villas Way, Indianapolis, IN 46237
$-215
Cash flow
-4.3%
Cash-on-Cash Return
5.3%
Cap rate
0.7%
Rent to Value Ratio

Active
$275,000
2
bds
|
2
ba
|
1,507
sqft
|
built
2018
6026 Rockdell Dr, Indianapolis, IN 46237
$-97
Cash flow
-1.8%
Cash-on-Cash Return
5.8%
Cap rate
0.7%
Rent to Value Ratio