46239 Investment Properties for Sale
Browse homes for sale and investment properties in 46239. Refine your search by price, property type, or more.
Best cash flowing properties in 46239
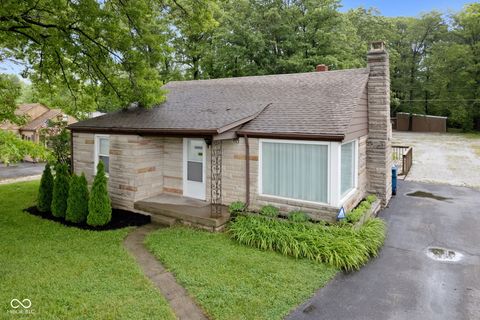
Active
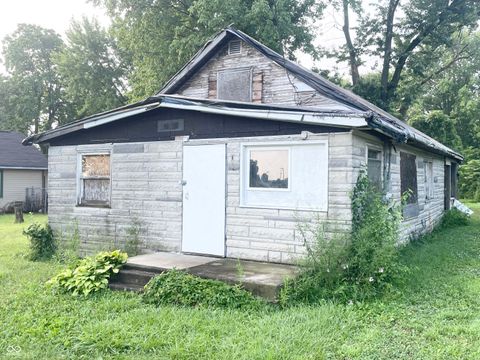
$79,900
3
bds
|
1
ba
|
1,571
sqft
|
built
1935
7211 E Troy Ave, Indianapolis, IN 46239
$695
Cash flow
45.4%
Cash-on-Cash Return
16.6%
Cap rate
2.0%
Rent to Value Ratio
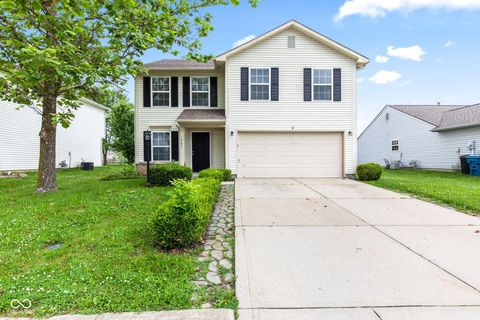
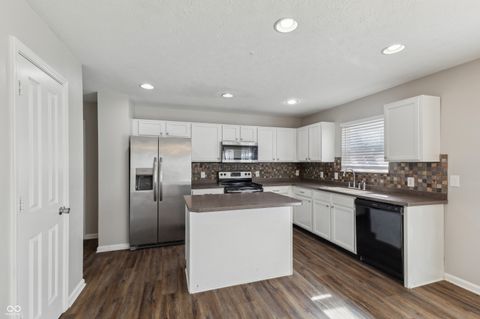
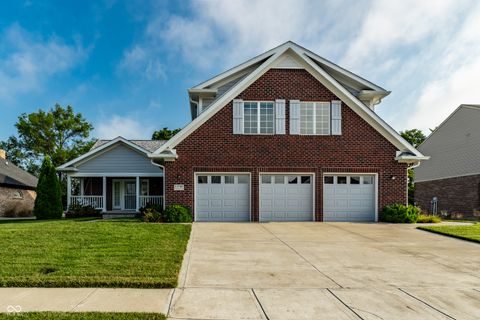
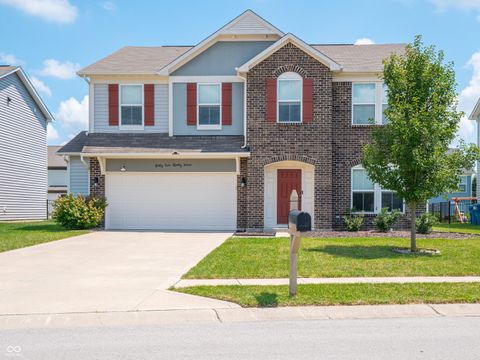
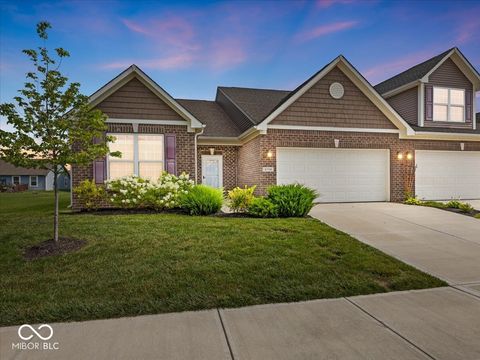
Active
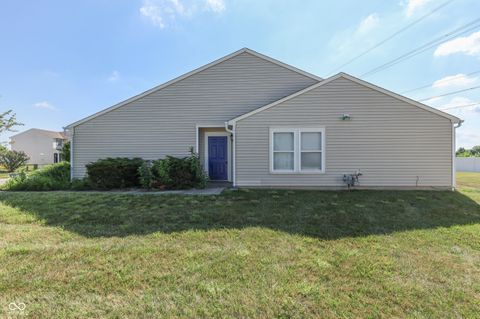
$169,900
2
bds
|
2
ba
|
1,309
sqft
|
built
2005
7853 Wildwood Farms Ln, Indianapolis, IN 46239
$217
Cash flow
6.7%
Cash-on-Cash Return
7.7%
Cap rate
1.1%
Rent to Value Ratio
81 out of 85 properties for sale in 46239
Limited Results Shown
Create a free account, or log in to reveal all property listings and enjoy the complete experience.
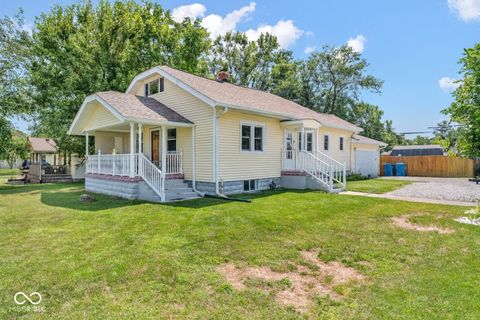
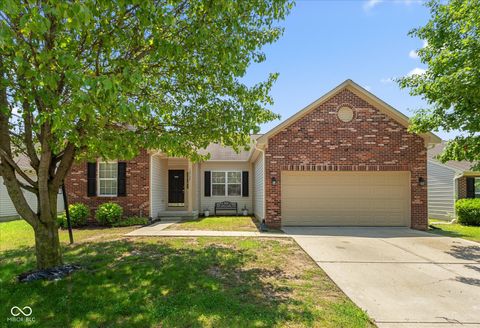
Active
$250,000
3
bds
|
2
ba
|
1,474
sqft
|
built
1921
7301 E Troy Ave, Indianapolis, IN 46239
$-39
Cash flow
-0.8%
Cash-on-Cash Return
6.0%
Cap rate
0.7%
Rent to Value Ratio
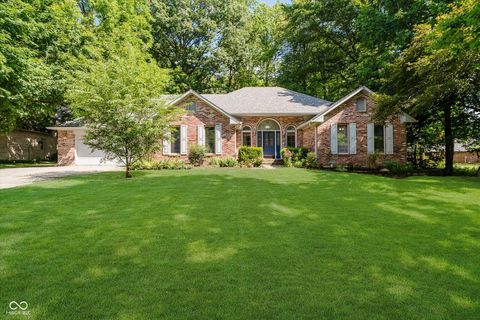
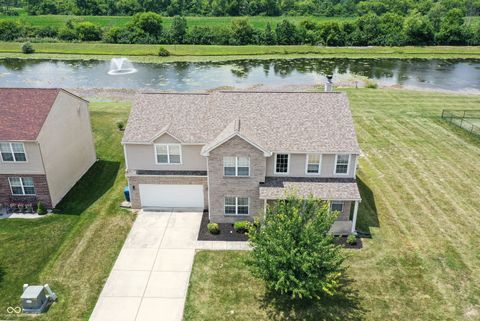
Active
$369,500
4
bds
|
2
ba
|
2,661
sqft
|
built
1991
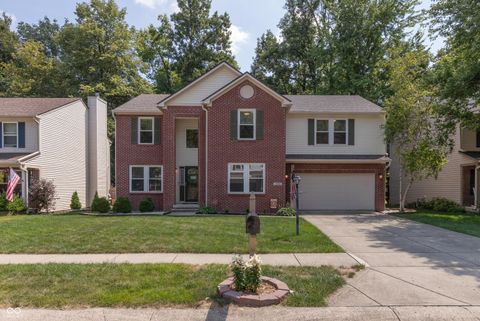
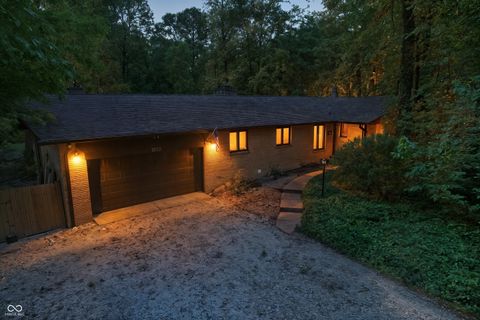
10408 Fallen Oak Dr, Indianapolis, IN 46239
$-189
Cash flow
-2.7%
Cash-on-Cash Return
5.5%
Cap rate
0.7%
Rent to Value Ratio
Active
$428,000
5
bds
|
4
ba
|
3,238
sqft
|
built
2001
7253 Ponderosa Pines Pl, Indianapolis, IN 46239
$-430
Cash flow
-5.2%
Cash-on-Cash Return
4.9%
Cap rate
0.6%
Rent to Value Ratio
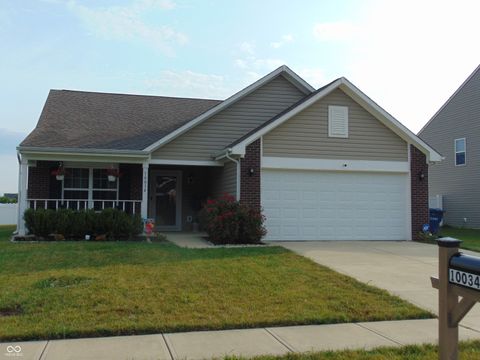
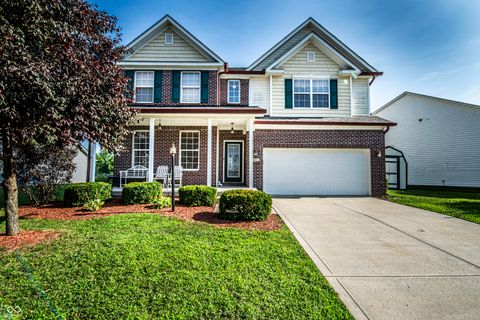
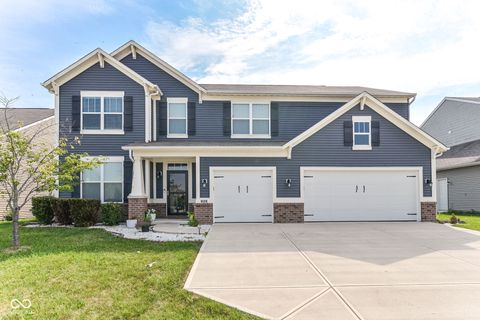
Active
$364,900
5
bds
|
3
ba
|
3,317
sqft
|
built
2016
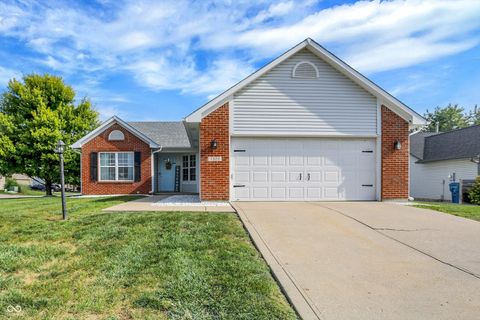
7851 Housefinch Ln, Indianapolis, IN 46239
$9
Cash flow
0.1%
Cash-on-Cash Return
6.2%
Cap rate
0.8%
Rent to Value Ratio
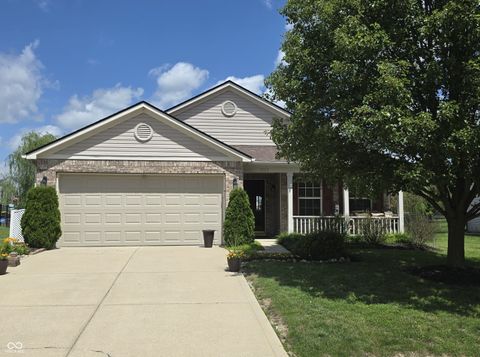
Active
$225,000
3
bds
|
2
ba
|
1,216
sqft
|
built
2000
1855 Windy Hill Ln, Indianapolis, IN 46239
$74
Cash flow
1.7%
Cash-on-Cash Return
6.5%
Cap rate
0.8%
Rent to Value Ratio
Active
$310,000
4
bds
|
3
ba
|
2,566
sqft
|
built
2003
7129 Dublin Ln, Indianapolis, IN 46239
$-102
Cash flow
-1.7%
Cash-on-Cash Return
5.8%
Cap rate
0.7%
Rent to Value Ratio
Active
$297,500
4
bds
|
3
ba
|
1,986
sqft
|
built
1999
1903 Windy Hill Ln, Indianapolis, IN 46239
$-228
Cash flow
-4.0%
Cash-on-Cash Return
5.2%
Cap rate
0.6%
Rent to Value Ratio
Active
$378,000
5
bds
|
3
ba
|
3,083
sqft
|
built
2009
4747 Summit Lake Pl, Indianapolis, IN 46239
$-4
Cash flow
-0.1%
Cash-on-Cash Return
6.1%
Cap rate
0.7%
Rent to Value Ratio
Active
$295,000
3
bds
|
2
ba
|
1,464
sqft
|
built
1956
1631 S Post Rd, Indianapolis, IN 46239
$-269
Cash flow
-4.8%
Cash-on-Cash Return
5.1%
Cap rate
0.6%
Rent to Value Ratio
Active
$315,000
6
bds
|
3
ba
|
3,912
sqft
|
built
2007
10725 Tedder Lake Dr, Indianapolis, IN 46239
$-62
Cash flow
-1.0%
Cash-on-Cash Return
5.9%
Cap rate
0.7%
Rent to Value Ratio
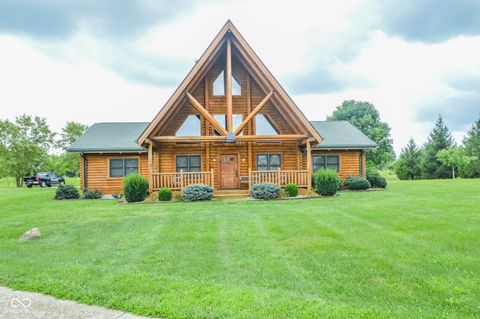
Active
$450,000
5
bds
|
5
ba
|
3,187
sqft
|
built
2018
11736 Grazing Ln, Indianapolis, IN 46239
$92
Cash flow
1.1%
Cash-on-Cash Return
6.4%
Cap rate
0.8%
Rent to Value Ratio
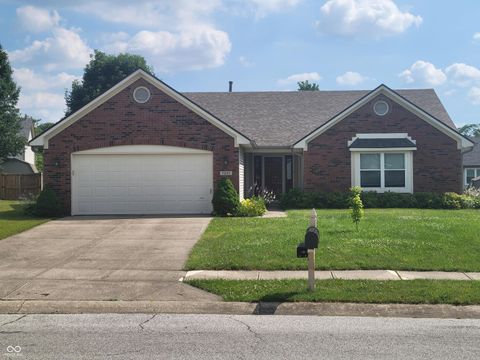
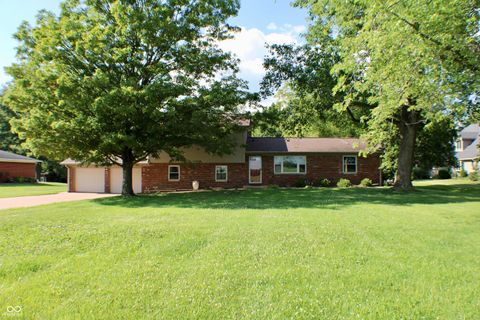
Active
$210,000
3
bds
|
1
ba
|
1,232
sqft
|
built
1952
4904 Betholm Dr, Indianapolis, IN 46239
$97
Cash flow
2.4%
Cash-on-Cash Return
6.7%
Cap rate
0.8%
Rent to Value Ratio
Active
$335,000
4
bds
|
3
ba
|
2,336
sqft
|
built
1999
10904 Midnight Dr, Indianapolis, IN 46239
$-198
Cash flow
-3.1%
Cash-on-Cash Return
5.4%
Cap rate
0.7%
Rent to Value Ratio
Active
$275,000
3
bds
|
3
ba
|
2,130
sqft
|
built
2010
5412 Bombay Dr, Indianapolis, IN 46239
$81
Cash flow
1.5%
Cash-on-Cash Return
6.5%
Cap rate
0.8%
Rent to Value Ratio
Active
$369,000
3
bds
|
2
ba
|
3,206
sqft
|
built
1967
2919 S Post Rd, Indianapolis, IN 46239
$-372
Cash flow
-5.3%
Cash-on-Cash Return
4.9%
Cap rate
0.6%
Rent to Value Ratio
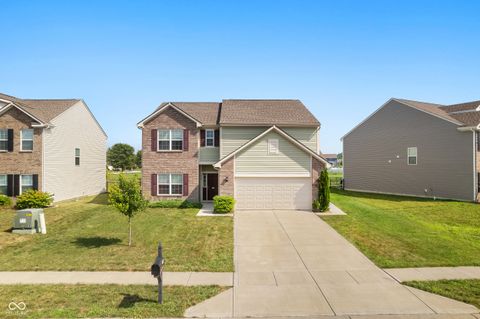
Active
$275,000
3
bds
|
2
ba
|
1,714
sqft
|
built
2010
2019 Sotheby Ln, Indianapolis, IN 46239
$-54
Cash flow
-1.0%
Cash-on-Cash Return
5.9%
Cap rate
0.7%
Rent to Value Ratio
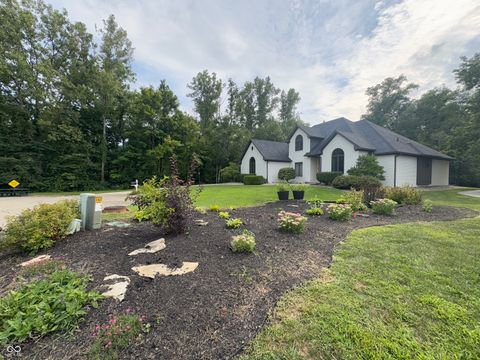
Active
$599,000
4
bds
|
3
ba
|
3,775
sqft
|
built
1992
2572 Wayward Wind Dr, Indianapolis, IN 46239
$-677
Cash flow
-5.9%
Cash-on-Cash Return
4.8%
Cap rate
0.6%
Rent to Value Ratio
Active
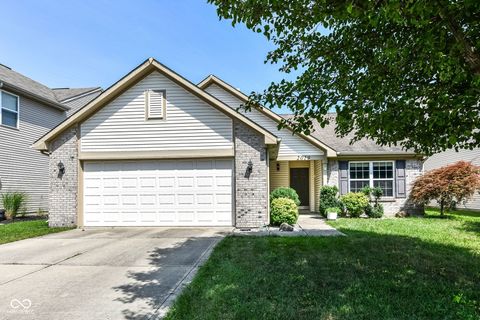
$269,900
3
bds
|
2
ba
|
1,618
sqft
|
built
2017
10034 James Run Dr, Indianapolis, IN 46239
$-28
Cash flow
-0.5%
Cash-on-Cash Return
6.0%
Cap rate
0.7%
Rent to Value Ratio
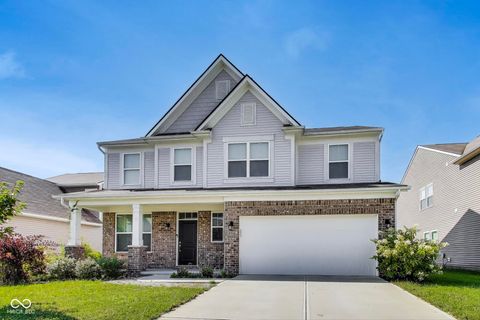
Active
$409,900
5
bds
|
3
ba
|
2,866
sqft
|
built
2018
4237 Blue Note Dr, Indianapolis, IN 46239
$-360
Cash flow
-4.6%
Cash-on-Cash Return
5.1%
Cap rate
0.6%
Rent to Value Ratio
Active
$375,000
5
bds
|
3
ba
|
3,162
sqft
|
built
2020
4522 Ozark Ln, Indianapolis, IN 46239
$-58
Cash flow
-0.8%
Cash-on-Cash Return
6.0%
Cap rate
0.7%
Rent to Value Ratio
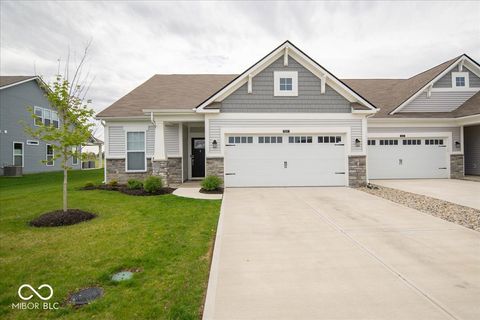
Active
$299,999
2
bds
|
3
ba
|
1,612
sqft
|
built
2022
9455 Orchard Cove Dr, Indianapolis, IN 46239
$-125
Cash flow
-2.2%
Cash-on-Cash Return
5.6%
Cap rate
0.8%
Rent to Value Ratio
Active
$345,900
4
bds
|
3
ba
|
3,111
sqft
|
built
2010
1416 Gleneagle Dr, Indianapolis, IN 46239
$-99
Cash flow
-1.5%
Cash-on-Cash Return
5.8%
Cap rate
0.7%
Rent to Value Ratio
Active
$389,899
4
bds
|
3
ba
|
2,800
sqft
|
built
2022
4224 Evening Sky Ct, Indianapolis, IN 46239
$-188
Cash flow
-2.5%
Cash-on-Cash Return
5.6%
Cap rate
0.7%
Rent to Value Ratio
Active
$259,000
3
bds
|
2
ba
|
1,506
sqft
|
built
2010
5406 Bombay Dr, Indianapolis, IN 46239
$21
Cash flow
0.4%
Cash-on-Cash Return
6.2%
Cap rate
0.8%
Rent to Value Ratio
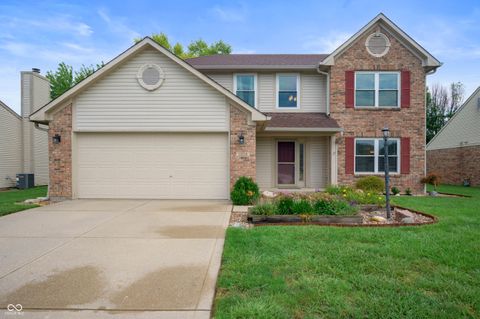
Active
$333,000
4
bds
|
3
ba
|
2,302
sqft
|
built
2017
10451 Pintail Ln, Indianapolis, IN 46239
$-119
Cash flow
-1.9%
Cash-on-Cash Return
5.7%
Cap rate
0.7%
Rent to Value Ratio
Active
$280,000
2
bds
|
3
ba
|
1,775
sqft
|
built
1997
7948 Bent Willow Dr, Indianapolis, IN 46239
$-1
Cash flow
0.0%
Cash-on-Cash Return
6.1%
Cap rate
0.8%
Rent to Value Ratio
Active
$415,000
7
bds
|
4
ba
|
4,502
sqft
|
built
2009
7407 Ponderosa Pines Ln, Indianapolis, IN 46239
$-20
Cash flow
-0.3%
Cash-on-Cash Return
6.1%
Cap rate
0.7%
Rent to Value Ratio
Active
$340,000
4
bds
|
3
ba
|
2,470
sqft
|
built
2018
10407 Deercrest Ln, Indianapolis, IN 46239
$-255
Cash flow
-3.9%
Cash-on-Cash Return
5.2%
Cap rate
0.6%
Rent to Value Ratio
Active
$314,900
3
bds
|
2
ba
|
1,900
sqft
|
built
1998
7227 Kidwell Dr, Indianapolis, IN 46239
$-265
Cash flow
-4.4%
Cash-on-Cash Return
5.1%
Cap rate
0.6%
Rent to Value Ratio
Active
$272,500
4
bds
|
2
ba
|
1,730
sqft
|
built
1953
3456 S Sadlier Dr, Indianapolis, IN 46239
$-16
Cash flow
-0.3%
Cash-on-Cash Return
6.1%
Cap rate
0.7%
Rent to Value Ratio
Active
$319,000
3
bds
|
2
ba
|
1,656
sqft
|
built
2000
7322 Wildcat Run Ct, Indianapolis, IN 46239
$-286
Cash flow
-4.7%
Cash-on-Cash Return
5.1%
Cap rate
0.6%
Rent to Value Ratio
Active
$775,000
3
bds
|
2
ba
|
1,960
sqft
|
built
2003
8005 E Thompson Rd, Indianapolis, IN 46239
$-2,452
Cash flow
-16.5%
Cash-on-Cash Return
2.4%
Cap rate
0.3%
Rent to Value Ratio
Active
$299,900
3
bds
|
3
ba
|
2,184
sqft
|
built
1969
9808 E Troy Ave, Indianapolis, IN 46239
$-18
Cash flow
-0.3%
Cash-on-Cash Return
6.1%
Cap rate
0.7%
Rent to Value Ratio
Active
$299,000
3
bds
|
3
ba
|
1,990
sqft
|
built
1996
11008 Springtree Pl, Indianapolis, IN 46239
$-170
Cash flow
-3.0%
Cash-on-Cash Return
5.5%
Cap rate
0.7%
Rent to Value Ratio
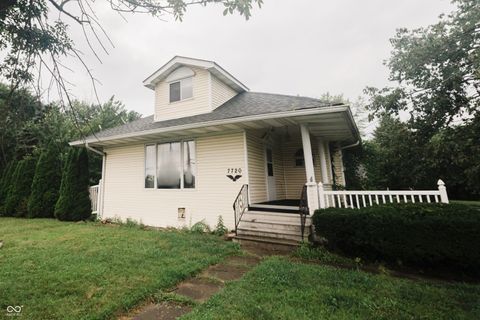
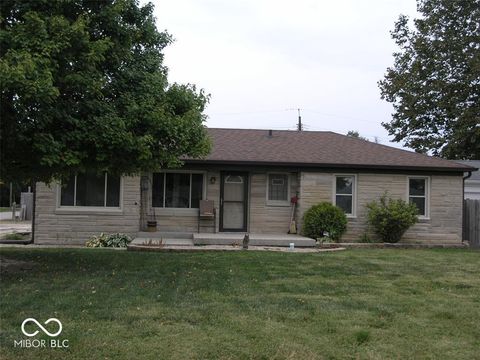
Active
$180,000
3
bds
|
1
ba
|
1,471
sqft
|
built
1925
7720 E Hanna Ave, Indianapolis, IN 46239
$182
Cash flow
5.3%
Cash-on-Cash Return
7.4%
Cap rate
0.9%
Rent to Value Ratio
Active
$274,800
2
bds
|
2
ba
|
1,640
sqft
|
built
2018
8750 Twain Ln, Indianapolis, IN 46239
$-73
Cash flow
-1.4%
Cash-on-Cash Return
5.8%
Cap rate
0.7%
Rent to Value Ratio
Active
$450,000
5
bds
|
3
ba
|
3,336
sqft
|
built
2016
4501 Goose Rock Dr, Indianapolis, IN 46239
$-345
Cash flow
-4.0%
Cash-on-Cash Return
5.2%
Cap rate
0.6%
Rent to Value Ratio
Active
$275,000
3
bds
|
2
ba
|
1,696
sqft
|
built
2006
7608 Mather Ln, Indianapolis, IN 46239
$-83
Cash flow
-1.6%
Cash-on-Cash Return
5.8%
Cap rate
0.7%
Rent to Value Ratio