46239 Investment Properties for Sale
Browse homes for sale and investment properties in 46239. Refine your search by price, property type, or more.
Best cash flowing properties in 46239
Active
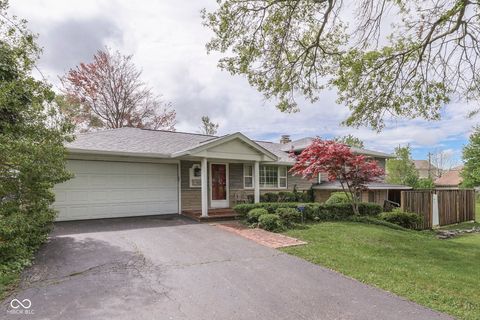
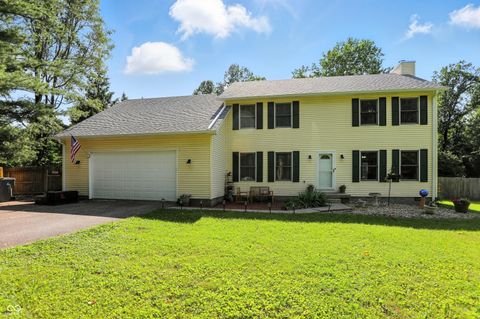
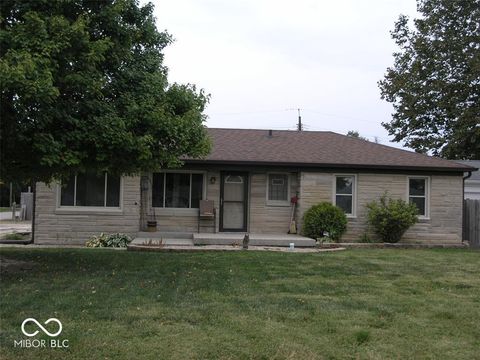
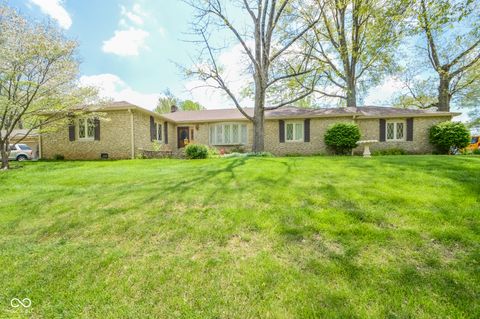
$275,000
3
bds
|
2
ba
|
3,120
sqft
|
built
1960
8903 Maple Hill Dr, Indianapolis, IN 46239
$316
Cash flow
6.0%
Cash-on-Cash Return
7.5%
Cap rate
0.9%
Rent to Value Ratio

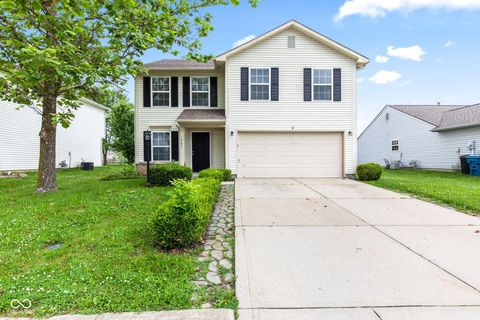
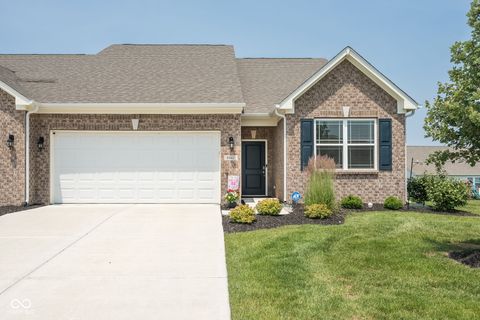
Active
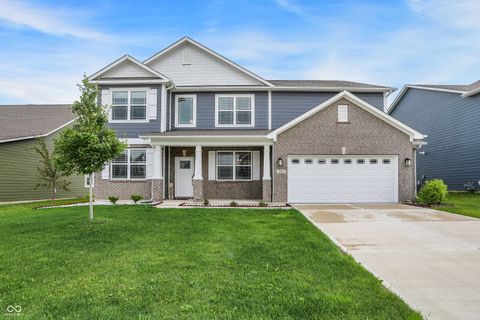
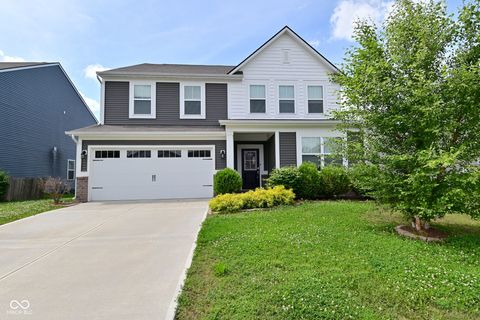
$250,000
3
bds
|
3
ba
|
1,800
sqft
|
built
2007
9704 Gull Lake Dr, Indianapolis, IN 46239
$75
Cash flow
1.6%
Cash-on-Cash Return
6.6%
Cap rate
0.8%
Rent to Value Ratio
59 out of 61 properties for sale in 46239
Limited Results Shown
Create a free account, or log in to reveal all property listings and enjoy the complete experience.
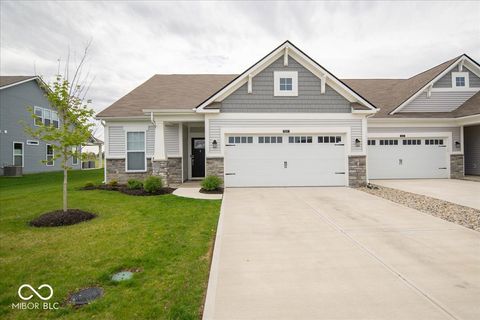
Active
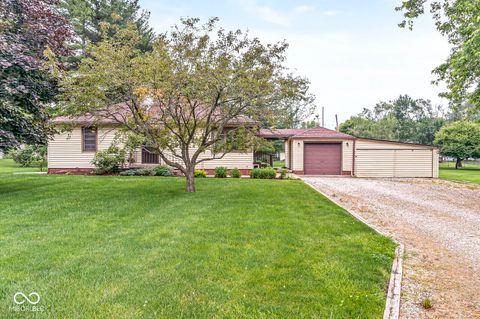
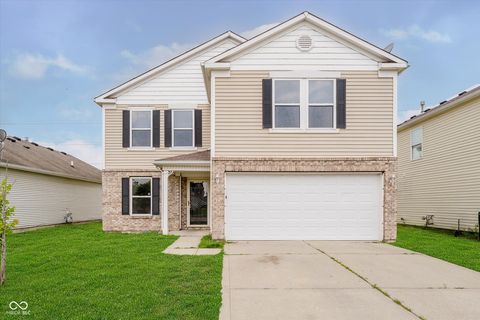
$299,900
4
bds
|
3
ba
|
1,986
sqft
|
built
1999
1903 Windy Hill Ln, Indianapolis, IN 46239
$-240
Cash flow
-4.2%
Cash-on-Cash Return
5.2%
Cap rate
0.6%
Rent to Value Ratio
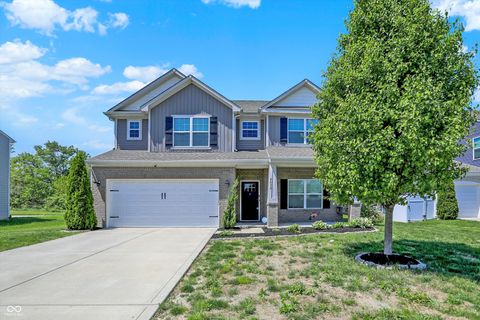
Active
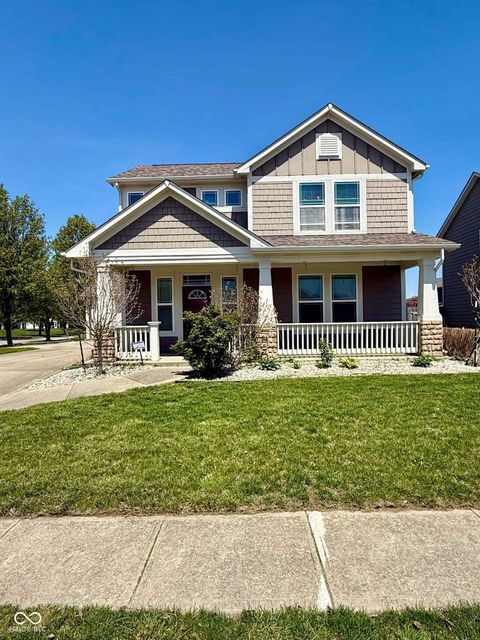
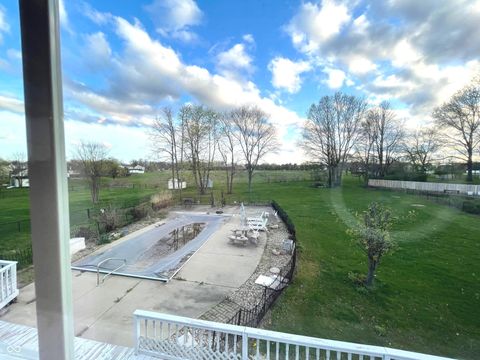
$299,900
3
bds
|
3
ba
|
2,136
sqft
|
built
2000
7549 Stockard St, Indianapolis, IN 46239
$-201
Cash flow
-3.5%
Cash-on-Cash Return
5.5%
Cap rate
0.7%
Rent to Value Ratio

Active
$319,000
3
bds
|
2
ba
|
1,891
sqft
|
built
1999
5615 Burning Tree Ct, Indianapolis, IN 46239
$-179
Cash flow
-2.9%
Cash-on-Cash Return
5.6%
Cap rate
0.7%
Rent to Value Ratio
Active
$410,000
5
bds
|
3
ba
|
3,083
sqft
|
built
2009
4747 Summit Lake Pl, Indianapolis, IN 46239
$-209
Cash flow
-2.7%
Cash-on-Cash Return
5.7%
Cap rate
0.7%
Rent to Value Ratio

Active
$343,900
4
bds
|
3
ba
|
2,690
sqft
|
built
1992
636 Creston Point Cir, Indianapolis, IN 46239
$-156
Cash flow
-2.4%
Cash-on-Cash Return
5.7%
Cap rate
0.7%
Rent to Value Ratio
Active
$318,000
3
bds
|
3
ba
|
3,912
sqft
|
built
2007
10725 Tedder Lake Dr, Indianapolis, IN 46239
$-108
Cash flow
-1.8%
Cash-on-Cash Return
5.9%
Cap rate
0.7%
Rent to Value Ratio

Active
$297,000
4
bds
|
3
ba
|
2,322
sqft
|
built
2004
3445 Brandenburg Blvd, Indianapolis, IN 46239
$-56
Cash flow
-1.0%
Cash-on-Cash Return
6.0%
Cap rate
0.7%
Rent to Value Ratio
Active
$295,000
3
bds
|
2
ba
|
1,464
sqft
|
built
1956
1631 S Post Rd, Indianapolis, IN 46239
$-269
Cash flow
-4.8%
Cash-on-Cash Return
5.1%
Cap rate
0.6%
Rent to Value Ratio
Active
$259,900
3
bds
|
2
ba
|
1,336
sqft
|
built
1979
8102 Sycamore Springs Trl, Indianapolis, IN 46239
$-115
Cash flow
-2.3%
Cash-on-Cash Return
5.7%
Cap rate
0.7%
Rent to Value Ratio

Active
$309,000
3
bds
|
2
ba
|
2,324
sqft
|
built
2017
8737 Twain Ln, Indianapolis, IN 46239
$-116
Cash flow
-2.0%
Cash-on-Cash Return
5.8%
Cap rate
0.7%
Rent to Value Ratio

Active
$329,000
4
bds
|
3
ba
|
2,446
sqft
|
built
1954
10036 E Troy Ave, Indianapolis, IN 46239
$-200
Cash flow
-3.2%
Cash-on-Cash Return
5.5%
Cap rate
0.7%
Rent to Value Ratio
Active
$214,700
3
bds
|
1
ba
|
1,086
sqft
|
built
1967
3809 Wildwood Dr, Indianapolis, IN 46239
$-17
Cash flow
-0.4%
Cash-on-Cash Return
6.2%
Cap rate
0.7%
Rent to Value Ratio

Active
$295,000
3
bds
|
2
ba
|
1,600
sqft
|
built
2010
10522 Hunters Crossing Blvd, Indianapolis, IN 46239
$-199
Cash flow
-3.5%
Cash-on-Cash Return
5.5%
Cap rate
0.7%
Rent to Value Ratio

Active
$420,000
4
bds
|
3
ba
|
2,549
sqft
|
built
2019
9903 Deep Royal Way, Indianapolis, IN 46239
$-453
Cash flow
-5.6%
Cash-on-Cash Return
5.0%
Cap rate
0.6%
Rent to Value Ratio
Active
$324,900
4
bds
|
3
ba
|
2,499
sqft
|
built
1992
1224 S Hunter Rd, Indianapolis, IN 46239
$-77
Cash flow
-1.2%
Cash-on-Cash Return
5.9%
Cap rate
0.7%
Rent to Value Ratio
Active
$305,000
2
bds
|
2
ba
|
1,598
sqft
|
built
2021
8842 Twain Ln, Indianapolis, IN 46239
$73
Cash flow
1.2%
Cash-on-Cash Return
6.4%
Cap rate
0.8%
Rent to Value Ratio
Active
$299,999
2
bds
|
3
ba
|
1,612
sqft
|
built
2022
9455 Orchard Cove Dr, Indianapolis, IN 46239
$-125
Cash flow
-2.2%
Cash-on-Cash Return
5.6%
Cap rate
0.8%
Rent to Value Ratio

Active
$399,900
4
bds
|
3
ba
|
3,651
sqft
|
built
2016
8836 Hornady Ct, Indianapolis, IN 46239
$-185
Cash flow
-2.4%
Cash-on-Cash Return
5.7%
Cap rate
0.7%
Rent to Value Ratio
Active
$380,000
4
bds
|
3
ba
|
2,995
sqft
|
built
2019
4032 Stubbington Ln, Indianapolis, IN 46239
$-106
Cash flow
-1.5%
Cash-on-Cash Return
5.9%
Cap rate
0.7%
Rent to Value Ratio

Active
$290,000
3
bds
|
3
ba
|
2,030
sqft
|
built
2005
2887 Ludwig Dr, Indianapolis, IN 46239
$-171
Cash flow
-3.1%
Cash-on-Cash Return
5.6%
Cap rate
0.7%
Rent to Value Ratio
Active
$279,900
4
bds
|
2
ba
|
1,730
sqft
|
built
1953
3456 S Sadlier Dr, Indianapolis, IN 46239
$-81
Cash flow
-1.5%
Cash-on-Cash Return
5.9%
Cap rate
0.7%
Rent to Value Ratio

Active
$395,000
4
bds
|
3
ba
|
2,470
sqft
|
built
2021
11034 Saddlebred Dr, Indianapolis, IN 46239
$-390
Cash flow
-5.2%
Cash-on-Cash Return
5.1%
Cap rate
0.6%
Rent to Value Ratio
Active
$479,900
5
bds
|
3
ba
|
3,475
sqft
|
built
2022
5812 Flat Hill Dr, Indianapolis, IN 46239
$-250
Cash flow
-2.7%
Cash-on-Cash Return
5.5%
Cap rate
0.7%
Rent to Value Ratio
Active
$249,900
3
bds
|
2
ba
|
1,200
sqft
|
built
1951
4010 S Bazil Ave, Indianapolis, IN 46239
$-176
Cash flow
-3.7%
Cash-on-Cash Return
5.3%
Cap rate
0.6%
Rent to Value Ratio
Active
$390,000
3
bds
|
3
ba
|
2,468
sqft
|
built
2006
8830 Kipling Dr, Indianapolis, IN 46239
$-147
Cash flow
-2.0%
Cash-on-Cash Return
5.8%
Cap rate
0.7%
Rent to Value Ratio
Active
$325,000
3
bds
|
3
ba
|
1,911
sqft
|
built
1969
10827 Wonderland Dr, Indianapolis, IN 46239
$-317
Cash flow
-5.1%
Cash-on-Cash Return
5.1%
Cap rate
0.6%
Rent to Value Ratio
Active
$350,000
5
bds
|
4
ba
|
3,055
sqft
|
built
2020
10319 Pronghorn Ln, Indianapolis, IN 46239
$66
Cash flow
1.0%
Cash-on-Cash Return
6.5%
Cap rate
0.8%
Rent to Value Ratio
Active
$265,000
4
bds
|
3
ba
|
2,030
sqft
|
built
2005
2834 Wolfgang Dr, Indianapolis, IN 46239
$-162
Cash flow
-3.2%
Cash-on-Cash Return
5.5%
Cap rate
0.7%
Rent to Value Ratio

Active
$350,000
4
bds
|
3
ba
|
2,289
sqft
|
built
2021
8969 Faulkner Dr, Indianapolis, IN 46239
$-102
Cash flow
-1.5%
Cash-on-Cash Return
5.9%
Cap rate
0.7%
Rent to Value Ratio

Active
$286,000
3
bds
|
3
ba
|
2,583
sqft
|
built
2005
7737 Wolfgang Pl, Indianapolis, IN 46239
$-132
Cash flow
-2.4%
Cash-on-Cash Return
5.7%
Cap rate
0.7%
Rent to Value Ratio

Active
$479,900
6
bds
|
4
ba
|
4,381
sqft
|
built
2020
10902 Jimmy Lake Dr, Indianapolis, IN 46239
$-815
Cash flow
-8.9%
Cash-on-Cash Return
4.2%
Cap rate
0.5%
Rent to Value Ratio
Active
$459,900
4
bds
|
4
ba
|
3,452
sqft
|
built
2002
7121 Fields Way, Indianapolis, IN 46239
$-500
Cash flow
-5.7%
Cash-on-Cash Return
5.0%
Cap rate
0.6%
Rent to Value Ratio
Active
$300,000
3
bds
|
3
ba
|
2,055
sqft
|
built
2001
7156 Chemistry Ct, Indianapolis, IN 46239
$-194
Cash flow
-3.4%
Cash-on-Cash Return
5.4%
Cap rate
0.7%
Rent to Value Ratio
Active
$540,000
5
bds
|
3
ba
|
3,182
sqft
|
built
2022
10638 Oak Bend Blvd, Indianapolis, IN 46239
$-600
Cash flow
-5.8%
Cash-on-Cash Return
4.8%
Cap rate
0.6%
Rent to Value Ratio
Active
$349,900
4
bds
|
4
ba
|
2,564
sqft
|
built
2002
2248 Salem Park Dr, Indianapolis, IN 46239
$-330
Cash flow
-4.9%
Cash-on-Cash Return
5.1%
Cap rate
0.6%
Rent to Value Ratio

Active
$400,000
5
bds
|
3
ba
|
3,112
sqft
|
built
2013
4650 Blue Marlin Way, Indianapolis, IN 46239
$-185
Cash flow
-2.4%
Cash-on-Cash Return
5.7%
Cap rate
0.7%
Rent to Value Ratio
Active
$440,000
5
bds
|
3
ba
|
3,116
sqft
|
built
2017
4539 Maldenhair Dr, Indianapolis, IN 46239
$-406
Cash flow
-4.8%
Cash-on-Cash Return
5.2%
Cap rate
0.6%
Rent to Value Ratio
Active
$334,900
3
bds
|
2
ba
|
1,856
sqft
|
built
2016
4420 Wild Turkey Dr, Indianapolis, IN 46239
$-119
Cash flow
-1.9%
Cash-on-Cash Return
5.8%
Cap rate
0.7%
Rent to Value Ratio