46241 Investment Properties for Sale
Browse homes for sale and investment properties in 46241. Refine your search by price, property type, or more.
Best cash flowing properties in 46241
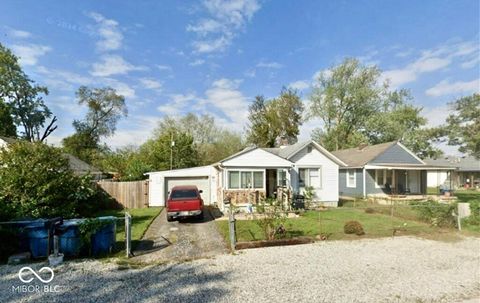
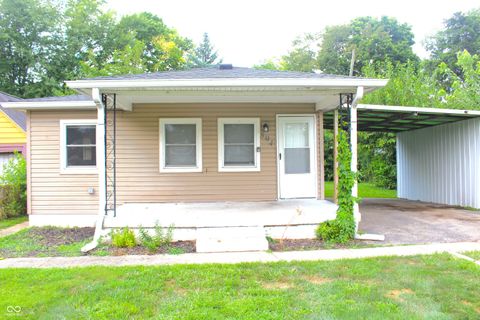
Active
$75,000
1
bds
|
1
ba
|
692
sqft
|
built
1935
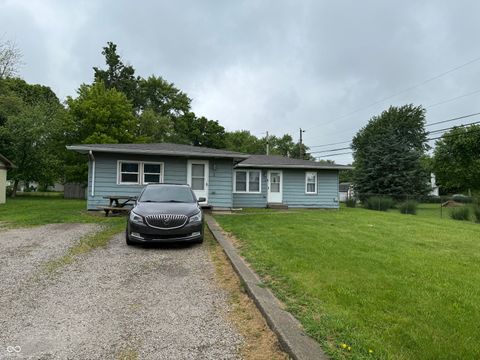
2638 S Mc Clure St, Indianapolis, IN 46241
$513
Cash flow
35.7%
Cash-on-Cash Return
14.4%
Cap rate
1.7%
Rent to Value Ratio
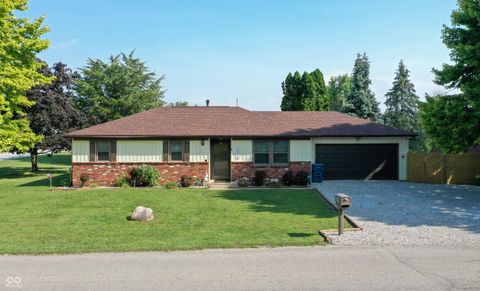
Active
$185,000
3
bds
|
2
ba
|
1,236
sqft
|
built
1959
2625 S Cole St, Indianapolis, IN 46241
$432
Cash flow
12.2%
Cash-on-Cash Return
9.0%
Cap rate
1.1%
Rent to Value Ratio
33 out of 36 properties for sale in 46241
Limited Results Shown
Create a free account, or log in to reveal all property listings and enjoy the complete experience.
Active
$99,900
2
bds
|
1
ba
|
888
sqft
|
built
1935
613 S Mickley Ave, Indianapolis, IN 46241
$316
Cash flow
16.5%
Cash-on-Cash Return
9.9%
Cap rate
1.2%
Rent to Value Ratio
Active
$150,000
3
bds
|
1
ba
|
1,056
sqft
|
built
1951
4607 Melrose Ave, Indianapolis, IN 46241
$-9
Cash flow
-0.3%
Cash-on-Cash Return
6.1%
Cap rate
0.7%
Rent to Value Ratio
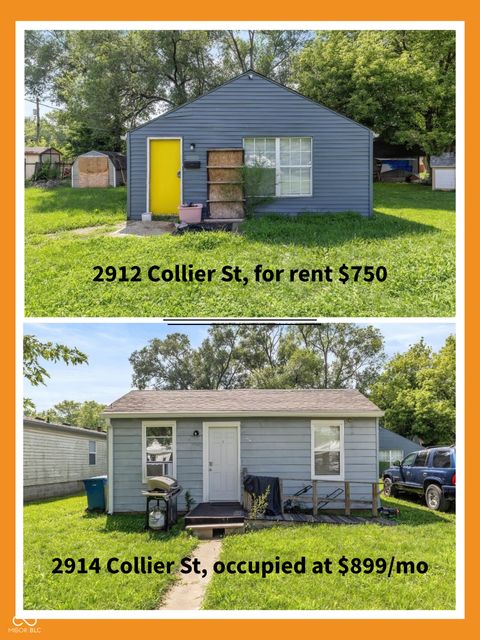
Active
$132,000
2
bds
|
1
ba
|
768
sqft
|
built
1946
2914 Collier St, Indianapolis, IN 46241
$221
Cash flow
8.7%
Cash-on-Cash Return
8.2%
Cap rate
1.0%
Rent to Value Ratio
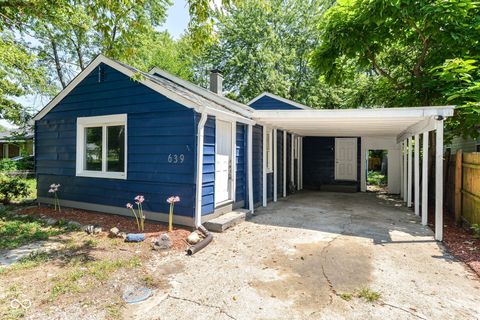
Active
$199,900
3
bds
|
2
ba
|
1,398
sqft
|
built
1940
639 S Worth Ave, Indianapolis, IN 46241
$-58
Cash flow
-1.5%
Cash-on-Cash Return
5.8%
Cap rate
0.7%
Rent to Value Ratio
Active
$214,900
2
bds
|
1
ba
|
1,028
sqft
|
built
1925
4839 W Regent St, Indianapolis, IN 46241
$-273
Cash flow
-6.6%
Cash-on-Cash Return
4.6%
Cap rate
0.6%
Rent to Value Ratio
Active
$117,000
2
bds
|
1
ba
|
852
sqft
|
built
1949
4805 Plainfield Ave, Indianapolis, IN 46241
$367
Cash flow
16.4%
Cash-on-Cash Return
9.9%
Cap rate
1.2%
Rent to Value Ratio
Active
$254,500
4
bds
|
3
ba
|
1,980
sqft
|
built
2002
411 Red Tail Ln, Indianapolis, IN 46241
$-81
Cash flow
-1.7%
Cash-on-Cash Return
5.8%
Cap rate
0.7%
Rent to Value Ratio
Active
$235,000
3
bds
|
2
ba
|
1,248
sqft
|
built
1960
2601 S Cole St, Indianapolis, IN 46241
$-169
Cash flow
-3.8%
Cash-on-Cash Return
5.3%
Cap rate
0.6%
Rent to Value Ratio
Active
$167,500
3
bds
|
1
ba
|
1,056
sqft
|
built
1930
625 Collier St, Indianapolis, IN 46241
$39
Cash flow
1.2%
Cash-on-Cash Return
6.4%
Cap rate
0.8%
Rent to Value Ratio
Active
$175,000
3
bds
|
1
ba
|
1,056
sqft
|
built
1968
2817 S Rybolt Ave, Indianapolis, IN 46241
$208
Cash flow
6.2%
Cash-on-Cash Return
7.6%
Cap rate
0.9%
Rent to Value Ratio
Active
$210,000
3
bds
|
2
ba
|
1,269
sqft
|
built
1969
3344 Southwest Dr, Indianapolis, IN 46241
$28
Cash flow
0.7%
Cash-on-Cash Return
6.3%
Cap rate
0.8%
Rent to Value Ratio
Active
$253,000
3
bds
|
3
ba
|
1,818
sqft
|
built
1999
7032 Moon Ct, Indianapolis, IN 46241
$63
Cash flow
1.3%
Cash-on-Cash Return
6.4%
Cap rate
0.8%
Rent to Value Ratio
Active
$139,900
2
bds
|
1
ba
|
832
sqft
|
built
1931
5235 Ida St, Indianapolis, IN 46241
$249
Cash flow
9.3%
Cash-on-Cash Return
8.3%
Cap rate
1.0%
Rent to Value Ratio
Active
$179,900
3
bds
|
1
ba
|
1,327
sqft
|
built
1930
548 S Vine St, Indianapolis, IN 46241
$44
Cash flow
1.3%
Cash-on-Cash Return
6.4%
Cap rate
0.8%
Rent to Value Ratio
Active
$255,000
3
bds
|
2
ba
|
1,092
sqft
|
built
1981
5510 Chelsea Rd, Indianapolis, IN 46241
$-202
Cash flow
-4.1%
Cash-on-Cash Return
5.2%
Cap rate
0.6%
Rent to Value Ratio
Active
$190,000
3
bds
|
3
ba
|
1,440
sqft
|
built
1968
1308 Phillips Dr, Indianapolis, IN 46241
$-7
Cash flow
-0.2%
Cash-on-Cash Return
6.1%
Cap rate
0.7%
Rent to Value Ratio
Active
$200,000
3
bds
|
2
ba
|
1,152
sqft
|
built
1935
631 S Biltmore Ave, Indianapolis, IN 46241
$-58
Cash flow
-1.5%
Cash-on-Cash Return
5.8%
Cap rate
0.7%
Rent to Value Ratio
Active
$235,000
3
bds
|
2
ba
|
1,260
sqft
|
built
1962
1116 Heatherwood Dr, Indianapolis, IN 46241
$-100
Cash flow
-2.2%
Cash-on-Cash Return
5.6%
Cap rate
0.7%
Rent to Value Ratio
Active
$210,000
0
bds
|
0
ba
|
0
sqft
|
built
1956
1304 Phillips Dr, Indianapolis, IN 46241
$-317
Cash flow
-7.9%
Cash-on-Cash Return
4.3%
Cap rate
0.5%
Rent to Value Ratio
Active
$270,000
3
bds
|
2
ba
|
1,952
sqft
|
built
1971
1024 Foltz St, Indianapolis, IN 46241
$-141
Cash flow
-2.7%
Cash-on-Cash Return
5.5%
Cap rate
0.7%
Rent to Value Ratio
Active
$210,000
4
bds
|
2
ba
|
1,408
sqft
|
built
1928
555 S Auburn St, Indianapolis, IN 46241
$-248
Cash flow
-6.2%
Cash-on-Cash Return
4.7%
Cap rate
0.6%
Rent to Value Ratio
Active
$212,500
3
bds
|
2
ba
|
1,207
sqft
|
built
1996
5121 Seerley Creek Rd, Indianapolis, IN 46241
$15
Cash flow
0.4%
Cash-on-Cash Return
6.2%
Cap rate
0.8%
Rent to Value Ratio
Active
$99,000
3
bds
|
1
ba
|
912
sqft
|
built
1940
2509 Collier St, Indianapolis, IN 46241
$390
Cash flow
20.6%
Cash-on-Cash Return
10.9%
Cap rate
1.3%
Rent to Value Ratio
Active
$76,000
2
bds
|
1
ba
|
672
sqft
|
built
1940
4834 W Naomi St, Indianapolis, IN 46241
$370
Cash flow
25.4%
Cash-on-Cash Return
12.0%
Cap rate
1.4%
Rent to Value Ratio
Active
$259,900
3
bds
|
3
ba
|
1,616
sqft
|
built
1993
6947 Dunn Way, Indianapolis, IN 46241
$-89
Cash flow
-1.8%
Cash-on-Cash Return
5.7%
Cap rate
0.7%
Rent to Value Ratio
Active
$135,000
2
bds
|
1
ba
|
825
sqft
|
built
1930
732 S Biltmore Ave, Indianapolis, IN 46241
$205
Cash flow
7.9%
Cash-on-Cash Return
8.0%
Cap rate
1.0%
Rent to Value Ratio
Active
$199,900
3
bds
|
2
ba
|
1,304
sqft
|
built
1917
2720 S Taft Ave, Indianapolis, IN 46241
$-196
Cash flow
-5.1%
Cash-on-Cash Return
5.0%
Cap rate
0.6%
Rent to Value Ratio
Active
$240,000
3
bds
|
1
ba
|
1,137
sqft
|
built
1941
6514 Jackson St, Indianapolis, IN 46241
$13
Cash flow
0.3%
Cash-on-Cash Return
6.2%
Cap rate
0.8%
Rent to Value Ratio
Active
$160,000
2
bds
|
1
ba
|
888
sqft
|
built
1948
3054 S Rybolt Ave, Indianapolis, IN 46241
$-61
Cash flow
-2.0%
Cash-on-Cash Return
5.7%
Cap rate
0.7%
Rent to Value Ratio
Active
$159,900
3
bds
|
2
ba
|
1,000
sqft
|
built
1963
618 S Norfolk St, Indianapolis, IN 46241
$147
Cash flow
4.8%
Cash-on-Cash Return
7.2%
Cap rate
0.9%
Rent to Value Ratio
Active
$166,000
3
bds
|
2
ba
|
1,104
sqft
|
built
1967
894 S Auburn St, Indianapolis, IN 46241
$47
Cash flow
1.5%
Cash-on-Cash Return
6.5%
Cap rate
0.8%
Rent to Value Ratio