46254 Investment Properties for Sale
Browse homes for sale and investment properties in 46254. Refine your search by price, property type, or more.
Best cash flowing properties in 46254
Active
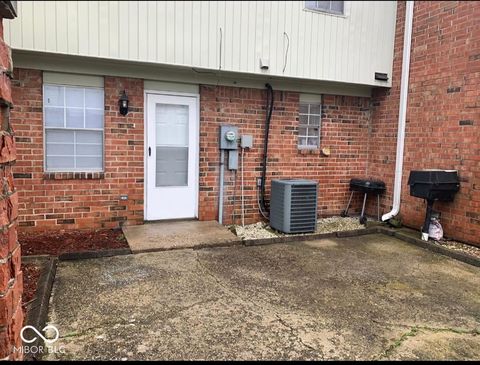
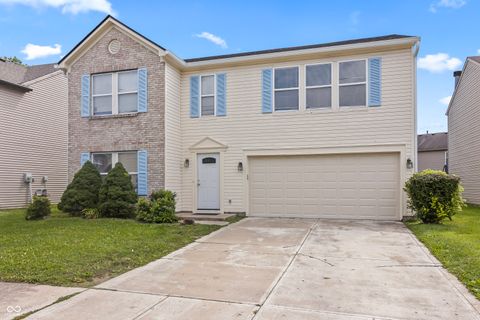
$110,000
3
bds
|
4
ba
|
1,602
sqft
|
built
1972
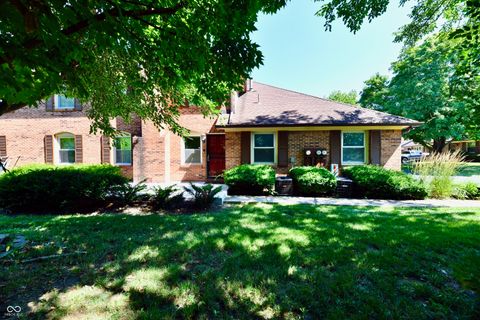
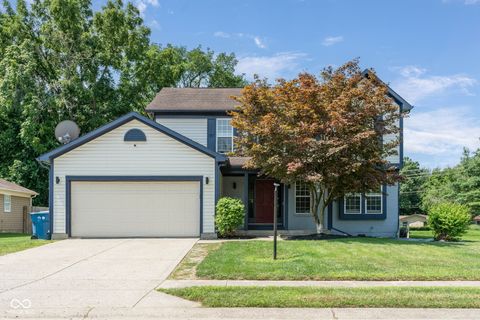
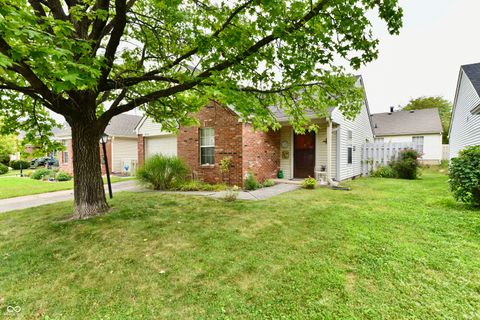
6340 Commons Dr, Indianapolis, IN 46254
$431
Cash flow
20.4%
Cash-on-Cash Return
10.8%
Cap rate
1.5%
Rent to Value Ratio
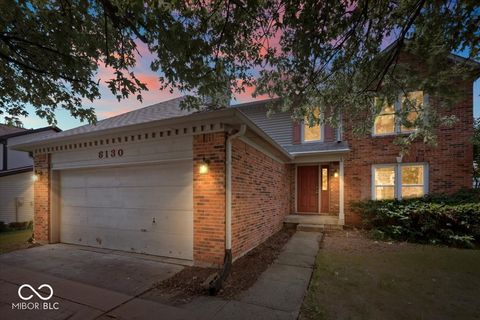
Active
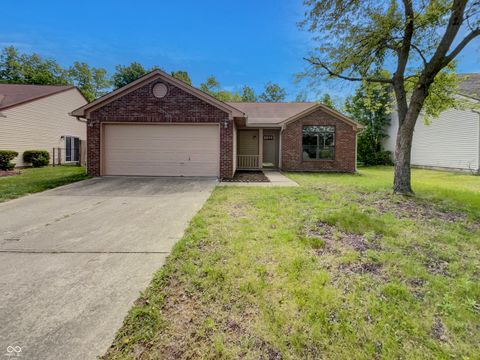
$225,000
4
bds
|
3
ba
|
2,004
sqft
|
built
1990
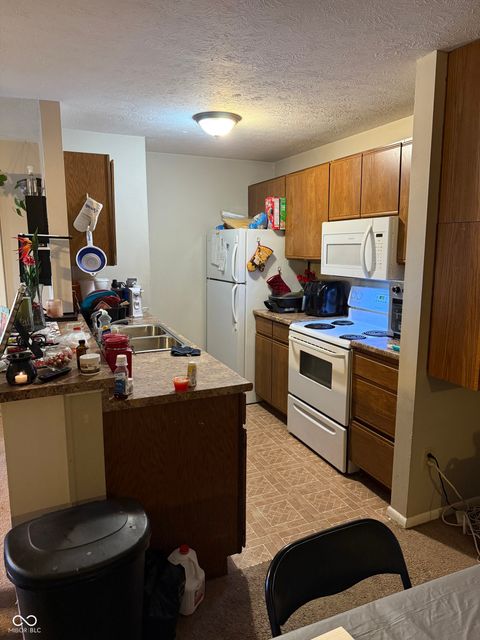
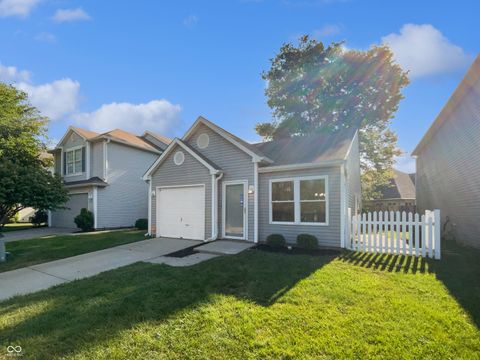
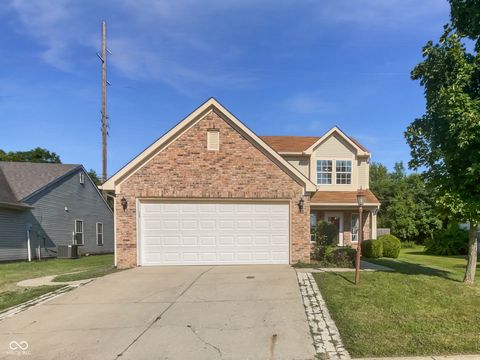
6130 Bethesda Way, Indianapolis, IN 46254
$339
Cash flow
7.9%
Cash-on-Cash Return
8.0%
Cap rate
1.0%
Rent to Value Ratio
40 out of 42 properties for sale in 46254
Limited Results Shown
Create a free account, or log in to reveal all property listings and enjoy the complete experience.
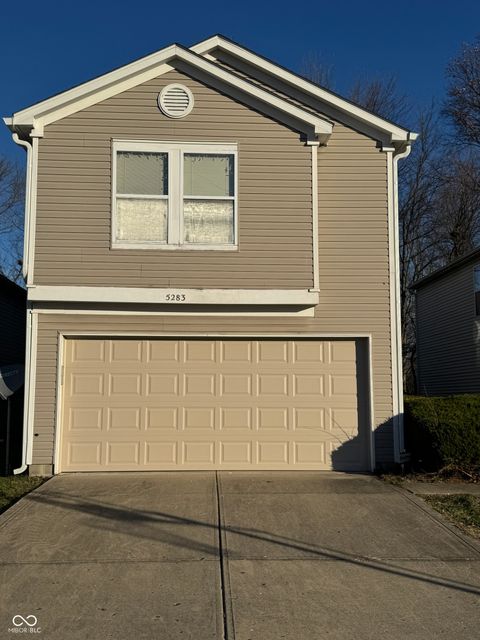
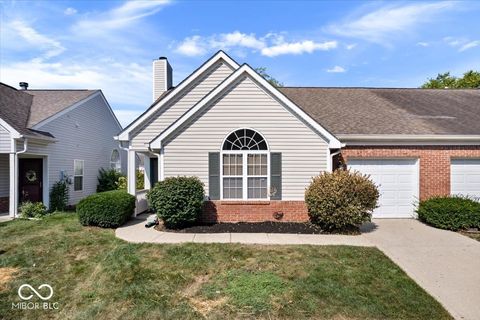
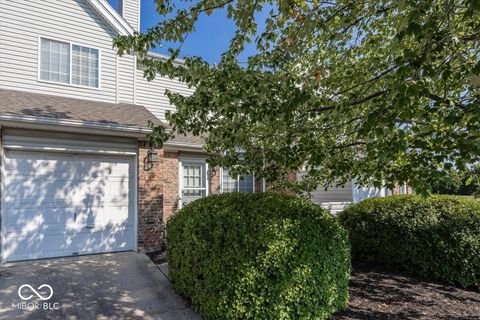
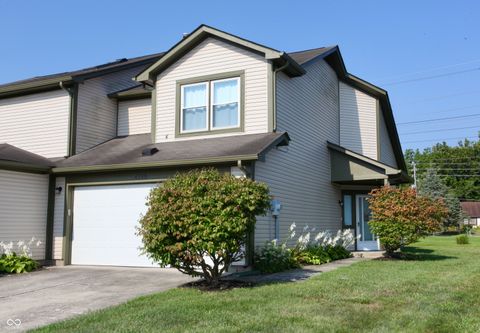
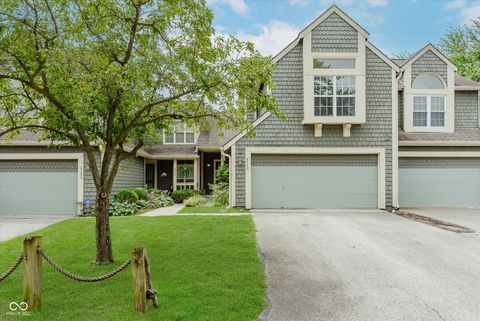
Active
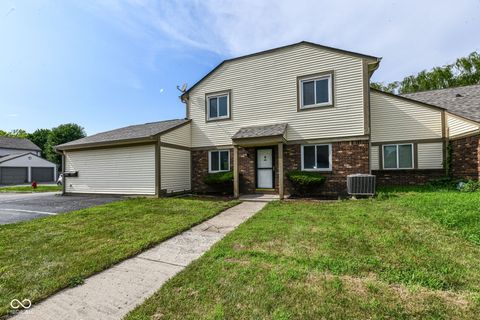
$230,000
3
bds
|
4
ba
|
1,727
sqft
|
built
1998
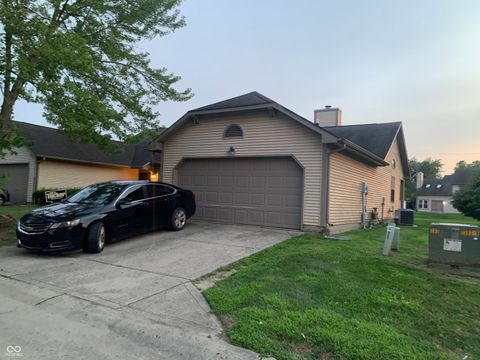
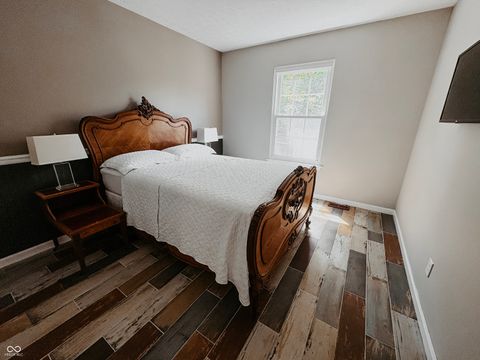
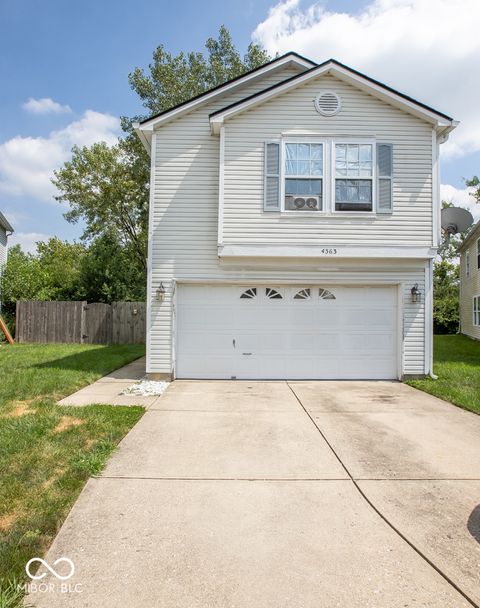
5283 Tufton Dr, Indianapolis, IN 46254
$64
Cash flow
1.5%
Cash-on-Cash Return
6.5%
Cap rate
0.8%
Rent to Value Ratio
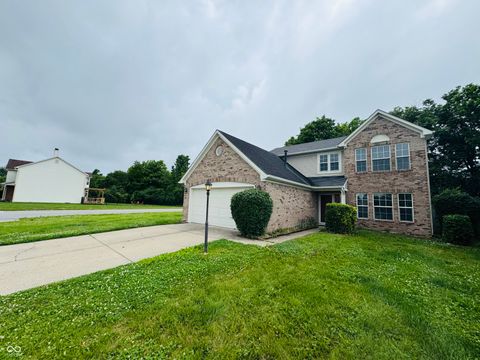
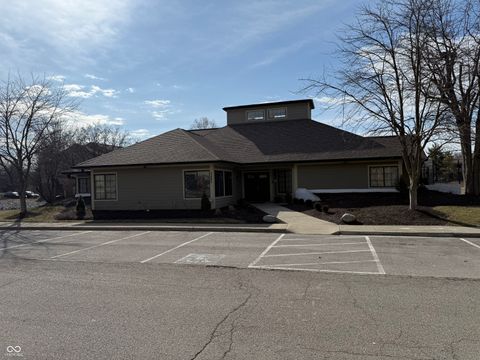
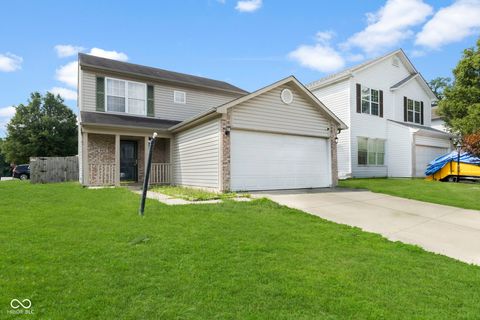
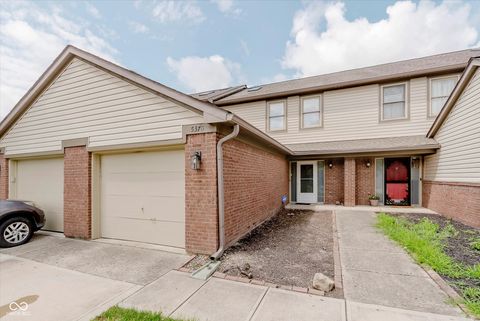
Active
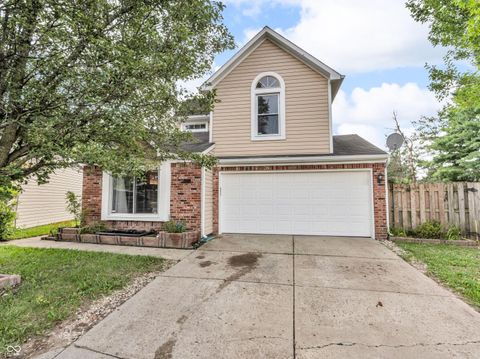
$295,000
3
bds
|
3
ba
|
1,816
sqft
|
built
1997
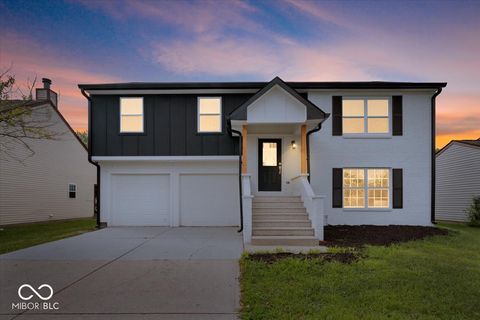
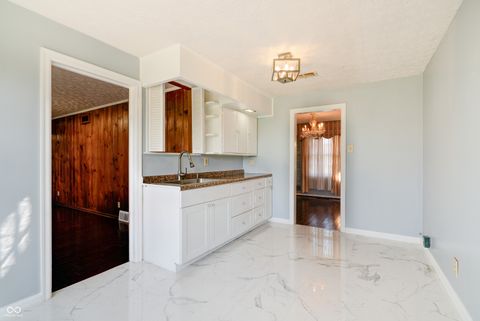
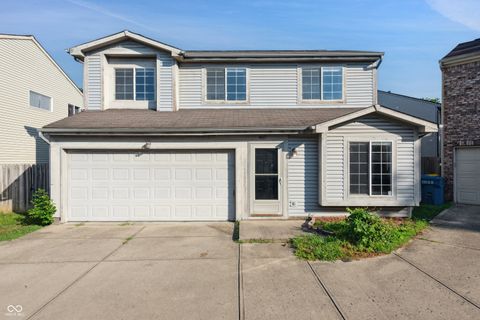
5938 Tybalt Ln, Indianapolis, IN 46254
$-131
Cash flow
-2.3%
Cash-on-Cash Return
5.6%
Cap rate
0.7%
Rent to Value Ratio
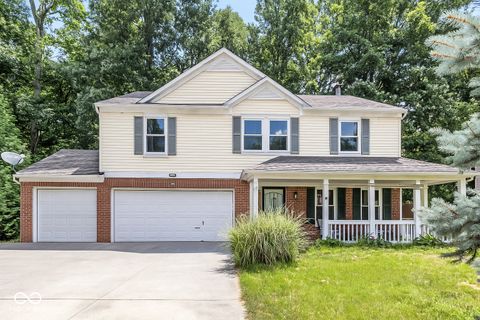
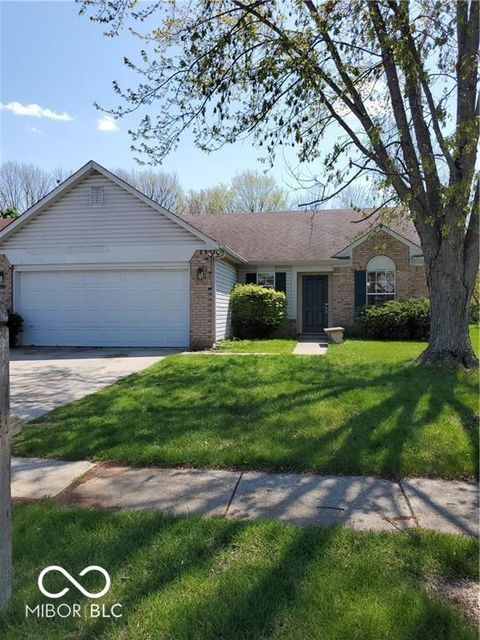
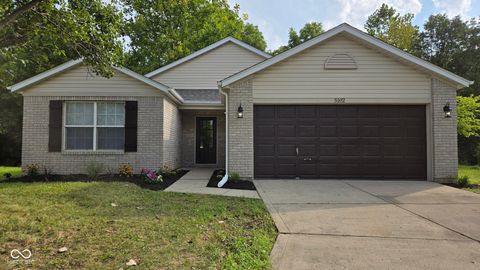
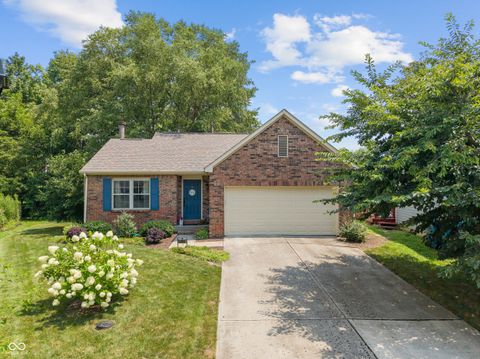
Active
$325,000
4
bds
|
3
ba
|
2,524
sqft
|
built
1998
5025 Flame Way, Indianapolis, IN 46254
$-147
Cash flow
-2.4%
Cash-on-Cash Return
5.6%
Cap rate
0.7%
Rent to Value Ratio
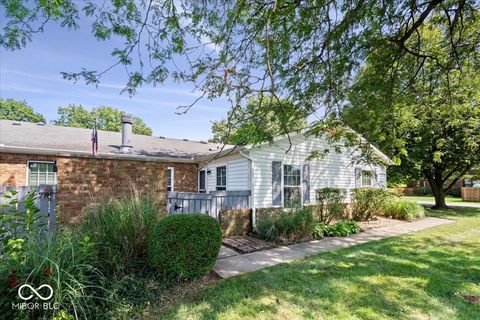
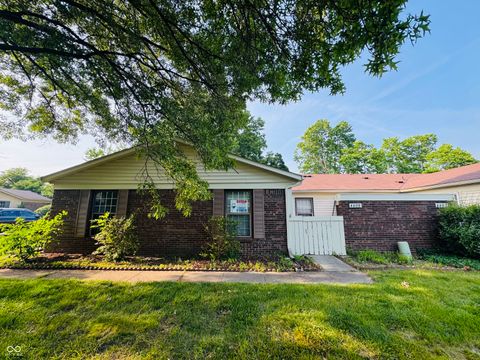
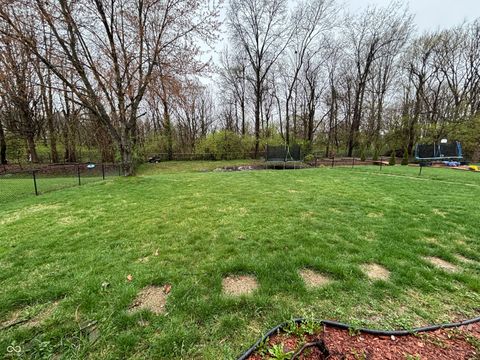
Active
$247,000
3
bds
|
2
ba
|
1,477
sqft
|
built
1994
4825 May Ridge Ln, Indianapolis, IN 46254
$-50
Cash flow
-1.1%
Cash-on-Cash Return
5.9%
Cap rate
0.7%
Rent to Value Ratio
Active
$159,900
3
bds
|
2
ba
|
1,300
sqft
|
built
1973
5933 Deerwood Ct, Indianapolis, IN 46254
$-198
Cash flow
-6.5%
Cash-on-Cash Return
4.7%
Cap rate
0.9%
Rent to Value Ratio
Active
$239,900
3
bds
|
2
ba
|
1,477
sqft
|
built
1991
4955 Peony Pl, Indianapolis, IN 46254
$-27
Cash flow
-0.6%
Cash-on-Cash Return
6.0%
Cap rate
0.8%
Rent to Value Ratio
Active
$225,000
4
bds
|
3
ba
|
1,584
sqft
|
built
1982
6137 Apache Dr, Indianapolis, IN 46254
$-220
Cash flow
-5.1%
Cash-on-Cash Return
5.0%
Cap rate
0.8%
Rent to Value Ratio
Active
$135,000
2
bds
|
2
ba
|
993
sqft
|
built
1987
4291 Village Parkway Cir W, Indianapolis, IN 46254
$-38
Cash flow
-1.5%
Cash-on-Cash Return
5.8%
Cap rate
1.0%
Rent to Value Ratio
Active
$184,900
2
bds
|
2
ba
|
1,046
sqft
|
built
1989
4112 Eagle Cove East Dr, Indianapolis, IN 46254
$27
Cash flow
0.8%
Cash-on-Cash Return
6.3%
Cap rate
0.9%
Rent to Value Ratio
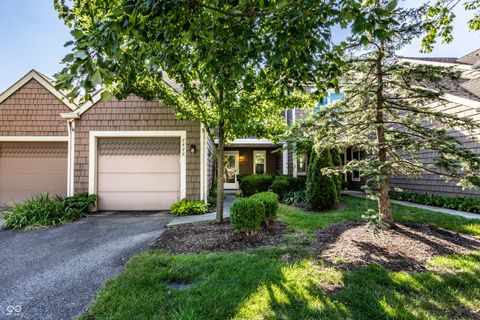
Active
$285,000
3
bds
|
3
ba
|
2,287
sqft
|
built
1995
6009 Tammin Dr, Indianapolis, IN 46254
$31
Cash flow
0.6%
Cash-on-Cash Return
6.3%
Cap rate
0.8%
Rent to Value Ratio
Active
$330,000
4
bds
|
3
ba
|
3,634
sqft
|
built
1989
4818 Rocky Knob Ln, Indianapolis, IN 46254
$28
Cash flow
0.4%
Cash-on-Cash Return
6.2%
Cap rate
0.8%
Rent to Value Ratio
Active
$199,000
2
bds
|
2
ba
|
958
sqft
|
built
1995
4821 Ossington Ct, Indianapolis, IN 46254
$-78
Cash flow
-2.0%
Cash-on-Cash Return
5.7%
Cap rate
0.7%
Rent to Value Ratio
Active
$239,900
2
bds
|
3
ba
|
1,549
sqft
|
built
1983
4635 Stansbury Ct, Indianapolis, IN 46254
$-244
Cash flow
-5.3%
Cash-on-Cash Return
4.9%
Cap rate
0.8%
Rent to Value Ratio
Active
$285,000
3
bds
|
2
ba
|
1,668
sqft
|
built
1952
6047 W 56th St, Indianapolis, IN 46254
$-218
Cash flow
-4.0%
Cash-on-Cash Return
5.2%
Cap rate
0.6%
Rent to Value Ratio
Active
$188,500
2
bds
|
2
ba
|
962
sqft
|
built
1988
6652 Sundown Dr S, Indianapolis, IN 46254
$117
Cash flow
3.2%
Cash-on-Cash Return
6.9%
Cap rate
0.8%
Rent to Value Ratio
Active
$275,000
3
bds
|
3
ba
|
1,637
sqft
|
built
1996
6154 Tybalt Cir, Indianapolis, IN 46254
$-54
Cash flow
-1.0%
Cash-on-Cash Return
5.9%
Cap rate
0.7%
Rent to Value Ratio
Active
$230,000
3
bds
|
3
ba
|
1,759
sqft
|
built
1999
4363 Fullwood Ct, Indianapolis, IN 46254
$64
Cash flow
1.5%
Cash-on-Cash Return
6.5%
Cap rate
0.8%
Rent to Value Ratio
Active
$180,900
3
bds
|
3
ba
|
1,446
sqft
|
built
1999
4665 Falcon Run Way, Indianapolis, IN 46254
$246
Cash flow
7.1%
Cash-on-Cash Return
7.8%
Cap rate
0.9%
Rent to Value Ratio
Active
$210,000
2
bds
|
2
ba
|
1,304
sqft
|
built
1996
5358 Spring Creek Cir, Indianapolis, IN 46254
$121
Cash flow
3.0%
Cash-on-Cash Return
6.8%
Cap rate
0.9%
Rent to Value Ratio
Active
$130,000
2
bds
|
2
ba
|
983
sqft
|
built
1987
4291 Village Parkway Cir W, Indianapolis, IN 46254
$13
Cash flow
0.5%
Cash-on-Cash Return
6.3%
Cap rate
1.1%
Rent to Value Ratio
Active
$309,900
3
bds
|
3
ba
|
2,200
sqft
|
built
1997
4223 Kestrel Ct, Indianapolis, IN 46254
$-31
Cash flow
-0.5%
Cash-on-Cash Return
6.0%
Cap rate
0.7%
Rent to Value Ratio
Active
$150,000
3
bds
|
2
ba
|
1,315
sqft
|
built
1973
4714 Lynton Ct, Indianapolis, IN 46254
$78
Cash flow
2.7%
Cash-on-Cash Return
6.8%
Cap rate
1.1%
Rent to Value Ratio
Active
$160,000
2
bds
|
2
ba
|
1,205
sqft
|
built
1995
5928 Racine Ln, Indianapolis, IN 46254
$-50
Cash flow
-1.6%
Cash-on-Cash Return
5.8%
Cap rate
0.9%
Rent to Value Ratio
Active
$230,000
3
bds
|
3
ba
|
1,440
sqft
|
built
2002
4315 Village Bend Ct, Indianapolis, IN 46254
$39
Cash flow
0.9%
Cash-on-Cash Return
6.3%
Cap rate
0.8%
Rent to Value Ratio
Active
$215,000
3
bds
|
2
ba
|
1,046
sqft
|
built
1995
5851 Brobeck Ln, Indianapolis, IN 46254
$47
Cash flow
1.1%
Cash-on-Cash Return
6.4%
Cap rate
0.8%
Rent to Value Ratio
Active
$159,900
2
bds
|
2
ba
|
1,061
sqft
|
built
1973
4408 Clovelly Ct, Indianapolis, IN 46254
$-42
Cash flow
-1.4%
Cash-on-Cash Return
5.8%
Cap rate
0.9%
Rent to Value Ratio
Active
$225,000
2
bds
|
2
ba
|
1,172
sqft
|
built
1988
4106 Eagle Cove West Dr, Indianapolis, IN 46254
$-131
Cash flow
-3.0%
Cash-on-Cash Return
5.5%
Cap rate
0.8%
Rent to Value Ratio
Active
$254,900
3
bds
|
2
ba
|
1,229
sqft
|
built
1999
5102 Pike Creek Ln, Indianapolis, IN 46254
$-64
Cash flow
-1.3%
Cash-on-Cash Return
5.8%
Cap rate
0.7%
Rent to Value Ratio
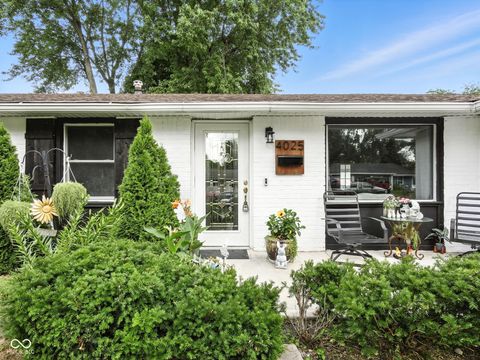
Active
$245,000
4
bds
|
3
ba
|
1,733
sqft
|
built
1965
4025 Sherlock Dr, Indianapolis, IN 46254
$-151
Cash flow
-3.2%
Cash-on-Cash Return
5.4%
Cap rate
0.7%
Rent to Value Ratio
Active
$235,000
2
bds
|
2
ba
|
1,260
sqft
|
built
1987
7428 Charrington Ct, Indianapolis, IN 46254
$-194
Cash flow
-4.3%
Cash-on-Cash Return
5.2%
Cap rate
0.9%
Rent to Value Ratio
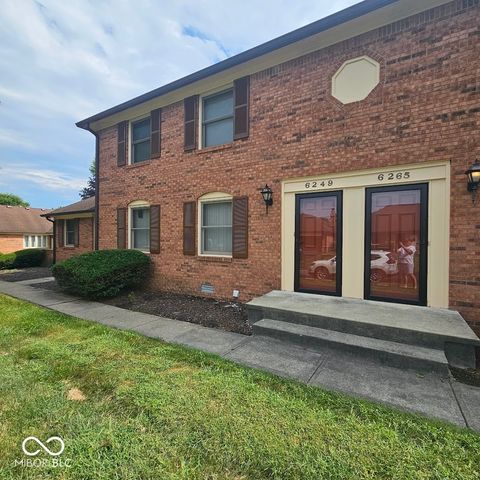
Active
$145,000
2
bds
|
2
ba
|
1,188
sqft
|
built
1981
6249 Apache Dr, Indianapolis, IN 46254
$12
Cash flow
0.4%
Cash-on-Cash Return
6.2%
Cap rate
1.0%
Rent to Value Ratio
Active
$239,900
3
bds
|
2
ba
|
1,196
sqft
|
built
1998
5903 Brookville Lake Dr, Indianapolis, IN 46254
$-18
Cash flow
-0.4%
Cash-on-Cash Return
6.1%
Cap rate
0.8%
Rent to Value Ratio
Active
$250,000
3
bds
|
2
ba
|
1,258
sqft
|
built
1984
6772 Coatbridge Cir, Indianapolis, IN 46254
$30
Cash flow
0.6%
Cash-on-Cash Return
6.3%
Cap rate
0.8%
Rent to Value Ratio
Active
$250,000
3
bds
|
3
ba
|
1,546
sqft
|
built
1990
5648 Hyacinth Way, Indianapolis, IN 46254
$-79
Cash flow
-1.6%
Cash-on-Cash Return
5.8%
Cap rate
0.7%
Rent to Value Ratio
Active
$255,000
2
bds
|
3
ba
|
1,549
sqft
|
built
1983
4740 Pennington Ct, Indianapolis, IN 46254
$-321
Cash flow
-6.6%
Cash-on-Cash Return
4.6%
Cap rate
0.8%
Rent to Value Ratio
Active
$169,900
2
bds
|
3
ba
|
1,390
sqft
|
built
1988
5370 Bay Harbor Dr, Indianapolis, IN 46254
$39
Cash flow
1.2%
Cash-on-Cash Return
6.4%
Cap rate
0.9%
Rent to Value Ratio
Active
$224,900
2
bds
|
2
ba
|
992
sqft
|
built
1987
5855 Petersen Ct, Indianapolis, IN 46254
$64
Cash flow
1.5%
Cash-on-Cash Return
6.5%
Cap rate
0.8%
Rent to Value Ratio
Active
$273,500
3
bds
|
3
ba
|
1,730
sqft
|
built
1991
5814 Lakefield Dr, Indianapolis, IN 46254
$104
Cash flow
2.0%
Cash-on-Cash Return
6.6%
Cap rate
0.8%
Rent to Value Ratio