46256 Investment Properties for Sale
Browse homes for sale and investment properties in 46256. Refine your search by price, property type, or more.
Best cash flowing properties in 46256
Active
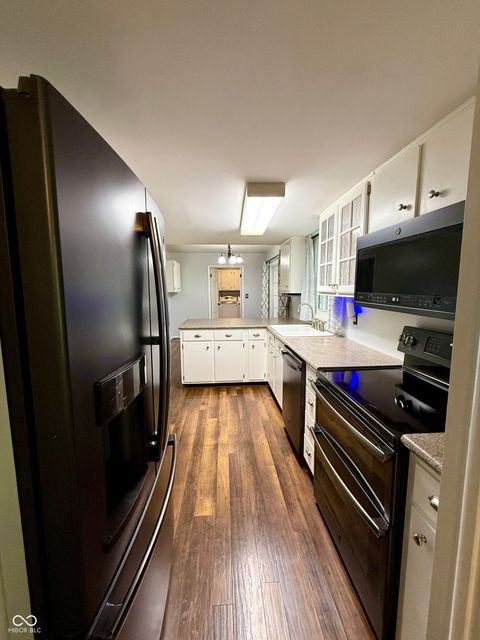
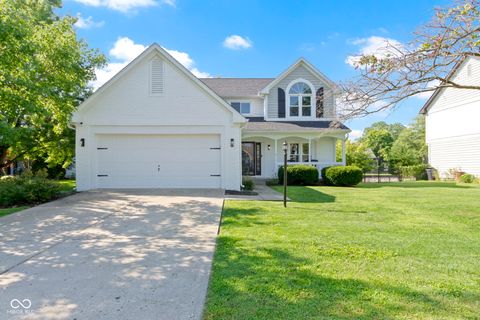
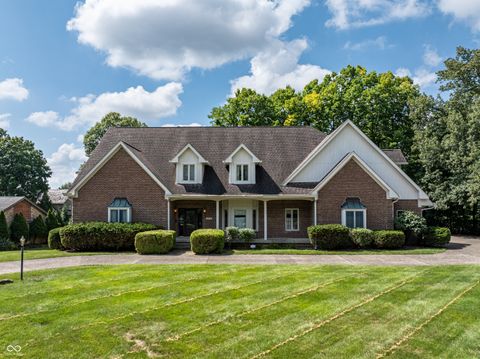
$218,700
3
bds
|
4
ba
|
1,716
sqft
|
built
1983
8054 Harvest Ln, Indianapolis, IN 46256
$398
Cash flow
9.5%
Cash-on-Cash Return
8.3%
Cap rate
1.0%
Rent to Value Ratio
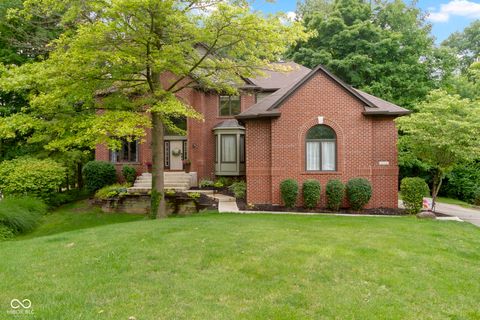
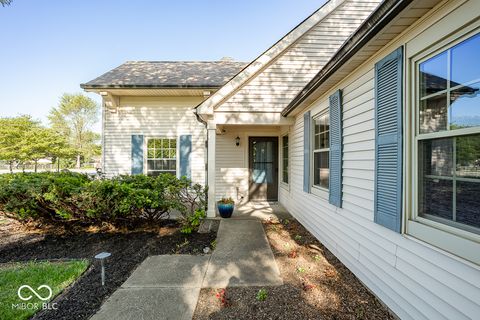
Active
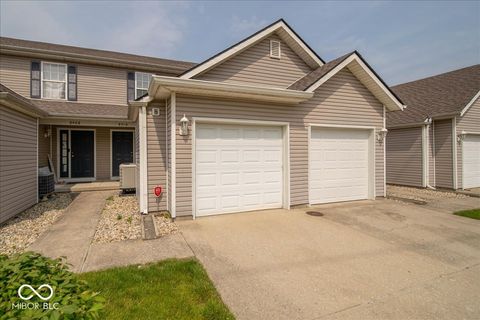
$264,900
3
bds
|
3
ba
|
1,844
sqft
|
built
1996
7530 Redcliff Rd, Indianapolis, IN 46256
$207
Cash flow
4.1%
Cash-on-Cash Return
7.1%
Cap rate
0.9%
Rent to Value Ratio
36 out of 38 properties for sale in 46256
Limited Results Shown
Create a free account, or log in to reveal all property listings and enjoy the complete experience.
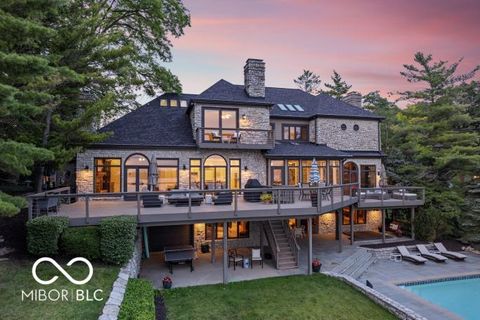
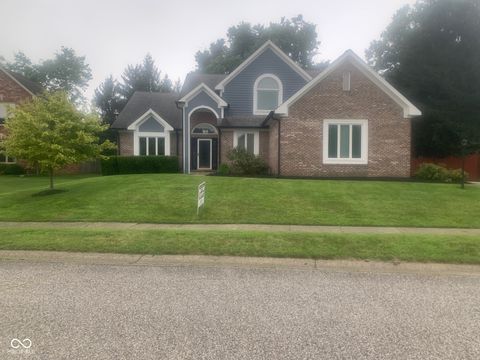
Active
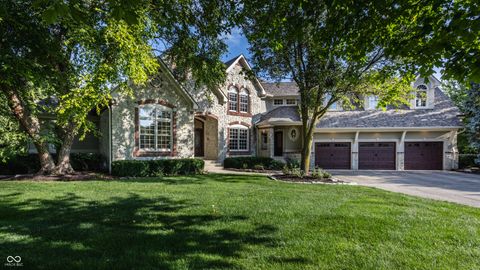
$1,479,900
4
bds
|
4
ba
|
4,228
sqft
|
built
1984
8613 Seaward Ln, Indianapolis, IN 46256
$-4,451
Cash flow
-15.7%
Cash-on-Cash Return
2.5%
Cap rate
0.3%
Rent to Value Ratio
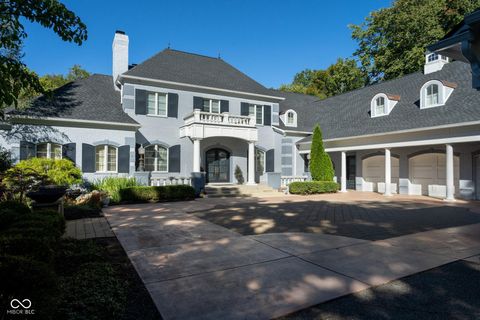
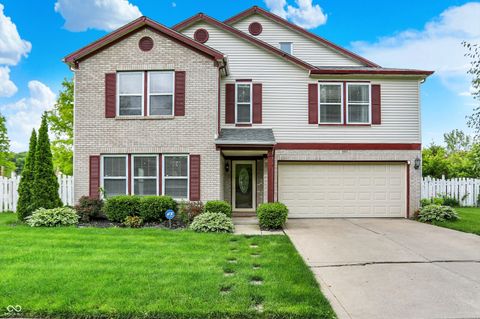
Active
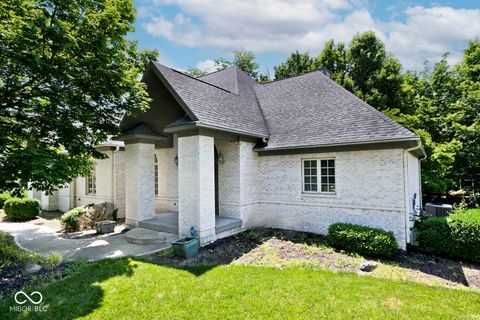
$699,000
4
bds
|
4
ba
|
4,014
sqft
|
built
1989
9604 Hamburg Ct, Indianapolis, IN 46256
$-1,477
Cash flow
-11.0%
Cash-on-Cash Return
3.6%
Cap rate
0.4%
Rent to Value Ratio
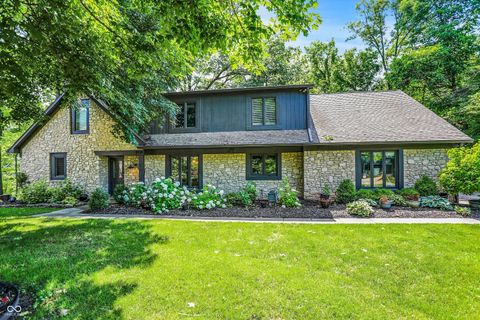
Active
$335,000
4
bds
|
3
ba
|
2,072
sqft
|
built
1969
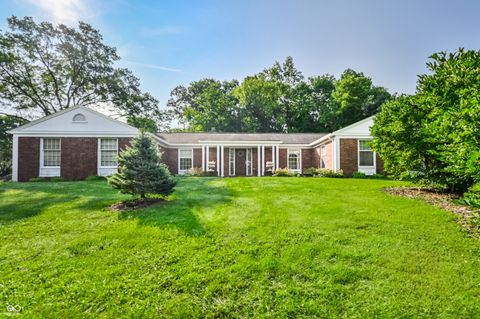
9321 E 82nd St, Indianapolis, IN 46256
$-198
Cash flow
-3.1%
Cash-on-Cash Return
5.4%
Cap rate
0.7%
Rent to Value Ratio
Active
$845,000
5
bds
|
4
ba
|
4,598
sqft
|
built
1995
12214 Ridgeside Rd, Indianapolis, IN 46256
$-1,433
Cash flow
-8.8%
Cash-on-Cash Return
4.1%
Cap rate
0.5%
Rent to Value Ratio
Active
$2,350,000
5
bds
|
5
ba
|
7,705
sqft
|
built
1988
11715 Landings Dr, Indianapolis, IN 46256
$-7,804
Cash flow
-17.3%
Cash-on-Cash Return
2.2%
Cap rate
0.3%
Rent to Value Ratio
Active
$2,150,000
5
bds
|
6
ba
|
10,675
sqft
|
built
2005
8358 Hidden Point Dr, Indianapolis, IN 46256
$-6,708
Cash flow
-16.3%
Cash-on-Cash Return
2.4%
Cap rate
0.3%
Rent to Value Ratio

Active
$429,000
3
bds
|
3
ba
|
3,424
sqft
|
built
1968
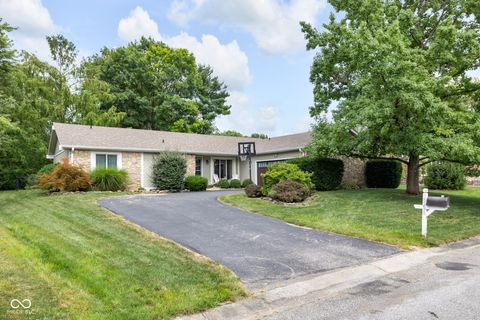
7029 Kingswood Cir, Indianapolis, IN 46256
$-84
Cash flow
-1.0%
Cash-on-Cash Return
5.9%
Cap rate
0.7%
Rent to Value Ratio
Active
$374,999
3
bds
|
3
ba
|
2,034
sqft
|
built
1989
10543 Marlin Ct, Indianapolis, IN 46256
$-72
Cash flow
-1.0%
Cash-on-Cash Return
5.9%
Cap rate
0.7%
Rent to Value Ratio
Active
$880,000
4
bds
|
5
ba
|
5,199
sqft
|
built
1972
9236 Kinlock Dr, Indianapolis, IN 46256
$-1,748
Cash flow
-10.4%
Cash-on-Cash Return
3.8%
Cap rate
0.5%
Rent to Value Ratio
Active
$800,000
3
bds
|
4
ba
|
2,766
sqft
|
built
1988
6902 Creekridge Trl, Indianapolis, IN 46256
$-648
Cash flow
-4.2%
Cash-on-Cash Return
5.2%
Cap rate
0.6%
Rent to Value Ratio

Active
$294,900
5
bds
|
3
ba
|
1,826
sqft
|
built
1988
8075 Cardinal Cv E, Indianapolis, IN 46256
$-62
Cash flow
-1.1%
Cash-on-Cash Return
5.9%
Cap rate
0.7%
Rent to Value Ratio
Active
$615,000
4
bds
|
4
ba
|
3,756
sqft
|
built
1981
9111 Sand Key Ln, Indianapolis, IN 46256
$-1,262
Cash flow
-10.7%
Cash-on-Cash Return
3.7%
Cap rate
0.5%
Rent to Value Ratio
Active
$365,000
4
bds
|
3
ba
|
3,641
sqft
|
built
1973
7038 E 65th St, Indianapolis, IN 46256
$-158
Cash flow
-2.3%
Cash-on-Cash Return
5.6%
Cap rate
0.7%
Rent to Value Ratio
Active
$399,000
3
bds
|
3
ba
|
1,670
sqft
|
built
1960
7802 Fall Creek Rd, Indianapolis, IN 46256
$-664
Cash flow
-8.7%
Cash-on-Cash Return
4.2%
Cap rate
0.5%
Rent to Value Ratio
Active
$342,500
5
bds
|
3
ba
|
3,072
sqft
|
built
1962
6632 Sargent Rd, Indianapolis, IN 46256
$40
Cash flow
0.6%
Cash-on-Cash Return
6.3%
Cap rate
0.8%
Rent to Value Ratio
Active
$374,900
3
bds
|
2
ba
|
1,823
sqft
|
built
1989
8807 Saddle Ct, Indianapolis, IN 46256
$-451
Cash flow
-6.3%
Cash-on-Cash Return
4.7%
Cap rate
0.6%
Rent to Value Ratio
Active
$290,000
2
bds
|
2
ba
|
1,238
sqft
|
built
1984
7650 Micawber Ct, Indianapolis, IN 46256
$-141
Cash flow
-2.5%
Cash-on-Cash Return
5.6%
Cap rate
0.7%
Rent to Value Ratio

Active
$287,500
3
bds
|
2
ba
|
1,524
sqft
|
built
1994
7450 Deville Ct, Indianapolis, IN 46256
$-103
Cash flow
-1.9%
Cash-on-Cash Return
5.7%
Cap rate
0.7%
Rent to Value Ratio
Active
$449,000
3
bds
|
3
ba
|
2,828
sqft
|
built
1995
9532 Pinecreek Dr, Indianapolis, IN 46256
$-600
Cash flow
-7.0%
Cash-on-Cash Return
4.5%
Cap rate
0.6%
Rent to Value Ratio
Active
$365,000
5
bds
|
3
ba
|
3,898
sqft
|
built
1999
9001 Harrison Run Ct, Indianapolis, IN 46256
$29
Cash flow
0.4%
Cash-on-Cash Return
6.2%
Cap rate
0.8%
Rent to Value Ratio
Active
$725,000
5
bds
|
5
ba
|
4,924
sqft
|
built
1981
8924 Stormhaven Ct, Indianapolis, IN 46256
$-377
Cash flow
-2.7%
Cash-on-Cash Return
5.5%
Cap rate
0.7%
Rent to Value Ratio
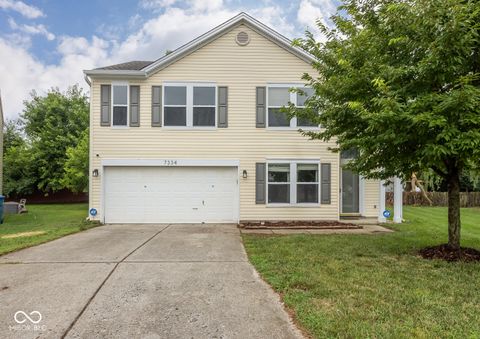
Active
$305,000
3
bds
|
3
ba
|
2,090
sqft
|
built
1997
7334 Sedgewick Way, Indianapolis, IN 46256
$-44
Cash flow
-0.8%
Cash-on-Cash Return
6.0%
Cap rate
0.7%
Rent to Value Ratio
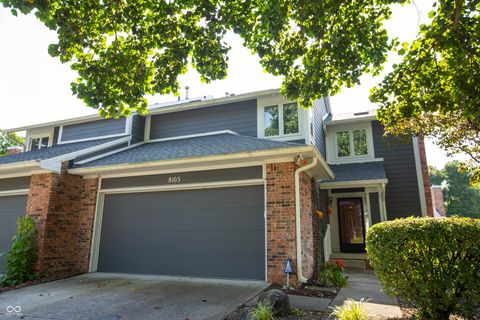
Active
$259,900
2
bds
|
3
ba
|
1,379
sqft
|
built
1984
8105 Foxchase Dr, Indianapolis, IN 46256
$-266
Cash flow
-5.3%
Cash-on-Cash Return
4.9%
Cap rate
0.8%
Rent to Value Ratio
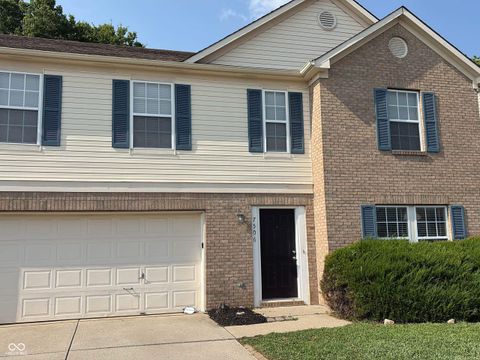
Active
$225,000
2
bds
|
1
ba
|
945
sqft
|
built
1988
9016 Lisering Cir, Indianapolis, IN 46256
$-212
Cash flow
-4.9%
Cash-on-Cash Return
5.0%
Cap rate
0.7%
Rent to Value Ratio
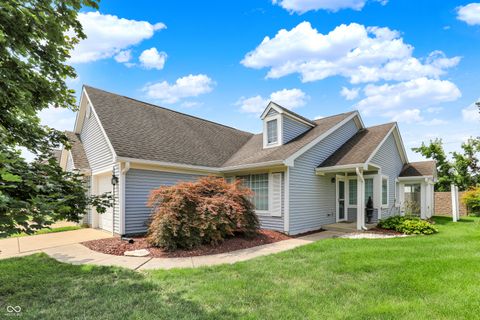
Active
$316,000
3
bds
|
3
ba
|
2,404
sqft
|
built
1997
7506 Redcliff Rd, Indianapolis, IN 46256
$-193
Cash flow
-3.2%
Cash-on-Cash Return
5.4%
Cap rate
0.7%
Rent to Value Ratio
Active
$1,200,000
4
bds
|
5
ba
|
9,580
sqft
|
built
1988
9719 Decatur Dr, Indianapolis, IN 46256
$-2,741
Cash flow
-11.9%
Cash-on-Cash Return
3.4%
Cap rate
0.4%
Rent to Value Ratio
Active
$189,500
3
bds
|
3
ba
|
1,468
sqft
|
built
2000
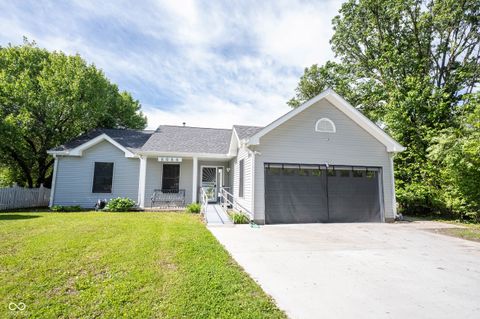
8410 Hague Rd, Indianapolis, IN 46256
$-72
Cash flow
-2.0%
Cash-on-Cash Return
5.7%
Cap rate
0.8%
Rent to Value Ratio
Active
$1,099,900
5
bds
|
6
ba
|
7,136
sqft
|
built
1996
8920 William Penn Cir, Indianapolis, IN 46256
$-3,405
Cash flow
-16.2%
Cash-on-Cash Return
2.4%
Cap rate
0.3%
Rent to Value Ratio
Active
$729,900
4
bds
|
4
ba
|
5,089
sqft
|
built
2000
7844 Timber Run Ct, Indianapolis, IN 46256
$-358
Cash flow
-2.6%
Cash-on-Cash Return
5.6%
Cap rate
0.7%
Rent to Value Ratio
Active
$480,000
3
bds
|
4
ba
|
3,589
sqft
|
built
1961
7039 Lantern Rd, Indianapolis, IN 46256
$-665
Cash flow
-7.2%
Cash-on-Cash Return
4.5%
Cap rate
0.5%
Rent to Value Ratio
Active
$365,000
3
bds
|
3
ba
|
2,284
sqft
|
built
1977
8238 Warbler Way, Indianapolis, IN 46256
$-190
Cash flow
-2.7%
Cash-on-Cash Return
5.5%
Cap rate
0.7%
Rent to Value Ratio
Active
$309,000
3
bds
|
2
ba
|
1,448
sqft
|
built
1989
8066 Cardinal Cv E, Indianapolis, IN 46256
$-231
Cash flow
-3.9%
Cash-on-Cash Return
5.3%
Cap rate
0.6%
Rent to Value Ratio
Active
$365,000
4
bds
|
3
ba
|
2,061
sqft
|
built
1971
7905 Scarborough Blvd South Dr, Indianapolis, IN 46256
$-145
Cash flow
-2.1%
Cash-on-Cash Return
5.7%
Cap rate
0.7%
Rent to Value Ratio
Active
$239,900
3
bds
|
3
ba
|
2,124
sqft
|
built
1981
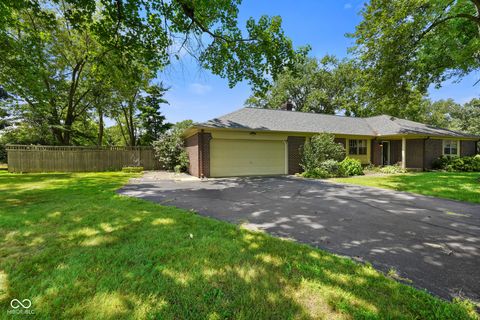
7580 Castleton Farms West Dr, Indianapolis, IN 46256
$-357
Cash flow
-7.8%
Cash-on-Cash Return
4.4%
Cap rate
0.8%
Rent to Value Ratio