46260 Investment Properties for Sale
Browse homes for sale and investment properties in 46260. Refine your search by price, property type, or more.
Best cash flowing properties in 46260
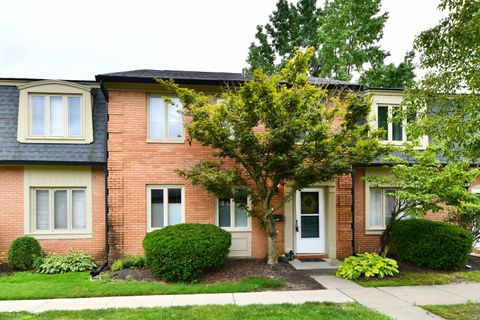
Active
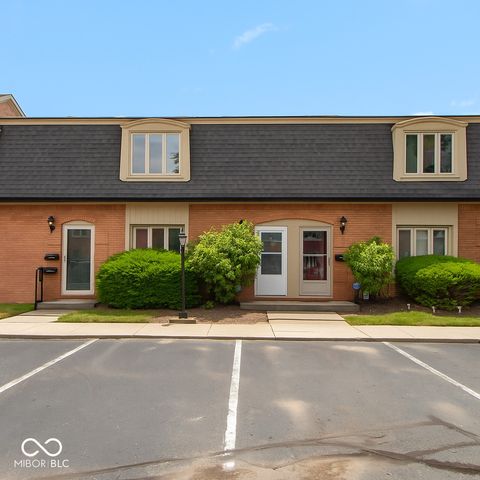
$123,900
2
bds
|
2
ba
|
1,216
sqft
|
built
1966
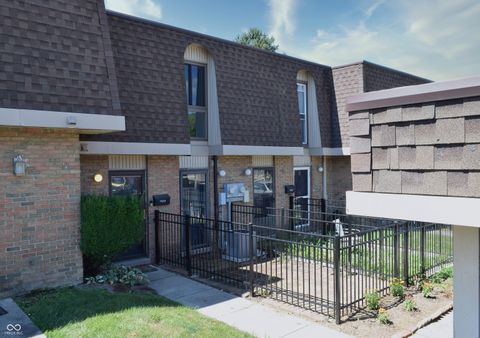
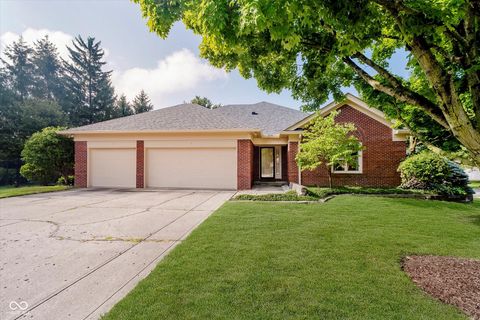
7410 Country Brook Dr, Indianapolis, IN 46260
$113
Cash flow
4.8%
Cash-on-Cash Return
7.2%
Cap rate
1.3%
Rent to Value Ratio
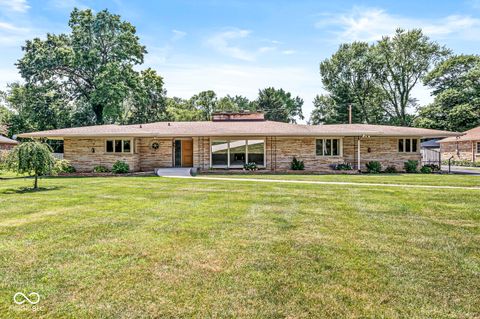
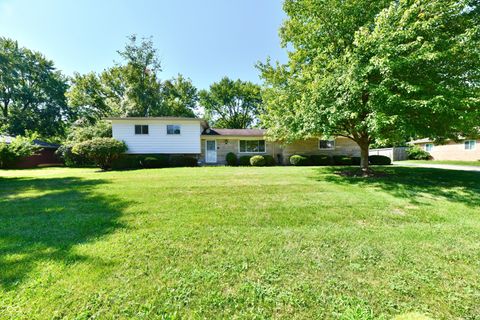
Active
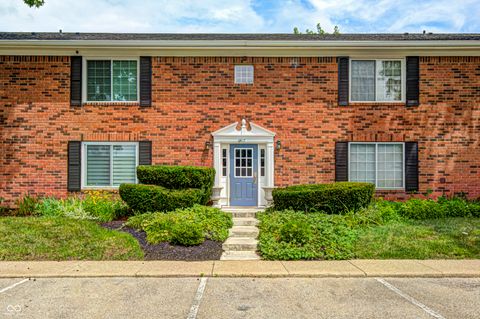
$304,900
3
bds
|
2
ba
|
2,137
sqft
|
built
1963
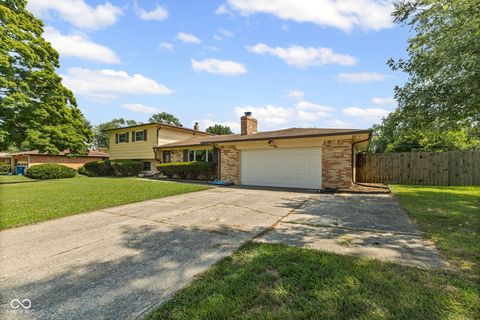
1715 W 63rd St, Indianapolis, IN 46260
$25
Cash flow
0.4%
Cash-on-Cash Return
6.2%
Cap rate
0.8%
Rent to Value Ratio
45 out of 53 properties for sale in 46260
Limited Results Shown
Create a free account, or log in to reveal all property listings and enjoy the complete experience.
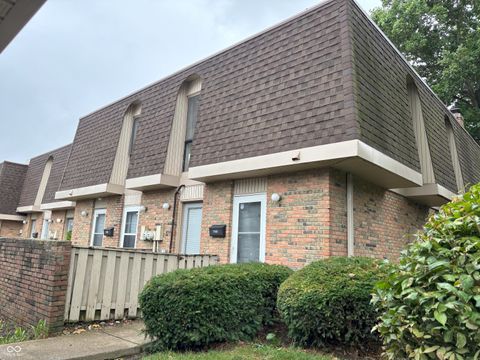
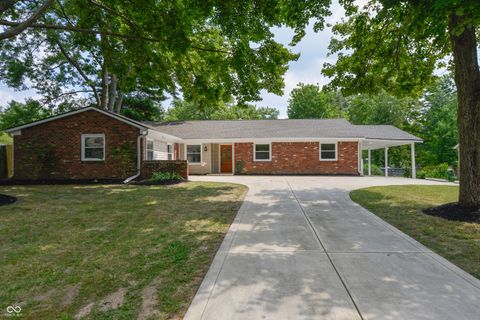
Active
$259,000
2
bds
|
2
ba
|
1,710
sqft
|
built
1989
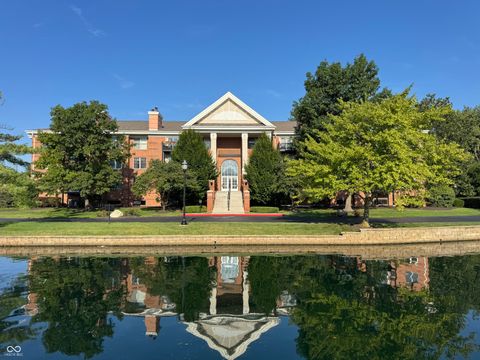
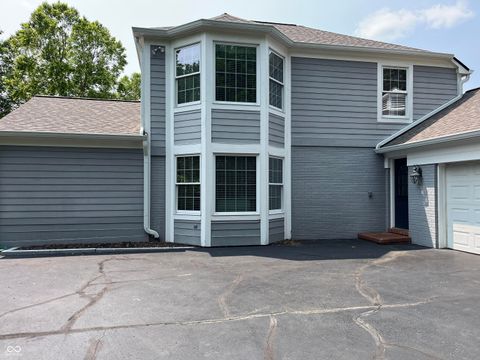
8690 Jaffa Court West Dr, Indianapolis, IN 46260
$-347
Cash flow
-7.0%
Cash-on-Cash Return
4.5%
Cap rate
0.9%
Rent to Value Ratio
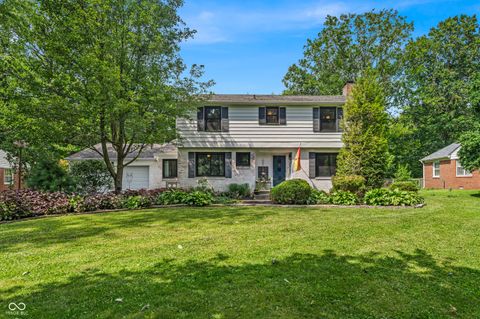
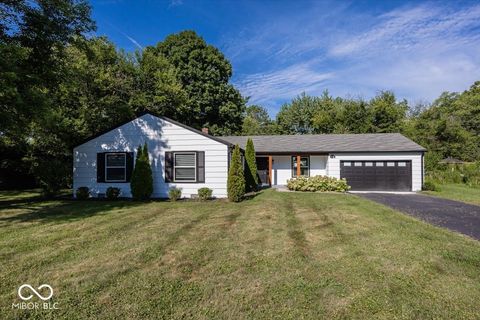
Active
$340,000
4
bds
|
3
ba
|
2,403
sqft
|
built
1977
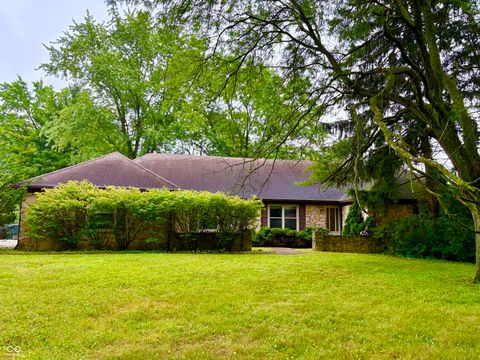
8729 Sawleaf Rd, Indianapolis, IN 46260
$-23
Cash flow
-0.4%
Cash-on-Cash Return
6.1%
Cap rate
0.8%
Rent to Value Ratio
Active
$1,795,000
4
bds
|
6
ba
|
5,669
sqft
|
built
1984
8661 Williamshire West Dr, Indianapolis, IN 46260
$-7,253
Cash flow
-21.1%
Cash-on-Cash Return
1.3%
Cap rate
0.2%
Rent to Value Ratio

Active
$675,000
5
bds
|
4
ba
|
3,932
sqft
|
built
1991
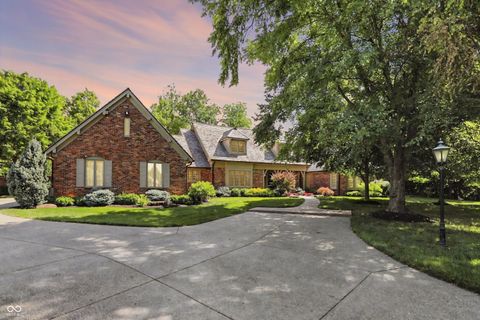
138 Fairway Dr, Indianapolis, IN 46260
$-1,043
Cash flow
-8.1%
Cash-on-Cash Return
4.3%
Cap rate
0.5%
Rent to Value Ratio

Active
$650,000
3
bds
|
4
ba
|
5,213
sqft
|
built
1965
9420 N Kenwood Ave, Indianapolis, IN 46260
$-156
Cash flow
-1.3%
Cash-on-Cash Return
5.9%
Cap rate
0.7%
Rent to Value Ratio

Active
$379,999
3
bds
|
3
ba
|
2,070
sqft
|
built
1960
7118 Mikesell Dr, Indianapolis, IN 46260
$-567
Cash flow
-7.8%
Cash-on-Cash Return
4.4%
Cap rate
0.5%
Rent to Value Ratio
Active
$295,000
3
bds
|
2
ba
|
2,160
sqft
|
built
1960
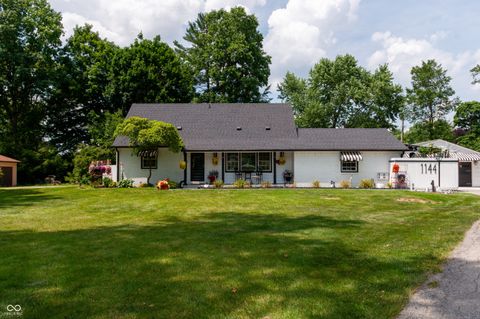
1144 W 73rd St, Indianapolis, IN 46260
$-62
Cash flow
-1.1%
Cash-on-Cash Return
5.9%
Cap rate
0.7%
Rent to Value Ratio
Active
$239,900
3
bds
|
2
ba
|
1,633
sqft
|
built
1985
2203 Oak Run Pl, Indianapolis, IN 46260
$-159
Cash flow
-3.5%
Cash-on-Cash Return
5.4%
Cap rate
0.8%
Rent to Value Ratio
Active
$359,900
2
bds
|
2
ba
|
1,773
sqft
|
built
1986
9263 Spring Forest Dr, Indianapolis, IN 46260
$-1,082
Cash flow
-15.7%
Cash-on-Cash Return
2.5%
Cap rate
0.6%
Rent to Value Ratio
Active
$149,900
2
bds
|
2
ba
|
1,254
sqft
|
built
1965
1131 Canterbury Sq S, Indianapolis, IN 46260
$0
Cash flow
0.0%
Cash-on-Cash Return
6.1%
Cap rate
1.1%
Rent to Value Ratio

Active
$698,000
3
bds
|
3
ba
|
2,572
sqft
|
built
1985
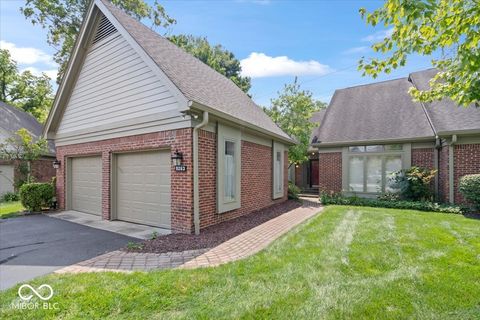
958 Tamarack Circle North Dr, Indianapolis, IN 46260
$-1,600
Cash flow
-12.0%
Cash-on-Cash Return
3.4%
Cap rate
0.5%
Rent to Value Ratio

Active
$225,000
2
bds
|
2
ba
|
1,620
sqft
|
built
1989
8651 Jaffa Court East Dr, Indianapolis, IN 46260
$-213
Cash flow
-4.9%
Cash-on-Cash Return
5.0%
Cap rate
1.0%
Rent to Value Ratio
Active
$105,000
2
bds
|
2
ba
|
1,485
sqft
|
built
1973
6417 Park Central Dr W, Indianapolis, IN 46260
$6
Cash flow
0.3%
Cash-on-Cash Return
6.2%
Cap rate
1.4%
Rent to Value Ratio
Active
$114,900
2
bds
|
1
ba
|
1,216
sqft
|
built
1966
7480 Country Brook Dr, Indianapolis, IN 46260
$9
Cash flow
0.4%
Cash-on-Cash Return
6.2%
Cap rate
1.2%
Rent to Value Ratio
Active
$400,000
4
bds
|
3
ba
|
2,375
sqft
|
built
1956
926 Oakwood Trl, Indianapolis, IN 46260
$-117
Cash flow
-1.5%
Cash-on-Cash Return
5.8%
Cap rate
0.7%
Rent to Value Ratio
Active
$475,000
4
bds
|
4
ba
|
3,546
sqft
|
built
1986
9321 Spring Forest Dr, Indianapolis, IN 46260
$-1,326
Cash flow
-14.6%
Cash-on-Cash Return
2.8%
Cap rate
0.5%
Rent to Value Ratio
Active
$294,900
3
bds
|
3
ba
|
2,377
sqft
|
built
1965
6321 Wood Knoll Ln, Indianapolis, IN 46260
$-131
Cash flow
-2.3%
Cash-on-Cash Return
5.6%
Cap rate
0.7%
Rent to Value Ratio
Active
$290,000
3
bds
|
2
ba
|
1,380
sqft
|
built
1964
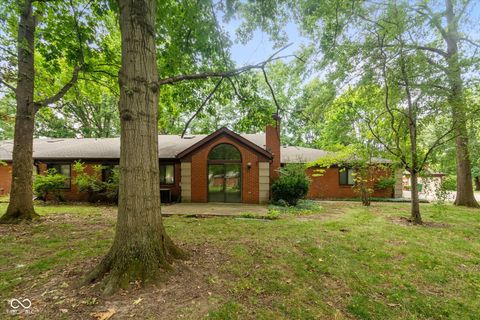
1208 W 79th St, Indianapolis, IN 46260
$-106
Cash flow
-1.9%
Cash-on-Cash Return
5.7%
Cap rate
0.7%
Rent to Value Ratio
Active
$749,000
5
bds
|
3
ba
|
3,540
sqft
|
built
1957
1537 Greer Dell Rd, Indianapolis, IN 46260
$-2,733
Cash flow
-19.0%
Cash-on-Cash Return
1.8%
Cap rate
0.2%
Rent to Value Ratio
Active
$549,000
3
bds
|
3
ba
|
2,306
sqft
|
built
1956
6630 Spring Mill Rd, Indianapolis, IN 46260
$-1,087
Cash flow
-10.3%
Cash-on-Cash Return
3.8%
Cap rate
0.5%
Rent to Value Ratio
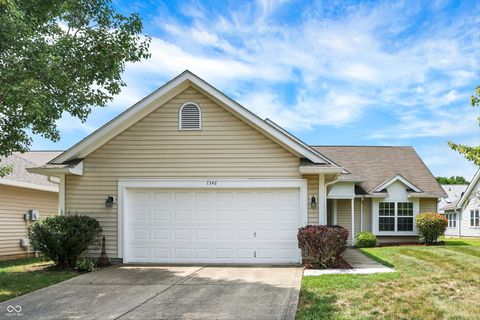
Active
$264,900
3
bds
|
2
ba
|
1,669
sqft
|
built
1997
7346 Brackenwood Dr, Indianapolis, IN 46260
$-294
Cash flow
-5.8%
Cash-on-Cash Return
4.8%
Cap rate
0.8%
Rent to Value Ratio
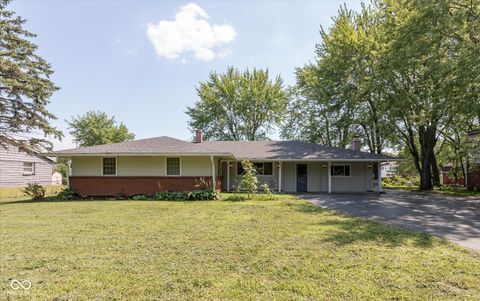
Active
$295,000
4
bds
|
2
ba
|
2,178
sqft
|
built
1964
1607 W 79th St, Indianapolis, IN 46260
$7
Cash flow
0.1%
Cash-on-Cash Return
6.2%
Cap rate
0.7%
Rent to Value Ratio
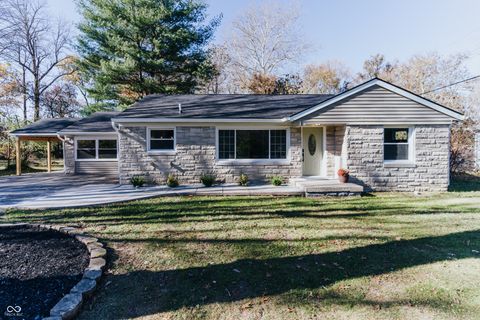
Active
$299,000
3
bds
|
2
ba
|
1,524
sqft
|
built
1954
6530 N Tremont St, Indianapolis, IN 46260
$-428
Cash flow
-7.5%
Cash-on-Cash Return
4.4%
Cap rate
0.5%
Rent to Value Ratio
Active
$235,000
2
bds
|
2
ba
|
1,620
sqft
|
built
2001
8690 Jaffa Court West Dr, Indianapolis, IN 46260
$-399
Cash flow
-8.9%
Cash-on-Cash Return
4.1%
Cap rate
0.9%
Rent to Value Ratio
Active
$406,000
4
bds
|
3
ba
|
2,483
sqft
|
built
1968
1650 Lancaster Ct, Indianapolis, IN 46260
$-410
Cash flow
-5.3%
Cash-on-Cash Return
4.9%
Cap rate
0.6%
Rent to Value Ratio
Active
$265,000
2
bds
|
2
ba
|
1,441
sqft
|
built
1986
2078 Oak Run North Dr, Indianapolis, IN 46260
$-287
Cash flow
-5.7%
Cash-on-Cash Return
4.8%
Cap rate
0.8%
Rent to Value Ratio
Active
$549,900
2
bds
|
3
ba
|
2,140
sqft
|
built
1987
8648 Cricket Tree Ln, Indianapolis, IN 46260
$-1,354
Cash flow
-12.8%
Cash-on-Cash Return
3.2%
Cap rate
0.5%
Rent to Value Ratio
Active
$178,000
3
bds
|
3
ba
|
1,776
sqft
|
built
1965
1113 Canterbury Sq S, Indianapolis, IN 46260
$-191
Cash flow
-5.6%
Cash-on-Cash Return
4.9%
Cap rate
1.0%
Rent to Value Ratio
Active
$299,999
3
bds
|
3
ba
|
2,005
sqft
|
built
1963
1637 Sanwela Dr, Indianapolis, IN 46260
$-157
Cash flow
-2.7%
Cash-on-Cash Return
5.5%
Cap rate
0.7%
Rent to Value Ratio
Active
$350,000
5
bds
|
2
ba
|
2,354
sqft
|
built
1961
7525 Dorothy Dr, Indianapolis, IN 46260
$-413
Cash flow
-6.2%
Cash-on-Cash Return
4.7%
Cap rate
0.6%
Rent to Value Ratio
Active
$369,900
3
bds
|
2
ba
|
1,632
sqft
|
built
1964
8650 Holliday Dr, Indianapolis, IN 46260
$-653
Cash flow
-9.2%
Cash-on-Cash Return
4.0%
Cap rate
0.5%
Rent to Value Ratio
Active
$1,350,000
5
bds
|
5
ba
|
5,141
sqft
|
built
2010
7599 N Meridian St, Indianapolis, IN 46260
$-2,430
Cash flow
-9.4%
Cash-on-Cash Return
4.0%
Cap rate
0.5%
Rent to Value Ratio
Active
$499,900
3
bds
|
3
ba
|
2,457
sqft
|
built
1959
450 W 93rd St, Indianapolis, IN 46260
$-629
Cash flow
-6.6%
Cash-on-Cash Return
4.6%
Cap rate
0.6%
Rent to Value Ratio

Active
$849,000
4
bds
|
4
ba
|
3,316
sqft
|
built
1944
8020 N Meridian St, Indianapolis, IN 46260
$-416
Cash flow
-2.6%
Cash-on-Cash Return
5.6%
Cap rate
0.7%
Rent to Value Ratio
Active
$344,900
3
bds
|
4
ba
|
2,134
sqft
|
built
2010
9508 Oakley Dr, Indianapolis, IN 46260
$-163
Cash flow
-2.5%
Cash-on-Cash Return
5.6%
Cap rate
0.7%
Rent to Value Ratio
Active
$327,000
3
bds
|
3
ba
|
2,960
sqft
|
built
1977
1053 Millwood Ct, Indianapolis, IN 46260
$-728
Cash flow
-11.6%
Cash-on-Cash Return
3.5%
Cap rate
0.6%
Rent to Value Ratio
Active
$615,000
4
bds
|
3
ba
|
3,819
sqft
|
built
1988
8649 Cricket Tree Ln, Indianapolis, IN 46260
$-1,066
Cash flow
-9.0%
Cash-on-Cash Return
4.1%
Cap rate
0.6%
Rent to Value Ratio
Active
$950,000
4
bds
|
5
ba
|
4,725
sqft
|
built
1960
9510 Copley Dr, Indianapolis, IN 46260
$-674
Cash flow
-3.7%
Cash-on-Cash Return
5.3%
Cap rate
0.6%
Rent to Value Ratio