46268 Investment Properties for Sale
Browse homes for sale and investment properties in 46268. Refine your search by price, property type, or more.
Best cash flowing properties in 46268
Active
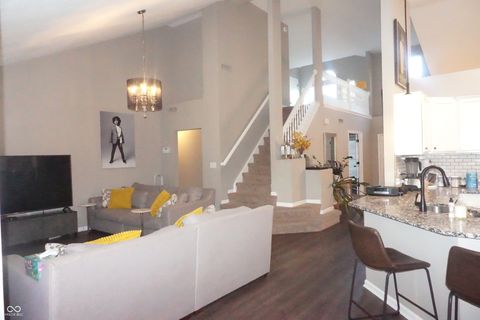
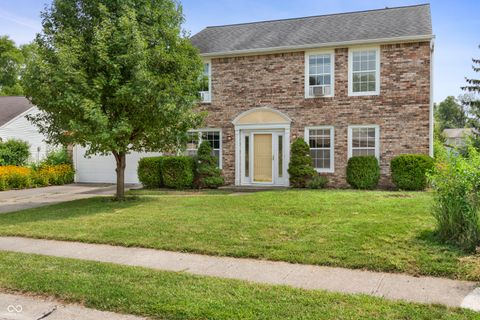
$284,900
3
bds
|
4
ba
|
2,938
sqft
|
built
1993
7260 Bradford Woods Way, Indianapolis, IN 46268
$111
Cash flow
2.0%
Cash-on-Cash Return
6.6%
Cap rate
0.8%
Rent to Value Ratio
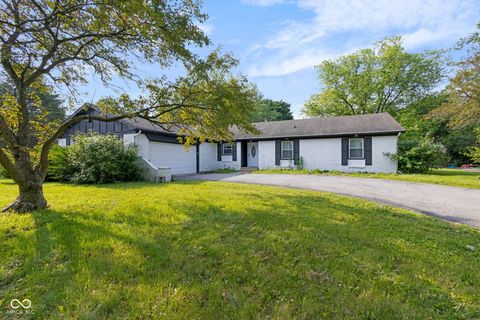
Active
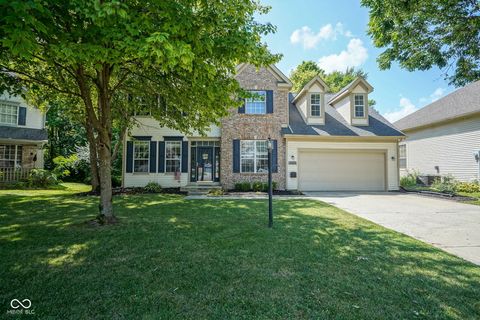
$249,900
3
bds
|
2
ba
|
1,200
sqft
|
built
1998
6485 Hazelhatch Dr, Indianapolis, IN 46268
$100
Cash flow
2.1%
Cash-on-Cash Return
6.6%
Cap rate
0.8%
Rent to Value Ratio
31 out of 34 properties for sale in 46268
Limited Results Shown
Create a free account, or log in to reveal all property listings and enjoy the complete experience.
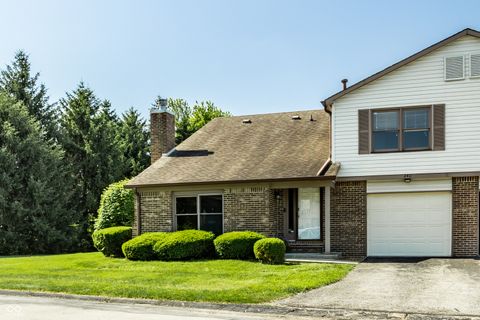
Active
$250,000
3
bds
|
2
ba
|
1,252
sqft
|
built
1999
6640 Chipping Ct, Indianapolis, IN 46268
$-85
Cash flow
-1.8%
Cash-on-Cash Return
5.7%
Cap rate
0.7%
Rent to Value Ratio
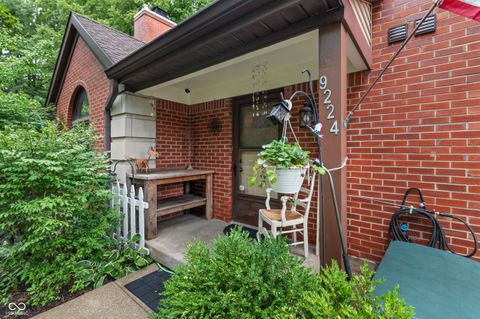
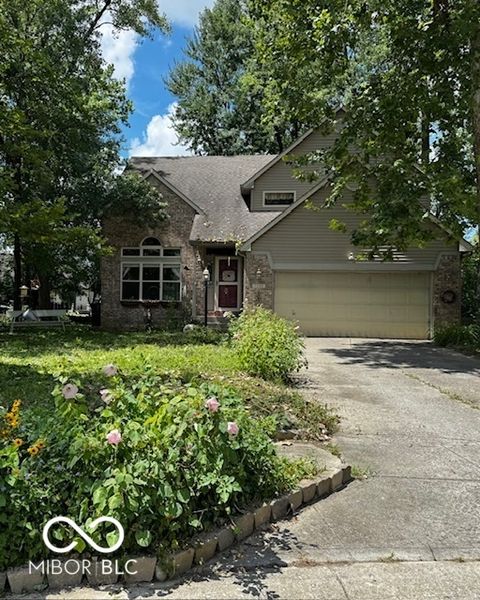
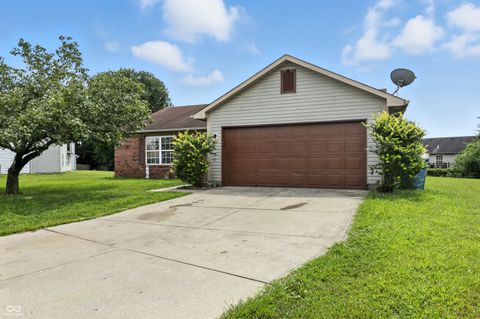
Active
$245,000
2
bds
|
3
ba
|
1,489
sqft
|
built
1984
9224 Golden Woods Dr, Indianapolis, IN 46268
$-146
Cash flow
-3.1%
Cash-on-Cash Return
5.4%
Cap rate
0.8%
Rent to Value Ratio
Active
$220,000
2
bds
|
2
ba
|
1,632
sqft
|
built
1974
2855 Jamieson Ln, Indianapolis, IN 46268
$-61
Cash flow
-1.4%
Cash-on-Cash Return
5.8%
Cap rate
0.9%
Rent to Value Ratio
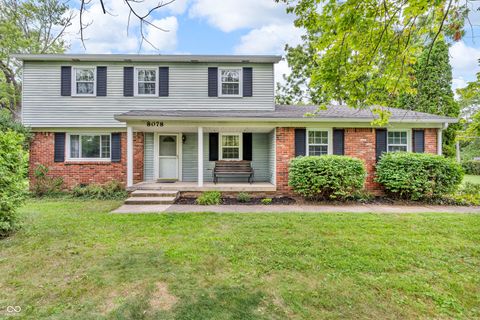
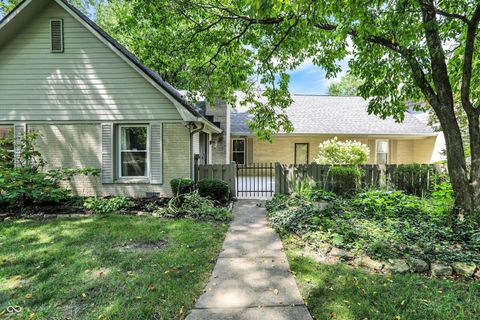
Active
$315,000
5
bds
|
3
ba
|
2,258
sqft
|
built
1969
8078 Charlecot Dr, Indianapolis, IN 46268
$-96
Cash flow
-1.6%
Cash-on-Cash Return
5.8%
Cap rate
0.7%
Rent to Value Ratio
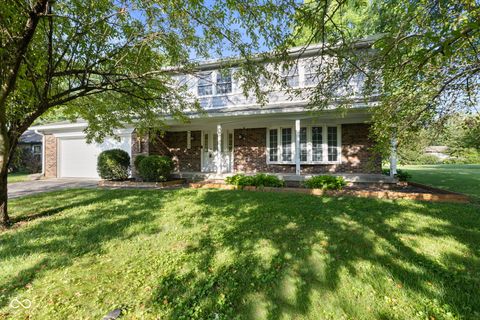
Active
$335,000
3
bds
|
2
ba
|
2,343
sqft
|
built
1972
3039 Amherst St, Indianapolis, IN 46268
$-182
Cash flow
-2.8%
Cash-on-Cash Return
5.5%
Cap rate
0.7%
Rent to Value Ratio
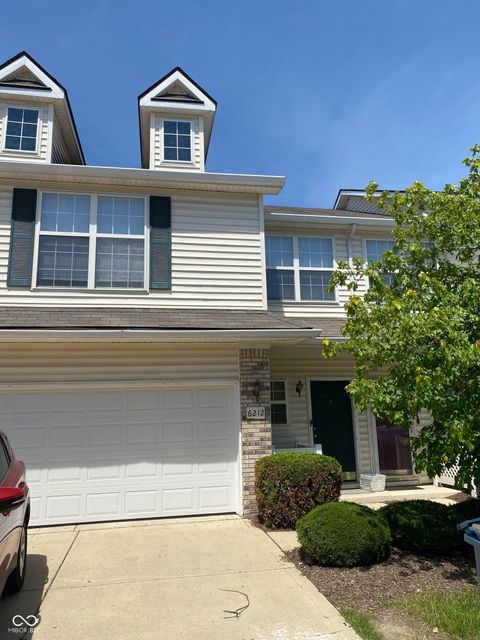
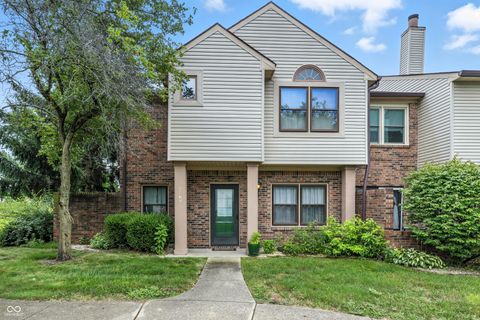
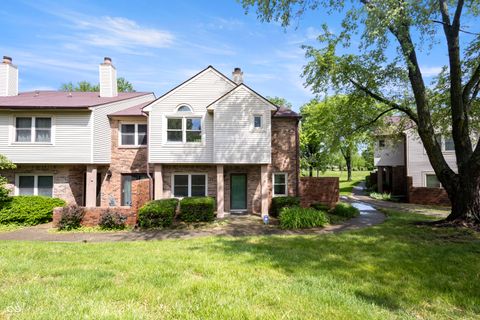
Active
$217,900
3
bds
|
3
ba
|
1,829
sqft
|
built
2007
6212 Bishops Pond Ln, Indianapolis, IN 46268
$-24
Cash flow
-0.6%
Cash-on-Cash Return
6.0%
Cap rate
0.8%
Rent to Value Ratio
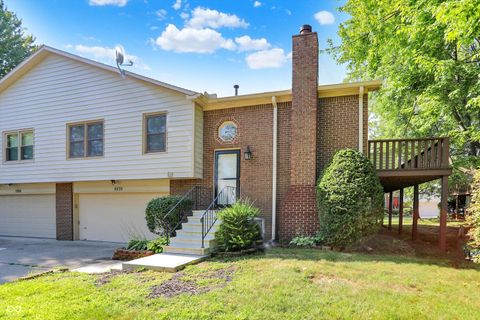
Active
$299,000
4
bds
|
3
ba
|
1,934
sqft
|
built
1974
9028 Colgate St, Indianapolis, IN 46268
$5
Cash flow
0.1%
Cash-on-Cash Return
6.2%
Cap rate
0.8%
Rent to Value Ratio
Active
$385,000
4
bds
|
3
ba
|
2,975
sqft
|
built
1994
6465 Robinsrock Dr, Indianapolis, IN 46268
$-300
Cash flow
-4.1%
Cash-on-Cash Return
5.2%
Cap rate
0.6%
Rent to Value Ratio
Active
$255,000
2
bds
|
2
ba
|
1,258
sqft
|
built
1995
6332 Twin Creeks Dr, Indianapolis, IN 46268
$-93
Cash flow
-1.9%
Cash-on-Cash Return
5.7%
Cap rate
0.7%
Rent to Value Ratio
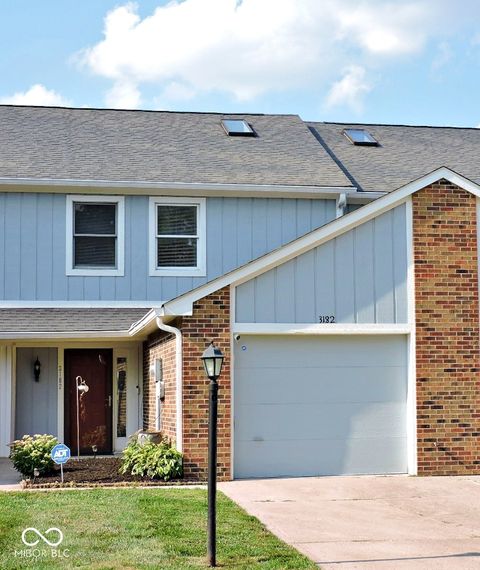
Active
$215,000
2
bds
|
3
ba
|
1,478
sqft
|
built
1986
3182 Sandpiper South Dr, Indianapolis, IN 46268
$-89
Cash flow
-2.2%
Cash-on-Cash Return
5.6%
Cap rate
0.8%
Rent to Value Ratio
Active
$344,900
3
bds
|
3
ba
|
2,553
sqft
|
built
1999
6422 Hollingsworth Dr, Indianapolis, IN 46268
$-135
Cash flow
-2.0%
Cash-on-Cash Return
5.7%
Cap rate
0.7%
Rent to Value Ratio
Active
$329,000
3
bds
|
2
ba
|
1,890
sqft
|
built
1971
3141 Citadel Ct, Indianapolis, IN 46268
$-355
Cash flow
-5.6%
Cash-on-Cash Return
4.9%
Cap rate
0.6%
Rent to Value Ratio
Active
$192,500
2
bds
|
2
ba
|
1,248
sqft
|
built
1984
2411 N Willow Way, Indianapolis, IN 46268
$-36
Cash flow
-1.0%
Cash-on-Cash Return
5.9%
Cap rate
0.9%
Rent to Value Ratio
Active
$234,900
3
bds
|
2
ba
|
1,264
sqft
|
built
1997
6425 Kirch Ct, Indianapolis, IN 46268
$14
Cash flow
0.3%
Cash-on-Cash Return
6.2%
Cap rate
0.8%
Rent to Value Ratio
Active
$229,900
3
bds
|
3
ba
|
1,406
sqft
|
built
1984
9569 Maple Way, Indianapolis, IN 46268
$-244
Cash flow
-5.5%
Cash-on-Cash Return
4.9%
Cap rate
0.8%
Rent to Value Ratio
Active
$225,000
3
bds
|
3
ba
|
2,124
sqft
|
built
1983
9270 Doubloon Rd, Indianapolis, IN 46268
$-171
Cash flow
-4.0%
Cash-on-Cash Return
5.2%
Cap rate
0.8%
Rent to Value Ratio
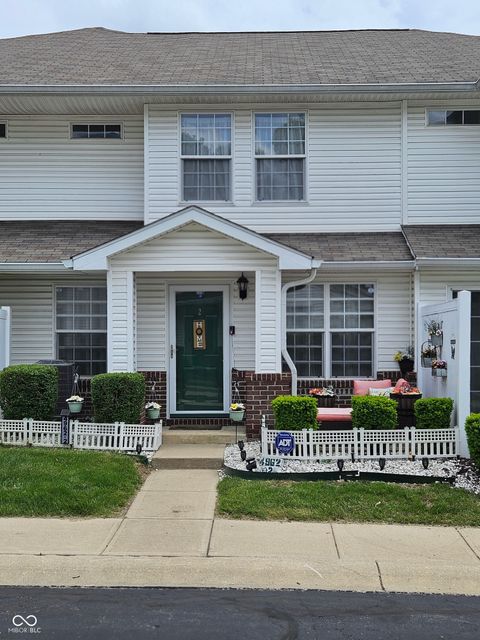
Active
$177,000
2
bds
|
3
ba
|
1,148
sqft
|
built
2003
4962 Potomac Square Pl, Indianapolis, IN 46268
$-12
Cash flow
-0.4%
Cash-on-Cash Return
6.1%
Cap rate
0.9%
Rent to Value Ratio
Active
$205,000
3
bds
|
3
ba
|
1,406
sqft
|
built
1984
9572 Maple Way, Indianapolis, IN 46268
$-116
Cash flow
-3.0%
Cash-on-Cash Return
5.5%
Cap rate
0.9%
Rent to Value Ratio
Active
$184,900
2
bds
|
2
ba
|
1,248
sqft
|
built
1982
9218 Doubloon Rd, Indianapolis, IN 46268
$-68
Cash flow
-1.9%
Cash-on-Cash Return
5.7%
Cap rate
0.9%
Rent to Value Ratio
Active
$245,000
4
bds
|
3
ba
|
1,760
sqft
|
built
1981
5155 Overland Ct, Indianapolis, IN 46268
$90
Cash flow
1.9%
Cash-on-Cash Return
6.6%
Cap rate
0.8%
Rent to Value Ratio
Active
$266,000
3
bds
|
2
ba
|
1,617
sqft
|
built
1960
2807 Westleigh Dr, Indianapolis, IN 46268
$17
Cash flow
0.3%
Cash-on-Cash Return
6.2%
Cap rate
0.8%
Rent to Value Ratio
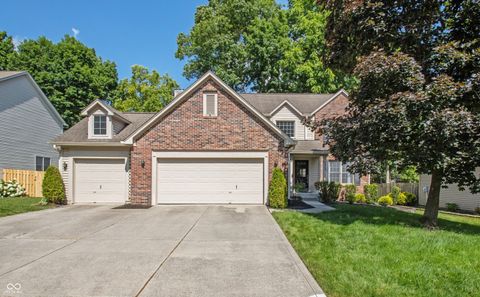
Active
$319,900
4
bds
|
3
ba
|
2,160
sqft
|
built
1999
6711 Crestwell Ln, Indianapolis, IN 46268
$-143
Cash flow
-2.3%
Cash-on-Cash Return
5.6%
Cap rate
0.7%
Rent to Value Ratio

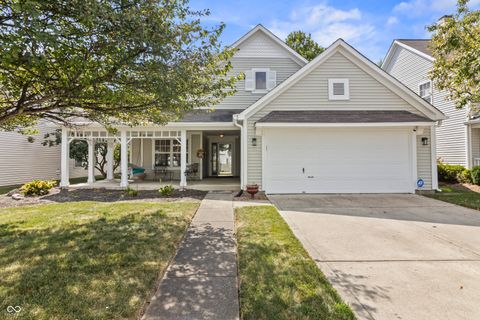
Active
$294,900
4
bds
|
3
ba
|
1,834
sqft
|
built
1996
6402 Kelsey Dr, Indianapolis, IN 46268
$-17
Cash flow
-0.3%
Cash-on-Cash Return
6.1%
Cap rate
0.7%
Rent to Value Ratio
Active
$140,000
3
bds
|
2
ba
|
1,103
sqft
|
built
1972
6901 Chrysler St, Indianapolis, IN 46268
$51
Cash flow
1.9%
Cash-on-Cash Return
6.6%
Cap rate
1.0%
Rent to Value Ratio
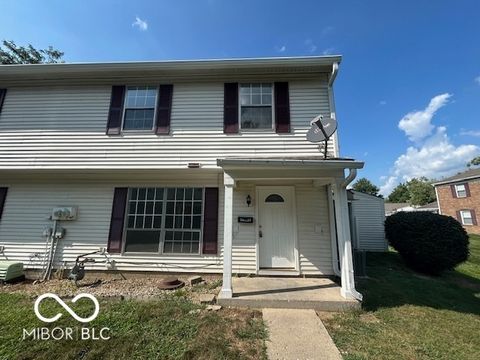
Active
$200,000
2
bds
|
2
ba
|
1,054
sqft
|
built
1983
3215 Sandpiper North Dr, Indianapolis, IN 46268
$-150
Cash flow
-3.9%
Cash-on-Cash Return
5.2%
Cap rate
0.8%
Rent to Value Ratio
Active
$245,900
3
bds
|
3
ba
|
1,498
sqft
|
built
1983
2424 N Willow Way, Indianapolis, IN 46268
$-26
Cash flow
-0.6%
Cash-on-Cash Return
6.0%
Cap rate
0.9%
Rent to Value Ratio
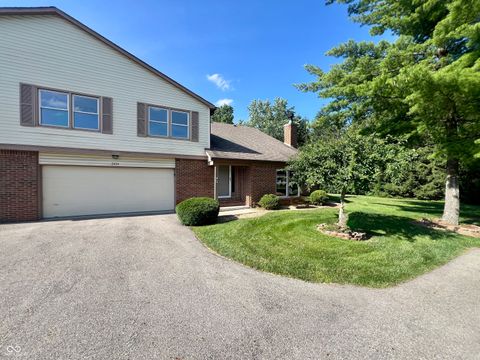
Active
$350,000
4
bds
|
3
ba
|
2,698
sqft
|
built
1996
6926 Bretton Wood Dr, Indianapolis, IN 46268
$-96
Cash flow
-1.4%
Cash-on-Cash Return
5.8%
Cap rate
0.7%
Rent to Value Ratio
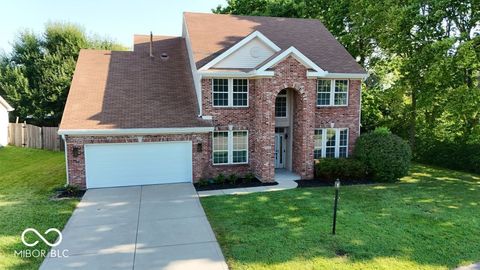
Active
$299,900
4
bds
|
3
ba
|
1,980
sqft
|
built
1991
7329 Camberwood Dr, Indianapolis, IN 46268
$-18
Cash flow
-0.3%
Cash-on-Cash Return
6.1%
Cap rate
0.7%
Rent to Value Ratio
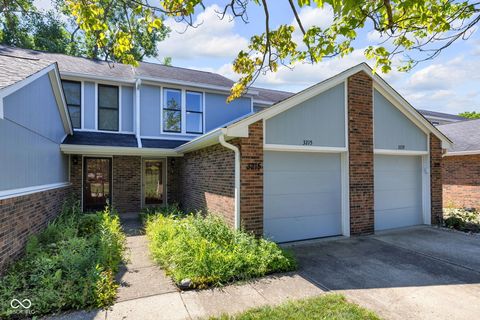
Active
$369,900
4
bds
|
3
ba
|
1,870
sqft
|
built
1992
3123 Bretton Ct, Indianapolis, IN 46268
$-129
Cash flow
-1.8%
Cash-on-Cash Return
5.7%
Cap rate
0.7%
Rent to Value Ratio