46268 Investment Properties for Sale
Browse homes for sale and investment properties in 46268. Refine your search by price, property type, or more.
Best cash flowing properties in 46268

Active
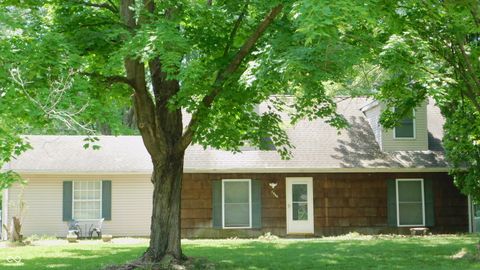
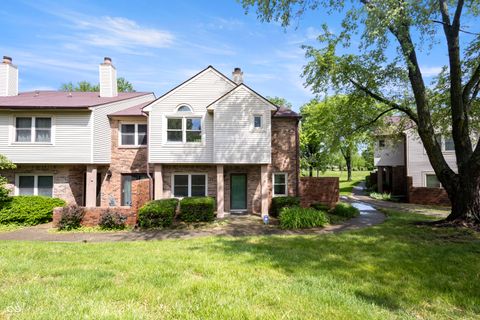
$159,900
2
bds
|
2
ba
|
1,234
sqft
|
built
1985
9452 Maple Way, Indianapolis, IN 46268
$53
Cash flow
1.7%
Cash-on-Cash Return
6.7%
Cap rate
1.1%
Rent to Value Ratio
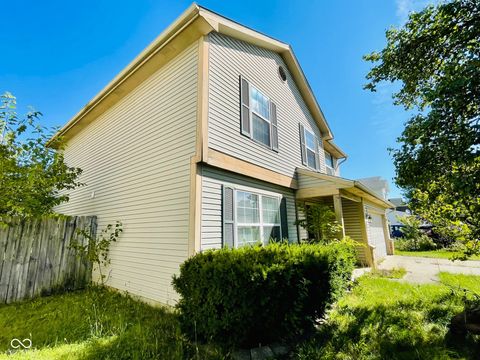
Active
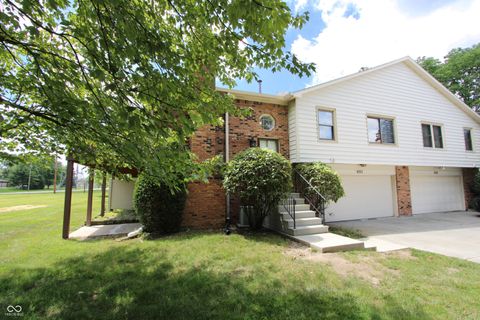
$232,900
4
bds
|
2
ba
|
1,920
sqft
|
built
1976
7966 Chiltern Dr, Indianapolis, IN 46268
$49
Cash flow
1.1%
Cash-on-Cash Return
6.4%
Cap rate
0.8%
Rent to Value Ratio
24 out of 27 properties for sale in 46268
Limited Results Shown
Create a free account, or log in to reveal all property listings and enjoy the complete experience.

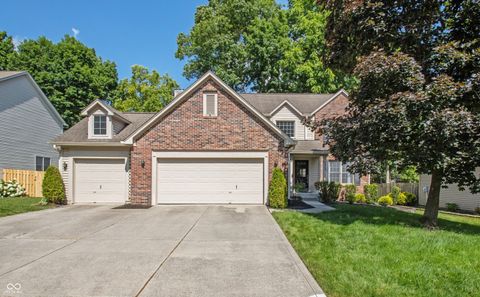
Active
$194,000
2
bds
|
2
ba
|
1,234
sqft
|
built
1985
9449 Maple Way, Indianapolis, IN 46268
$-79
Cash flow
-2.1%
Cash-on-Cash Return
5.8%
Cap rate
0.9%
Rent to Value Ratio

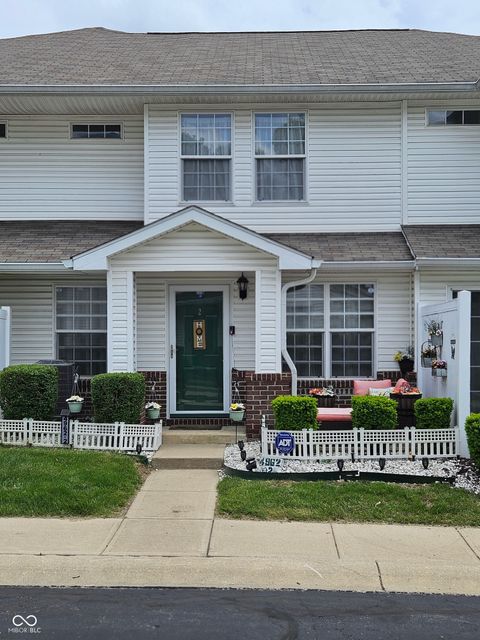
Active
$305,000
4
bds
|
3
ba
|
2,036
sqft
|
built
1987
7670 Lippincott Way, Indianapolis, IN 46268
$-77
Cash flow
-1.3%
Cash-on-Cash Return
6.0%
Cap rate
0.7%
Rent to Value Ratio

Active
$290,000
3
bds
|
3
ba
|
1,872
sqft
|
built
1998
6524 Amick Way, Indianapolis, IN 46268
$7
Cash flow
0.1%
Cash-on-Cash Return
6.2%
Cap rate
0.8%
Rent to Value Ratio
Active
$260,000
4
bds
|
3
ba
|
1,966
sqft
|
built
1998
4322 Par Dr, Indianapolis, IN 46268
$-115
Cash flow
-2.3%
Cash-on-Cash Return
5.7%
Cap rate
0.7%
Rent to Value Ratio

Active
$175,000
2
bds
|
2
ba
|
1,180
sqft
|
built
1980
8980 Cinnebar Dr, Indianapolis, IN 46268
$-104
Cash flow
-3.1%
Cash-on-Cash Return
5.6%
Cap rate
0.9%
Rent to Value Ratio

Active
$400,000
4
bds
|
3
ba
|
4,120
sqft
|
built
1991
7720 Langwood Dr, Indianapolis, IN 46268
$-337
Cash flow
-4.4%
Cash-on-Cash Return
5.1%
Cap rate
0.6%
Rent to Value Ratio
Active
$399,900
4
bds
|
3
ba
|
2,975
sqft
|
built
1994
6465 Robinsrock Dr, Indianapolis, IN 46268
$-376
Cash flow
-4.9%
Cash-on-Cash Return
5.0%
Cap rate
0.6%
Rent to Value Ratio
Active
$205,000
2
bds
|
3
ba
|
1,148
sqft
|
built
2003
4962 Potomac Square Pl, Indianapolis, IN 46268
$-175
Cash flow
-4.5%
Cash-on-Cash Return
5.2%
Cap rate
0.8%
Rent to Value Ratio
Active
$205,000
3
bds
|
3
ba
|
1,406
sqft
|
built
1984
9572 Maple Way, Indianapolis, IN 46268
$-116
Cash flow
-3.0%
Cash-on-Cash Return
5.5%
Cap rate
0.9%
Rent to Value Ratio

Active
$350,000
4
bds
|
4
ba
|
3,824
sqft
|
built
1986
8315 N Payne Rd, Indianapolis, IN 46268
$-240
Cash flow
-3.6%
Cash-on-Cash Return
5.4%
Cap rate
0.7%
Rent to Value Ratio

Active
$319,900
3
bds
|
3
ba
|
2,409
sqft
|
built
1991
7168 Camwell Dr, Indianapolis, IN 46268
$-155
Cash flow
-2.5%
Cash-on-Cash Return
5.7%
Cap rate
0.7%
Rent to Value Ratio
Active
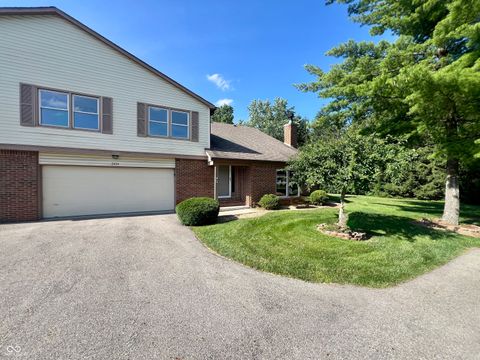
$253,900
3
bds
|
3
ba
|
1,498
sqft
|
built
1983
2424 N Willow Way, Indianapolis, IN 46268
$-92
Cash flow
-1.9%
Cash-on-Cash Return
5.8%
Cap rate
0.9%
Rent to Value Ratio
Active
$159,900
2
bds
|
2
ba
|
1,234
sqft
|
built
1985
9452 Maple Way, Indianapolis, IN 46268
$53
Cash flow
1.7%
Cash-on-Cash Return
6.7%
Cap rate
1.1%
Rent to Value Ratio
Active
$225,000
2
bds
|
3
ba
|
2,124
sqft
|
built
1982
9323 Doubloon Rd, Indianapolis, IN 46268
$-102
Cash flow
-2.4%
Cash-on-Cash Return
5.6%
Cap rate
0.8%
Rent to Value Ratio

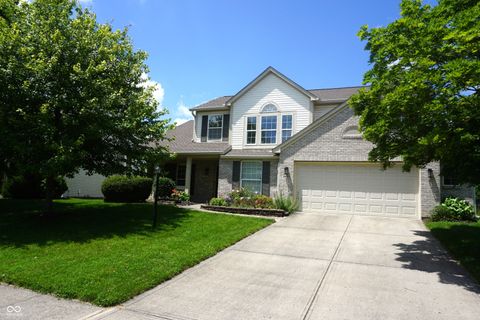
Active
$294,900
4
bds
|
3
ba
|
1,984
sqft
|
built
2001
7814 Crooked Meadows Dr, Indianapolis, IN 46268
$-52
Cash flow
-0.9%
Cash-on-Cash Return
6.1%
Cap rate
0.7%
Rent to Value Ratio

Active
$260,000
3
bds
|
2
ba
|
1,688
sqft
|
built
1996
4528 Hunt Master Ct, Indianapolis, IN 46268
$0
Cash flow
0.0%
Cash-on-Cash Return
6.3%
Cap rate
0.8%
Rent to Value Ratio
Active
$359,000
3
bds
|
3
ba
|
2,553
sqft
|
built
1999
6422 Hollingsworth Dr, Indianapolis, IN 46268
$-207
Cash flow
-3.0%
Cash-on-Cash Return
5.5%
Cap rate
0.7%
Rent to Value Ratio
Active
$195,000
3
bds
|
3
ba
|
1,472
sqft
|
built
1974
9458 Fordham St, Indianapolis, IN 46268
$-136
Cash flow
-3.6%
Cash-on-Cash Return
5.3%
Cap rate
0.9%
Rent to Value Ratio

Active
$305,000
3
bds
|
3
ba
|
2,488
sqft
|
built
1979
2947 Talping Row, Indianapolis, IN 46268
$-564
Cash flow
-9.6%
Cash-on-Cash Return
3.9%
Cap rate
0.7%
Rent to Value Ratio
Active
$349,000
3
bds
|
2
ba
|
1,890
sqft
|
built
1971
3141 Citadel Ct, Indianapolis, IN 46268
$-458
Cash flow
-6.8%
Cash-on-Cash Return
4.6%
Cap rate
0.6%
Rent to Value Ratio

Active
$292,000
4
bds
|
3
ba
|
1,760
sqft
|
built
1981
5155 Overland Ct, Indianapolis, IN 46268
$-179
Cash flow
-3.2%
Cash-on-Cash Return
5.5%
Cap rate
0.7%
Rent to Value Ratio
Active
$266,000
3
bds
|
2
ba
|
1,617
sqft
|
built
1960
2807 Westleigh Dr, Indianapolis, IN 46268
$-9
Cash flow
-0.2%
Cash-on-Cash Return
6.2%
Cap rate
0.8%
Rent to Value Ratio
Active
$232,900
4
bds
|
2
ba
|
1,920
sqft
|
built
1976
7966 Chiltern Dr, Indianapolis, IN 46268
$49
Cash flow
1.1%
Cash-on-Cash Return
6.4%
Cap rate
0.8%
Rent to Value Ratio

Active
$299,000
4
bds
|
3
ba
|
2,020
sqft
|
built
1995
6214 Weller Cir, Indianapolis, IN 46268
$-36
Cash flow
-0.6%
Cash-on-Cash Return
6.0%
Cap rate
0.7%
Rent to Value Ratio