47302 Investment Properties for Sale
Browse homes for sale and investment properties in 47302. Refine your search by price, property type, or more.
Best cash flowing properties in 47302
Active
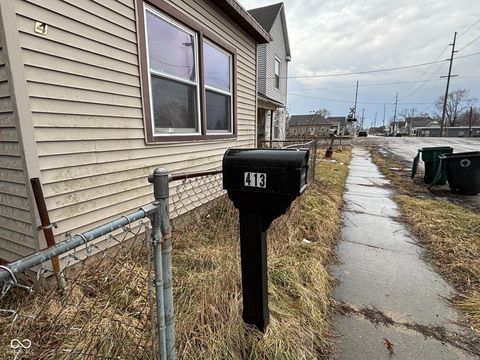
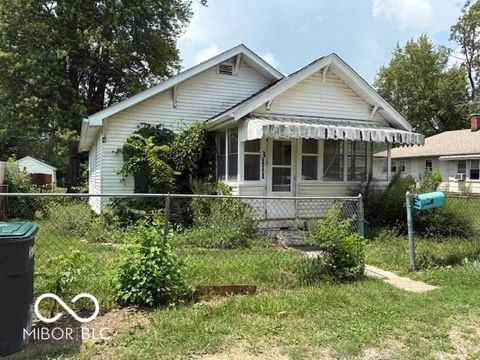
$29,900
3
bds
|
2
ba
|
1,584
sqft
|
built
1895
413 W 8th St, Muncie, IN 47302
$828
Cash flow
32.3%
Cash-on-Cash Return
33.2%
Cap rate
4.0%
Rent to Value Ratio
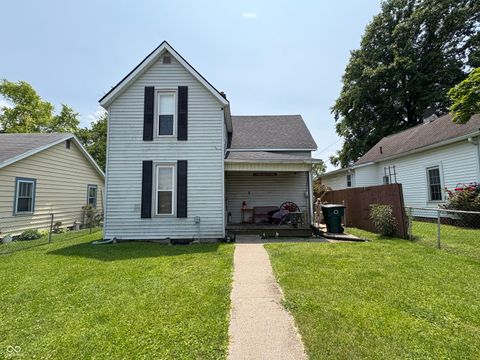
Active
$69,900
4
bds
|
2
ba
|
1,624
sqft
|
built
1890
1809 E 13th St, Muncie, IN 47302
$759
Cash flow
12.7%
Cash-on-Cash Return
13.0%
Cap rate
1.6%
Rent to Value Ratio
22 out of 23 properties for sale in 47302
Limited Results Shown
Create a free account, or log in to reveal all property listings and enjoy the complete experience.
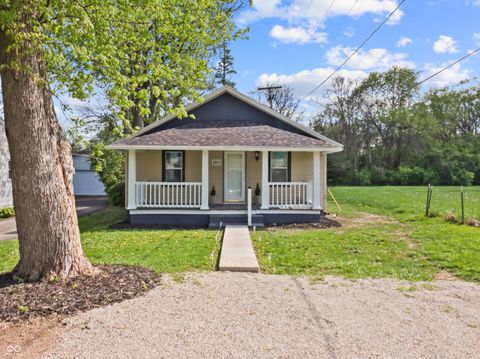
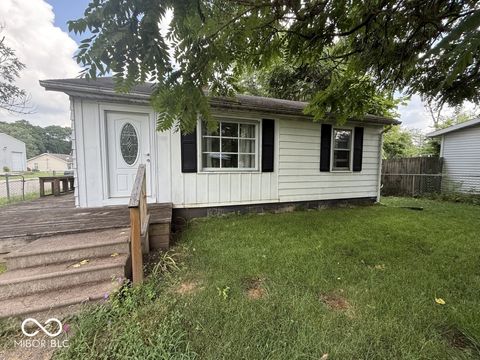
Active
$98,500
3
bds
|
1
ba
|
884
sqft
|
built
1931
1401 E 24th St, Muncie, IN 47302
$116
Cash flow
6.1%
Cash-on-Cash Return
7.6%
Cap rate
0.9%
Rent to Value Ratio
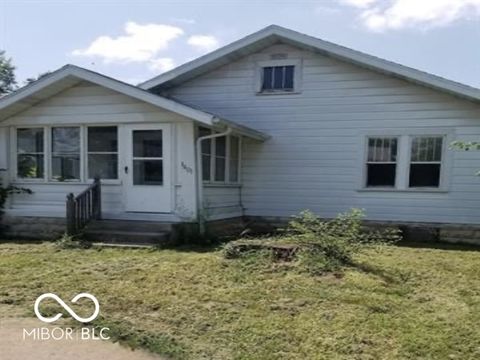
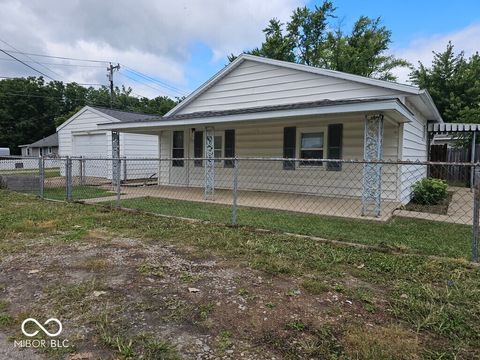
Active
$78,900
2
bds
|
1
ba
|
896
sqft
|
built
1925
1401 S Emerson Ct, Muncie, IN 47302
$217
Cash flow
14.3%
Cash-on-Cash Return
9.4%
Cap rate
1.1%
Rent to Value Ratio
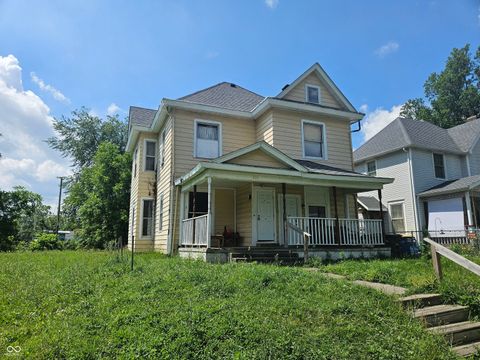
Active
$88,900
3
bds
|
1
ba
|
948
sqft
|
built
1925
3111 S Pershing Dr, Muncie, IN 47302
$442
Cash flow
25.9%
Cash-on-Cash Return
12.1%
Cap rate
1.5%
Rent to Value Ratio
Active
$94,900
3
bds
|
1
ba
|
948
sqft
|
built
1954
1048 S Burlington Dr, Muncie, IN 47302
$204
Cash flow
11.2%
Cash-on-Cash Return
8.7%
Cap rate
1.1%
Rent to Value Ratio
Active
$59,900
1
bds
|
1
ba
|
734
sqft
|
built
1947
310 W 22nd St, Muncie, IN 47302
$690
Cash flow
13.4%
Cash-on-Cash Return
13.8%
Cap rate
1.7%
Rent to Value Ratio
Active
$148,000
2
bds
|
0
ba
|
0
sqft
|
built
1902
221 E 6th St, Muncie, IN 47302
$1
Cash flow
0.0%
Cash-on-Cash Return
6.2%
Cap rate
0.7%
Rent to Value Ratio
Active
$115,000
3
bds
|
2
ba
|
1,185
sqft
|
built
1882
1011 S Elm St, Muncie, IN 47302
$377
Cash flow
17.1%
Cash-on-Cash Return
10.1%
Cap rate
1.2%
Rent to Value Ratio
Active
$279,999
3
bds
|
3
ba
|
2,348
sqft
|
built
1974
10100 S County Road 300 W, Muncie, IN 47302
$84
Cash flow
1.6%
Cash-on-Cash Return
6.5%
Cap rate
0.8%
Rent to Value Ratio
Active
$109,900
3
bds
|
1
ba
|
961
sqft
|
built
1884
709 S Vine St, Muncie, IN 47302
$334
Cash flow
15.9%
Cash-on-Cash Return
9.8%
Cap rate
1.2%
Rent to Value Ratio
Active
$87,900
3
bds
|
1
ba
|
844
sqft
|
built
1920
605 W 10th St, Muncie, IN 47302
$309
Cash flow
18.3%
Cash-on-Cash Return
10.4%
Cap rate
1.3%
Rent to Value Ratio
Active
$125,000
3
bds
|
2
ba
|
1,432
sqft
|
built
1967
2616 E 27th St, Muncie, IN 47302
$602
Cash flow
25.1%
Cash-on-Cash Return
11.9%
Cap rate
1.4%
Rent to Value Ratio
Active
$108,900
3
bds
|
2
ba
|
738
sqft
|
built
1938
2815 S Pershing Dr, Muncie, IN 47302
$546
Cash flow
26.2%
Cash-on-Cash Return
12.2%
Cap rate
1.5%
Rent to Value Ratio

Active
$108,900
3
bds
|
2
ba
|
775
sqft
|
built
1923
1921 S Hackley St, Muncie, IN 47302
$408
Cash flow
19.5%
Cash-on-Cash Return
10.6%
Cap rate
1.3%
Rent to Value Ratio

Active
$104,900
2
bds
|
1
ba
|
872
sqft
|
built
1946
1914 E 23rd St, Muncie, IN 47302
$153
Cash flow
7.6%
Cash-on-Cash Return
7.9%
Cap rate
1.0%
Rent to Value Ratio

Active
$113,790
2
bds
|
1
ba
|
960
sqft
|
built
1950
1511 E 20th St, Muncie, IN 47302
$245
Cash flow
11.2%
Cash-on-Cash Return
8.7%
Cap rate
1.1%
Rent to Value Ratio

Active
$78,000
2
bds
|
1
ba
|
1,124
sqft
|
built
1939
2204 S Waldemere Ave, Muncie, IN 47302
$359
Cash flow
24.0%
Cash-on-Cash Return
11.7%
Cap rate
1.4%
Rent to Value Ratio

Active
$102,900
2
bds
|
2
ba
|
1,060
sqft
|
built
1972
1710 S Birch St, Muncie, IN 47302
$163
Cash flow
8.3%
Cash-on-Cash Return
8.0%
Cap rate
1.0%
Rent to Value Ratio

Active
$167,900
3
bds
|
1
ba
|
1,466
sqft
|
built
1954
520 E County Road 500 S, Muncie, IN 47302
$106
Cash flow
3.3%
Cash-on-Cash Return
6.9%
Cap rate
0.8%
Rent to Value Ratio

Active
$164,900
3
bds
|
2
ba
|
1,804
sqft
|
built
1896
2001 S Jefferson St, Muncie, IN 47302
$121
Cash flow
3.8%
Cash-on-Cash Return
7.0%
Cap rate
0.8%
Rent to Value Ratio
Active
$70,000
2
bds
|
1
ba
|
1,134
sqft
|
built
1910
1724 S Elm St, Muncie, IN 47302
$690
Cash flow
11.5%
Cash-on-Cash Return
11.8%
Cap rate
1.4%
Rent to Value Ratio