47302 Investment Properties for Sale
Browse homes for sale and investment properties in 47302. Refine your search by price, property type, or more.
Best cash flowing properties in 47302

Active
$42,500
2
bds
|
1
ba
|
986
sqft
|
built
1935
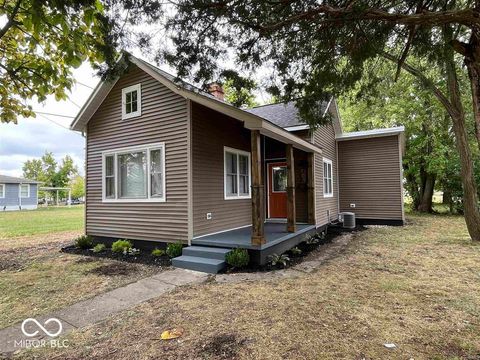
907 W 14th St, Muncie, IN 47302
$897
Cash flow
24.6%
Cash-on-Cash Return
25.3%
Cap rate
3.1%
Rent to Value Ratio

Active
$69,000
3
bds
|
1
ba
|
1,204
sqft
|
built
1892
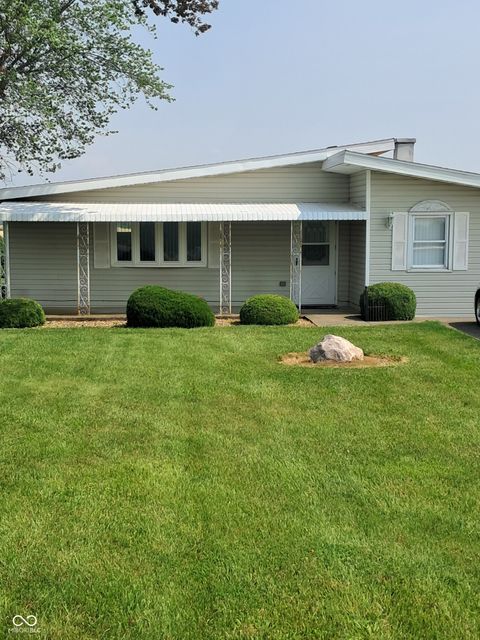
818 S Grant St, Muncie, IN 47302
$897
Cash flow
15.1%
Cash-on-Cash Return
15.6%
Cap rate
1.9%
Rent to Value Ratio
24 out of 29 properties for sale in 47302
Limited Results Shown
Create a free account, or log in to reveal all property listings and enjoy the complete experience.

Active
$85,000
2
bds
|
1
ba
|
760
sqft
|
built
1948
1601 S Biltmore Ave, Muncie, IN 47302
$660
Cash flow
40.5%
Cash-on-Cash Return
15.6%
Cap rate
1.9%
Rent to Value Ratio
Active
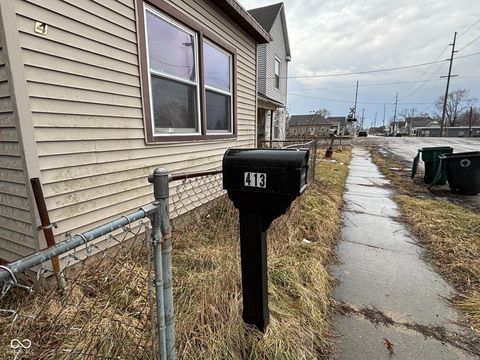
$34,900
3
bds
|
2
ba
|
1,584
sqft
|
built
1895
413 W 8th St, Muncie, IN 47302
$828
Cash flow
27.6%
Cash-on-Cash Return
28.5%
Cap rate
3.4%
Rent to Value Ratio

Active
$75,000
3
bds
|
1
ba
|
1,215
sqft
|
built
1896
1708 W 7th St, Muncie, IN 47302
$436
Cash flow
30.3%
Cash-on-Cash Return
13.2%
Cap rate
1.6%
Rent to Value Ratio

Active
$100,000
2
bds
|
1
ba
|
936
sqft
|
built
1956
1618 E 24th St, Muncie, IN 47302
$237
Cash flow
12.4%
Cash-on-Cash Return
9.1%
Cap rate
1.1%
Rent to Value Ratio

Active
$150,000
4
bds
|
3
ba
|
3,220
sqft
|
built
1896
1225 S Monroe St, Muncie, IN 47302
$252
Cash flow
8.8%
Cash-on-Cash Return
8.3%
Cap rate
1.0%
Rent to Value Ratio

Active
$100,000
2
bds
|
1
ba
|
1,440
sqft
|
built
1948
1619 E 20th St, Muncie, IN 47302
$237
Cash flow
12.4%
Cash-on-Cash Return
9.1%
Cap rate
1.1%
Rent to Value Ratio

Active
$800,000
2
bds
|
2
ba
|
2,074
sqft
|
built
1961
9100 S US Highway 35, Muncie, IN 47302
$-2,383
Cash flow
-15.5%
Cash-on-Cash Return
2.7%
Cap rate
0.3%
Rent to Value Ratio
Active
$79,900
3
bds
|
1
ba
|
1,152
sqft
|
built
1948
2301 S Vine St, Muncie, IN 47302
$342
Cash flow
22.3%
Cash-on-Cash Return
11.4%
Cap rate
1.4%
Rent to Value Ratio
Active
$69,000
3
bds
|
1
ba
|
1,204
sqft
|
built
1892
818 S Grant St, Muncie, IN 47302
$897
Cash flow
15.1%
Cash-on-Cash Return
15.6%
Cap rate
1.9%
Rent to Value Ratio
Active
$69,900
4
bds
|
2
ba
|
1,624
sqft
|
built
1890
1809 E 13th St, Muncie, IN 47302
$759
Cash flow
12.7%
Cash-on-Cash Return
13.0%
Cap rate
1.6%
Rent to Value Ratio
Active
$92,900
3
bds
|
1
ba
|
844
sqft
|
built
1920
605 W 10th St, Muncie, IN 47302
$274
Cash flow
15.4%
Cash-on-Cash Return
9.8%
Cap rate
1.2%
Rent to Value Ratio
Active
$114,900
3
bds
|
1
ba
|
961
sqft
|
built
1884
709 S Vine St, Muncie, IN 47302
$297
Cash flow
13.5%
Cash-on-Cash Return
9.4%
Cap rate
1.1%
Rent to Value Ratio

Active
$107,000
2
bds
|
1
ba
|
728
sqft
|
built
1939
2015 S Hackley St, Muncie, IN 47302
$407
Cash flow
19.8%
Cash-on-Cash Return
10.8%
Cap rate
1.3%
Rent to Value Ratio

Active
$16,900
3
bds
|
1
ba
|
1,000
sqft
|
built
1951
3812 S Ebright St, Muncie, IN 47302
$759
Cash flow
52.3%
Cash-on-Cash Return
53.9%
Cap rate
6.5%
Rent to Value Ratio

Active
$129,900
3
bds
|
2
ba
|
1,008
sqft
|
built
1929
2209 W 9th St, Muncie, IN 47302
$426
Cash flow
17.1%
Cash-on-Cash Return
10.2%
Cap rate
1.2%
Rent to Value Ratio

Active
$799,900
3
bds
|
4
ba
|
4,671
sqft
|
built
1964
5707 S Burlington Dr, Muncie, IN 47302
$-2,451
Cash flow
-16.0%
Cash-on-Cash Return
2.6%
Cap rate
0.3%
Rent to Value Ratio

Active
$109,900
2
bds
|
2
ba
|
1,060
sqft
|
built
1972
1710 S Birch St, Muncie, IN 47302
$116
Cash flow
5.5%
Cash-on-Cash Return
7.5%
Cap rate
0.9%
Rent to Value Ratio
Active
$169,900
3
bds
|
1
ba
|
1,466
sqft
|
built
1954
520 E County Road 500 S, Muncie, IN 47302
$79
Cash flow
2.4%
Cash-on-Cash Return
6.8%
Cap rate
0.8%
Rent to Value Ratio

Active
$125,000
3
bds
|
2
ba
|
1,962
sqft
|
built
1900
1715 S Madison St, Muncie, IN 47302
$313
Cash flow
13.1%
Cash-on-Cash Return
9.3%
Cap rate
1.1%
Rent to Value Ratio

Active
$155,000
5
bds
|
0
ba
|
0
sqft
|
built
1894
1709 S Elm St, Muncie, IN 47302
$-119
Cash flow
-4.0%
Cash-on-Cash Return
5.3%
Cap rate
0.6%
Rent to Value Ratio

Active
$38,900
2
bds
|
1
ba
|
1,035
sqft
|
built
1944
1503 E 20th St, Muncie, IN 47302
$690
Cash flow
20.7%
Cash-on-Cash Return
21.3%
Cap rate
2.6%
Rent to Value Ratio

Active
$85,000
3
bds
|
1
ba
|
892
sqft
|
built
1960
1303 S Shipley St, Muncie, IN 47302
$315
Cash flow
19.3%
Cash-on-Cash Return
10.7%
Cap rate
1.3%
Rent to Value Ratio

Active
$60,000
3
bds
|
2
ba
|
1,580
sqft
|
built
1900
1309 W Memorial Dr, Muncie, IN 47302
$759
Cash flow
14.7%
Cash-on-Cash Return
15.2%
Cap rate
1.8%
Rent to Value Ratio
Active
$42,500
2
bds
|
1
ba
|
986
sqft
|
built
1935
907 W 14th St, Muncie, IN 47302
$897
Cash flow
24.6%
Cash-on-Cash Return
25.3%
Cap rate
3.1%
Rent to Value Ratio