47303 Investment Properties for Sale
Browse homes for sale and investment properties in 47303. Refine your search by price, property type, or more.
Best cash flowing properties in 47303
Active
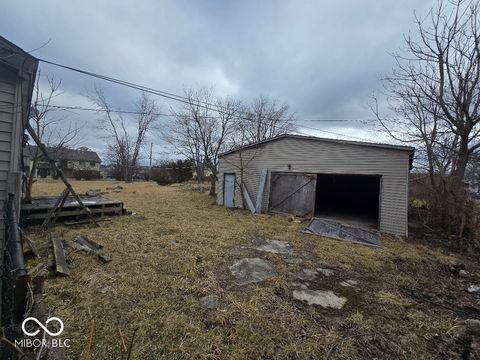
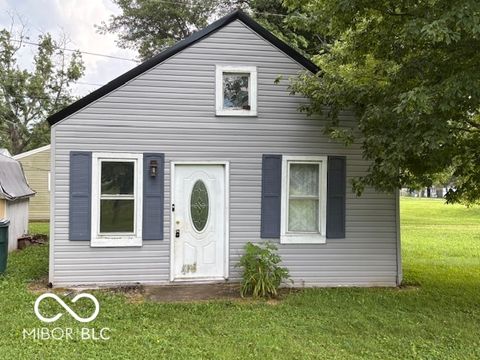
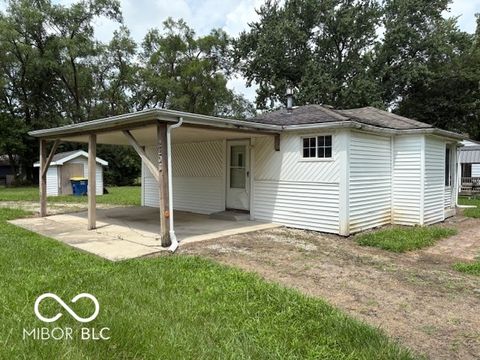
$29,900
2
bds
|
1
ba
|
1,304
sqft
|
built
1952
2420 N Macedonia Ave, Muncie, IN 47303
$759
Cash flow
29.6%
Cash-on-Cash Return
30.5%
Cap rate
3.7%
Rent to Value Ratio
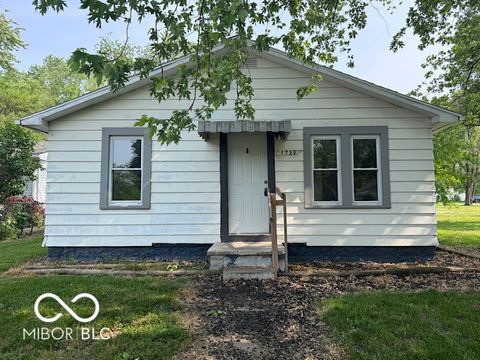
Active
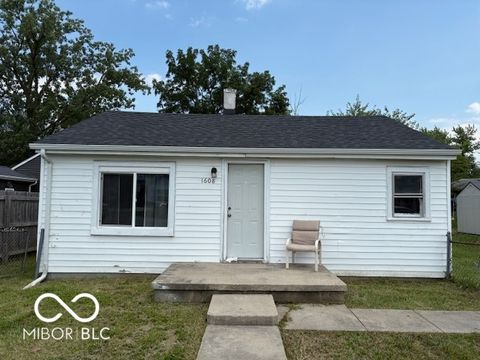
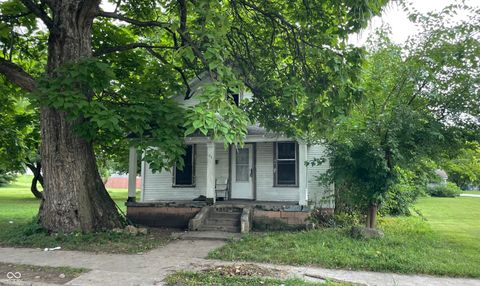
$70,000
2
bds
|
1
ba
|
742
sqft
|
built
1953
1608 N Macedonia Ave, Muncie, IN 47303
$690
Cash flow
11.5%
Cash-on-Cash Return
11.8%
Cap rate
1.4%
Rent to Value Ratio
16 out of 17 properties for sale in 47303
Limited Results Shown
Create a free account, or log in to reveal all property listings and enjoy the complete experience.
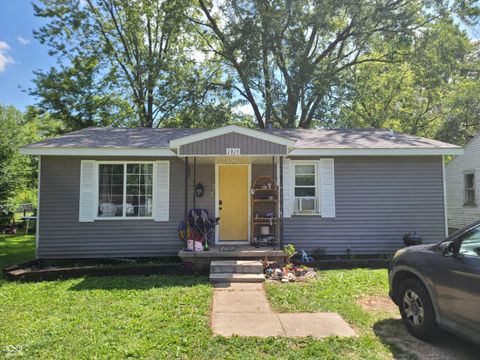
Active
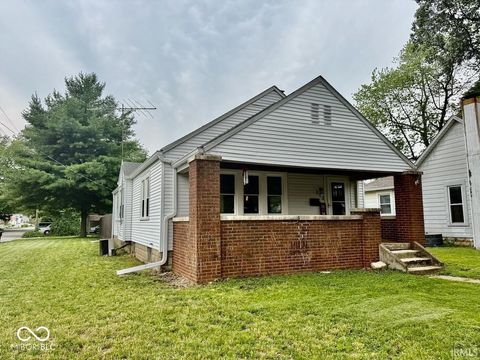
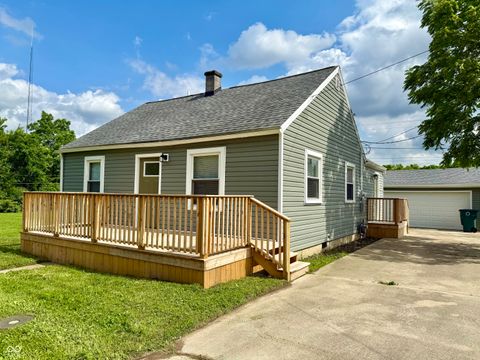
$125,000
2
bds
|
1
ba
|
1,168
sqft
|
built
1928
313 S Brittain Ave, Muncie, IN 47303
$257
Cash flow
10.7%
Cash-on-Cash Return
8.6%
Cap rate
1.0%
Rent to Value Ratio
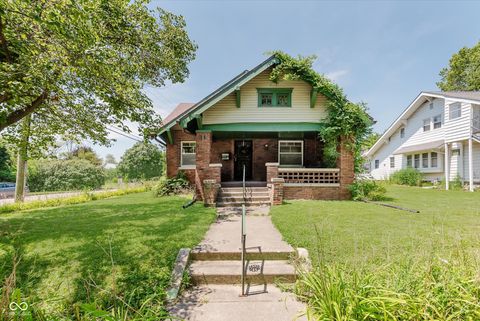
Active
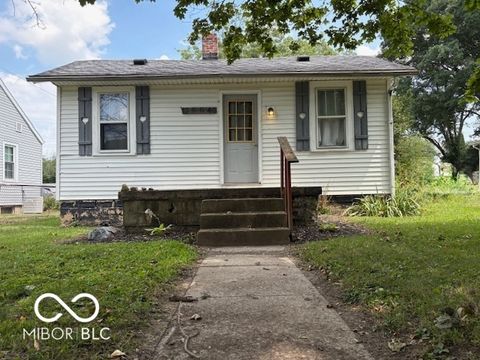
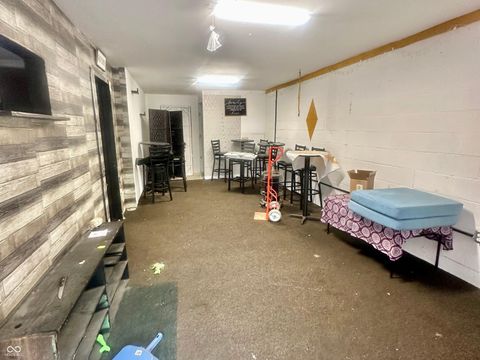
$80,000
1
bds
|
1
ba
|
648
sqft
|
built
1930
1804 N Milton St, Muncie, IN 47303
$211
Cash flow
13.8%
Cash-on-Cash Return
9.3%
Cap rate
1.1%
Rent to Value Ratio
Active
$78,900
2
bds
|
1
ba
|
620
sqft
|
built
1950
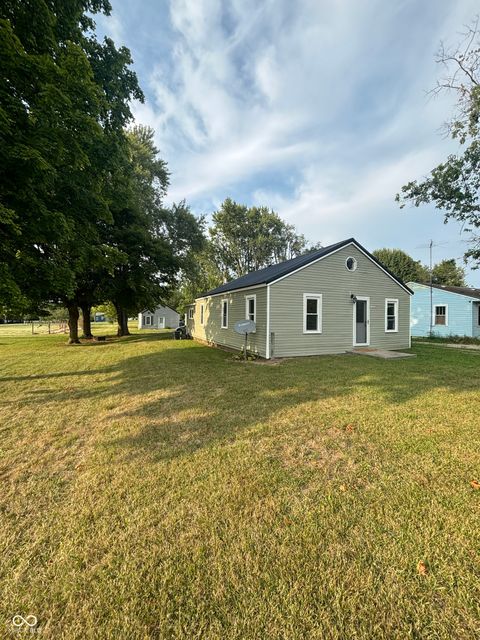
2309 E Depauw Ave, Muncie, IN 47303
$355
Cash flow
23.5%
Cash-on-Cash Return
11.5%
Cap rate
1.4%
Rent to Value Ratio
Active
$59,900
2
bds
|
1
ba
|
796
sqft
|
built
1945
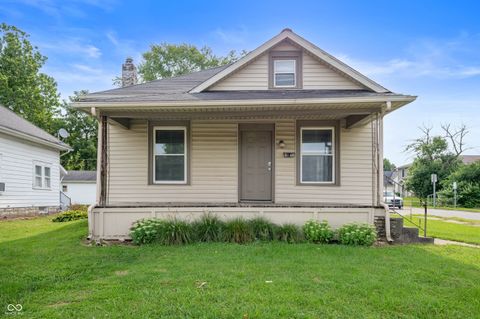
1720 E Cornell Ave, Muncie, IN 47303
$690
Cash flow
13.4%
Cash-on-Cash Return
13.8%
Cap rate
1.7%
Rent to Value Ratio
Active
$90,000
2
bds
|
1
ba
|
945
sqft
|
built
1950
1915 E Purdue Rd, Muncie, IN 47303
$436
Cash flow
25.3%
Cash-on-Cash Return
12.0%
Cap rate
1.4%
Rent to Value Ratio
Active
$160,000
3
bds
|
1
ba
|
1,492
sqft
|
built
1915
1401 N Walnut St, Muncie, IN 47303
$284
Cash flow
9.3%
Cash-on-Cash Return
8.3%
Cap rate
1.0%
Rent to Value Ratio
Active
$78,900
2
bds
|
1
ba
|
840
sqft
|
built
1950
2101 N Macedonia Ave, Muncie, IN 47303
$286
Cash flow
18.9%
Cash-on-Cash Return
10.5%
Cap rate
1.3%
Rent to Value Ratio
Active
$32,000
3
bds
|
2
ba
|
980
sqft
|
built
1925
904 N Penn St, Muncie, IN 47303
$552
Cash flow
20.1%
Cash-on-Cash Return
20.7%
Cap rate
2.5%
Rent to Value Ratio
Active
$159,900
2
bds
|
1
ba
|
792
sqft
|
built
1951
405 E Cowing Dr, Muncie, IN 47303
$147
Cash flow
4.8%
Cash-on-Cash Return
7.2%
Cap rate
0.9%
Rent to Value Ratio
Active
$37,500
bds
|
1
ba
|
720
sqft
|
built
1967
1214 N Penn St, Muncie, IN 47303
$621
Cash flow
19.3%
Cash-on-Cash Return
19.9%
Cap rate
2.4%
Rent to Value Ratio
Active
$118,900
4
bds
|
2
ba
|
1,227
sqft
|
built
1930
3900 N Bellaire Ave, Muncie, IN 47303
$12
Cash flow
0.5%
Cash-on-Cash Return
6.3%
Cap rate
0.8%
Rent to Value Ratio
Active
$129,900
3
bds
|
2
ba
|
1,249
sqft
|
built
1890
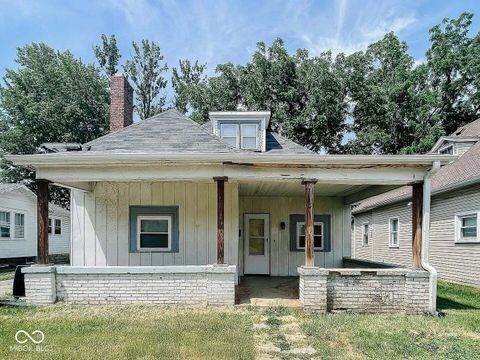
712 W Queen St, Muncie, IN 47303
$301
Cash flow
12.1%
Cash-on-Cash Return
8.9%
Cap rate
1.1%
Rent to Value Ratio
Active
$134,900
3
bds
|
2
ba
|
2,436
sqft
|
built
1904
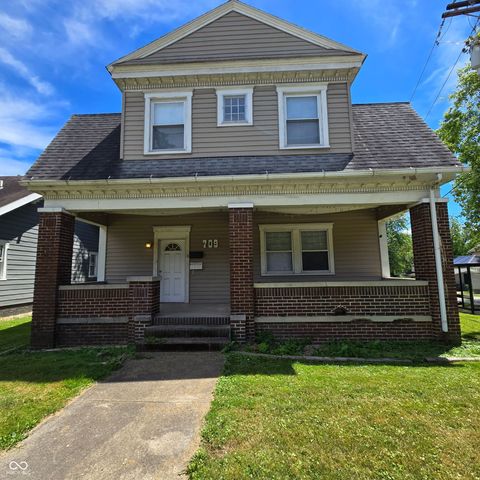
709 W Riverside Ave, Muncie, IN 47303
$482
Cash flow
18.6%
Cash-on-Cash Return
10.4%
Cap rate
1.3%
Rent to Value Ratio
Active
$270,000
6
bds
|
0
ba
|
0
sqft
|
built
1936
100 N Calvert St, Muncie, IN 47303
$-279
Cash flow
-5.4%
Cash-on-Cash Return
4.9%
Cap rate
0.6%
Rent to Value Ratio