49341 Investment Properties for Sale
Browse homes for sale and investment properties in 49341. Refine your search by price, property type, or more.
Best cash flowing properties in 49341

Active
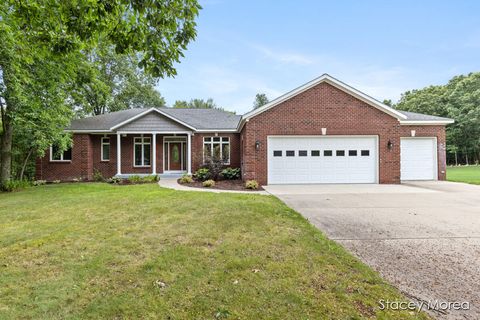
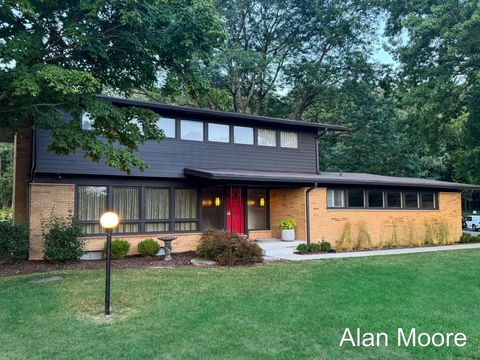
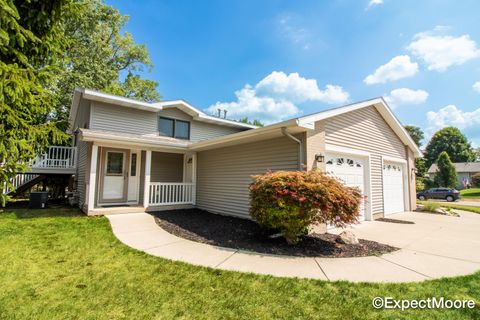
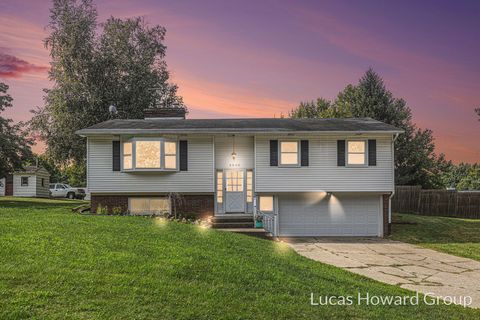
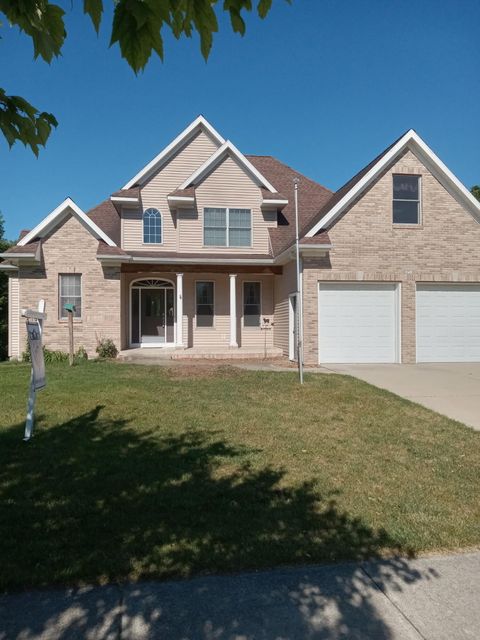
$309,900
6
bds
|
4
ba
|
4,425
sqft
|
built
1965
11391 Wellman Ave NE, Rockford, MI 49341
$14
Cash flow
0.2%
Cash-on-Cash Return
6.2%
Cap rate
0.8%
Rent to Value Ratio
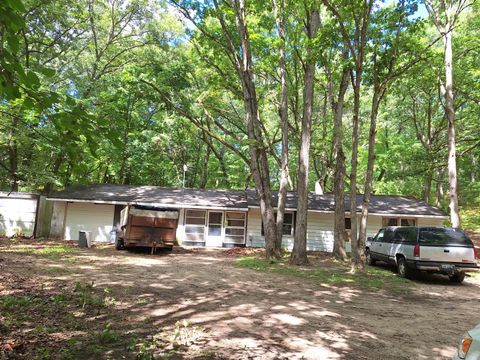
Active
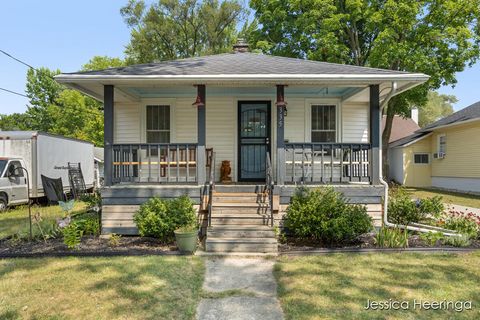
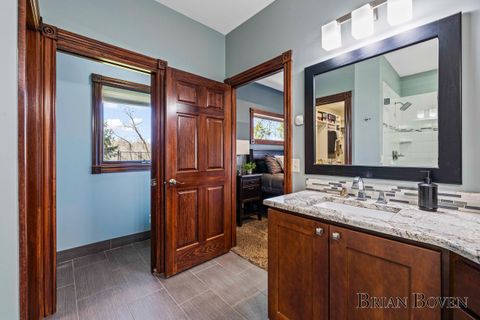
$199,900
2
bds
|
1
ba
|
953
sqft
|
built
1965
8315 Ramsdell Dr NE, Rockford, MI 49341
$-64
Cash flow
-1.7%
Cash-on-Cash Return
5.8%
Cap rate
0.9%
Rent to Value Ratio
39 out of 43 properties for sale in 49341
Limited Results Shown
Create a free account, or log in to reveal all property listings and enjoy the complete experience.
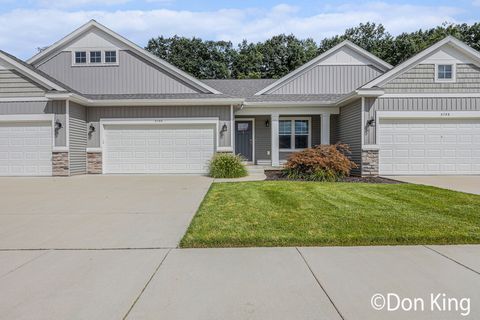
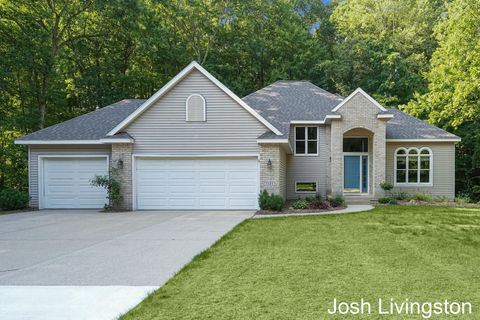
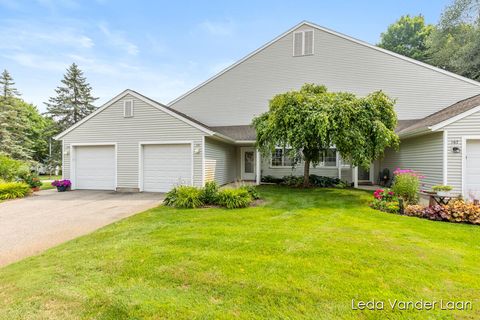
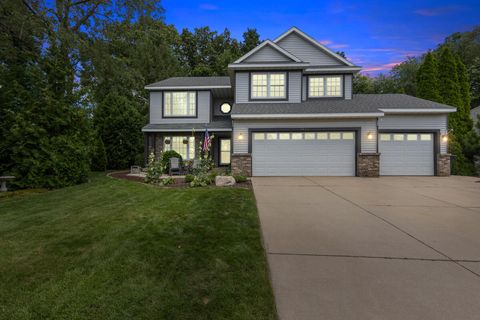
Active
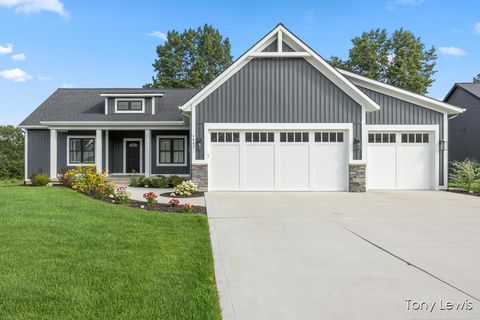
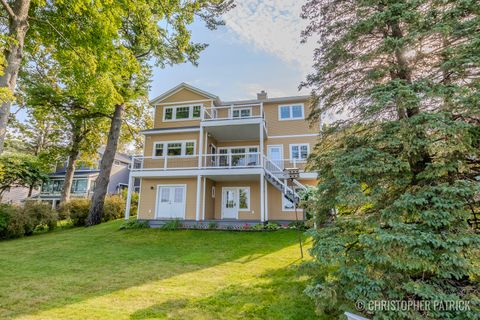
$384,900
2
bds
|
3
ba
|
2,112
sqft
|
built
2020
8788 Veld Stream Dr, Rockford, MI 49341
$-1,074
Cash flow
-14.6%
Cash-on-Cash Return
2.8%
Cap rate
0.6%
Rent to Value Ratio

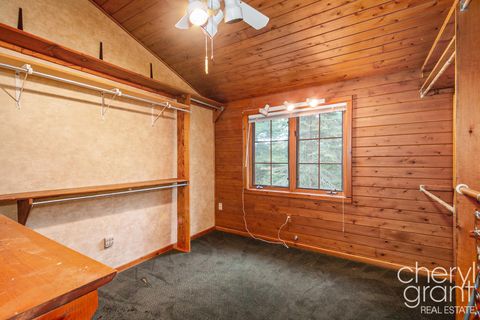
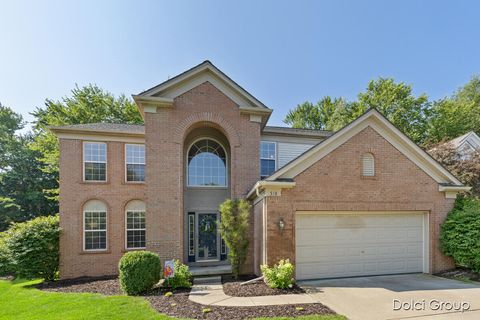
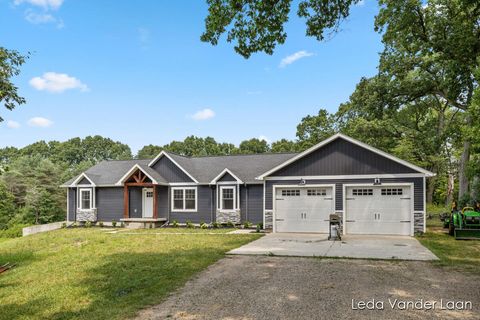
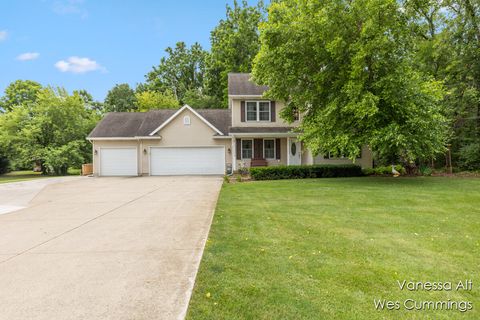
Active
$350,000
4
bds
|
2
ba
|
1,937
sqft
|
built
1990
6513 Kuttshill Dr NE, Rockford, MI 49341
$-378
Cash flow
-5.6%
Cash-on-Cash Return
4.9%
Cap rate
0.7%
Rent to Value Ratio

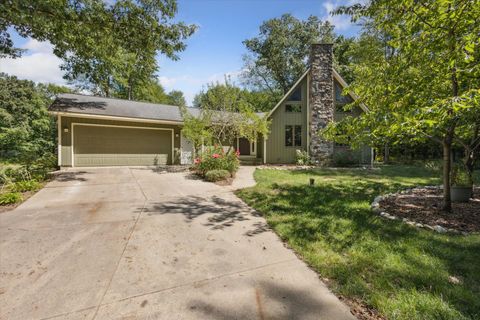
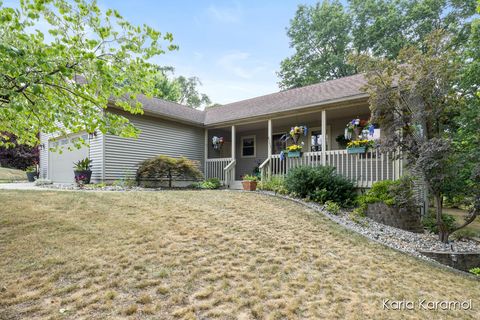
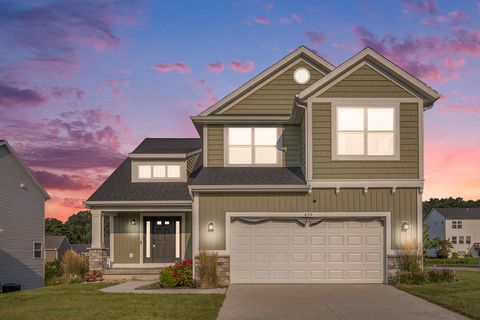
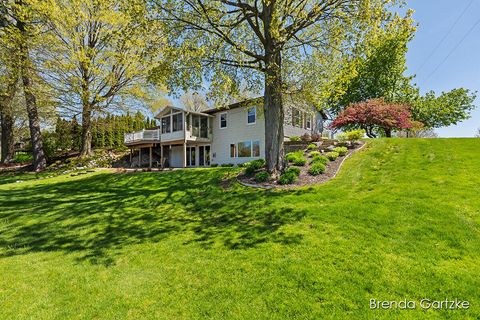
Active
$349,900
4
bds
|
2
ba
|
2,252
sqft
|
built
1922
107 S Main St, Rockford, MI 49341
$-427
Cash flow
-6.4%
Cash-on-Cash Return
4.7%
Cap rate
0.7%
Rent to Value Ratio
Active
$400,000
4
bds
|
3
ba
|
1,428
sqft
|
built
1980
5080 Brookestone Dr NE, Rockford, MI 49341
$-381
Cash flow
-5.0%
Cash-on-Cash Return
5.0%
Cap rate
0.7%
Rent to Value Ratio
Active
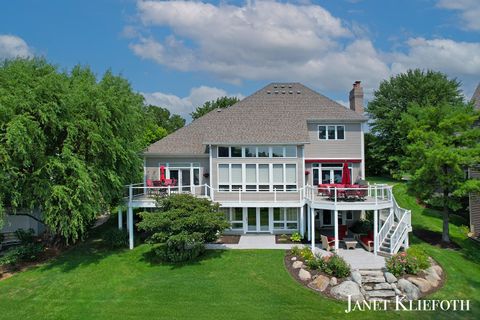
$650,000
4
bds
|
3
ba
|
2,081
sqft
|
built
1986
6130 Ramsdell Dr NE, Rockford, MI 49341
$-1,774
Cash flow
-14.2%
Cash-on-Cash Return
2.9%
Cap rate
0.5%
Rent to Value Ratio
Active
$769,000
4
bds
|
5
ba
|
4,000
sqft
|
built
2005
5189 Bonasa Dr NE, Rockford, MI 49341
$-2,184
Cash flow
-14.8%
Cash-on-Cash Return
2.7%
Cap rate
0.5%
Rent to Value Ratio
Active
$1,700,000
4
bds
|
4
ba
|
4,262
sqft
|
built
1990
7230 Cuesta Way Dr NE, Rockford, MI 49341
$-5,422
Cash flow
-16.6%
Cash-on-Cash Return
2.3%
Cap rate
0.4%
Rent to Value Ratio
Active
$289,900
2
bds
|
1
ba
|
736
sqft
|
built
1950
335 Lewis St, Rockford, MI 49341
$-374
Cash flow
-6.7%
Cash-on-Cash Return
4.6%
Cap rate
0.7%
Rent to Value Ratio
Active
$659,000
3
bds
|
2
ba
|
1,901
sqft
|
built
2023
4883 Honeycrisp Dr, Rockford, MI 49341
$-876
Cash flow
-6.9%
Cash-on-Cash Return
4.6%
Cap rate
0.6%
Rent to Value Ratio
Active
$875,000
4
bds
|
4
ba
|
3,320
sqft
|
built
1964
7878 Northland Dr NE, Rockford, MI 49341
$-2,573
Cash flow
-15.3%
Cash-on-Cash Return
2.6%
Cap rate
0.4%
Rent to Value Ratio

Active
$1,550,000
4
bds
|
4
ba
|
4,045
sqft
|
built
1995
8311 Rum Creek Trl NE, Rockford, MI 49341
$-6,286
Cash flow
-21.2%
Cash-on-Cash Return
1.3%
Cap rate
0.3%
Rent to Value Ratio
Active
$569,900
4
bds
|
4
ba
|
2,782
sqft
|
built
1998
3549 Golden Rdg NE, Rockford, MI 49341
$-1,159
Cash flow
-10.6%
Cash-on-Cash Return
3.7%
Cap rate
0.6%
Rent to Value Ratio

Active
$515,000
4
bds
|
4
ba
|
2,912
sqft
|
built
1996
2388 Sawmill Dr NE, Rockford, MI 49341
$-1,141
Cash flow
-11.6%
Cash-on-Cash Return
3.5%
Cap rate
0.6%
Rent to Value Ratio

Active
$850,000
3
bds
|
3
ba
|
4,266
sqft
|
built
2005
3698 River Isle Ct NE, Rockford, MI 49341
$-1,448
Cash flow
-8.9%
Cash-on-Cash Return
4.1%
Cap rate
0.7%
Rent to Value Ratio

Active
$539,900
4
bds
|
4
ba
|
3,437
sqft
|
built
1999
3879 Fraser St NE, Rockford, MI 49341
$-1,048
Cash flow
-10.1%
Cash-on-Cash Return
3.8%
Cap rate
0.6%
Rent to Value Ratio
Active
$449,900
4
bds
|
3
ba
|
2,538
sqft
|
built
2004
516 Rock Hollow Dr NE, Rockford, MI 49341
$-905
Cash flow
-10.5%
Cash-on-Cash Return
3.7%
Cap rate
0.7%
Rent to Value Ratio

Active
$420,000
2
bds
|
3
ba
|
1,966
sqft
|
built
1984
6673 Bella Vista Dr NE, Rockford, MI 49341
$-1,241
Cash flow
-15.4%
Cash-on-Cash Return
2.6%
Cap rate
0.5%
Rent to Value Ratio

Active
$499,000
3
bds
|
4
ba
|
2,414
sqft
|
built
1988
3493 Riverwoods Dr NE, Rockford, MI 49341
$-1,195
Cash flow
-12.5%
Cash-on-Cash Return
3.3%
Cap rate
0.5%
Rent to Value Ratio
Active
$425,000
4
bds
|
3
ba
|
2,156
sqft
|
built
1997
8393 Courtland Dr NE, Rockford, MI 49341
$-650
Cash flow
-8.0%
Cash-on-Cash Return
4.3%
Cap rate
0.6%
Rent to Value Ratio

Active
$350,000
3
bds
|
2
ba
|
2,308
sqft
|
built
1970
3395 Thistle Dhu Dr NE, Rockford, MI 49341
$-405
Cash flow
-6.0%
Cash-on-Cash Return
4.8%
Cap rate
0.7%
Rent to Value Ratio
Active
$325,000
3
bds
|
2
ba
|
1,352
sqft
|
built
1983
139 Highland View Ct NE, Rockford, MI 49341
$-285
Cash flow
-4.6%
Cash-on-Cash Return
5.1%
Cap rate
0.6%
Rent to Value Ratio

Active
$275,000
3
bds
|
2
ba
|
1,072
sqft
|
built
1940
336 Lewis St, Rockford, MI 49341
$-271
Cash flow
-5.1%
Cash-on-Cash Return
5.0%
Cap rate
0.7%
Rent to Value Ratio
Active
$199,000
1
bds
|
1
ba
|
849
sqft
|
built
1995
171 Hunters Ln NE, Rockford, MI 49341
$-428
Cash flow
-11.2%
Cash-on-Cash Return
3.6%
Cap rate
0.7%
Rent to Value Ratio
Active
$585,000
5
bds
|
3
ba
|
3,473
sqft
|
built
2019
7385 14 Mile Rd NE, Rockford, MI 49341
$-1,454
Cash flow
-13.0%
Cash-on-Cash Return
3.2%
Cap rate
0.5%
Rent to Value Ratio

Active
$425,000
3
bds
|
3
ba
|
1,641
sqft
|
built
2009
9020 Nature Meadows Dr NE, Rockford, MI 49341
$-788
Cash flow
-9.7%
Cash-on-Cash Return
3.9%
Cap rate
0.6%
Rent to Value Ratio
Active
$575,000
5
bds
|
4
ba
|
3,055
sqft
|
built
2022
459 Park Place Dr NE, Rockford, MI 49341
$-1,371
Cash flow
-12.4%
Cash-on-Cash Return
3.3%
Cap rate
0.6%
Rent to Value Ratio
Active
$424,000
4
bds
|
2
ba
|
1,869
sqft
|
built
1963
6040 10 Mile Rd NE, Rockford, MI 49341
$-924
Cash flow
-11.4%
Cash-on-Cash Return
3.5%
Cap rate
0.6%
Rent to Value Ratio
Active
$475,000
5
bds
|
4
ba
|
3,125
sqft
|
built
1995
7482 Decosta Dr NE, Rockford, MI 49341
$-684
Cash flow
-7.5%
Cash-on-Cash Return
4.4%
Cap rate
0.7%
Rent to Value Ratio
Active
$490,000
3
bds
|
4
ba
|
2,222
sqft
|
built
2003
11080 Angel Pond Dr NE, Rockford, MI 49341
$-827
Cash flow
-8.8%
Cash-on-Cash Return
4.1%
Cap rate
0.5%
Rent to Value Ratio
Active
$550,000
3
bds
|
3
ba
|
2,728
sqft
|
built
1981
9555 Whittall St NE, Rockford, MI 49341
$-991
Cash flow
-9.4%
Cash-on-Cash Return
4.0%
Cap rate
0.6%
Rent to Value Ratio

Active
$539,900
4
bds
|
4
ba
|
2,830
sqft
|
built
2008
9030 Elstner Ave NE, Rockford, MI 49341
$-1,254
Cash flow
-12.1%
Cash-on-Cash Return
3.4%
Cap rate
0.5%
Rent to Value Ratio

Active
$475,000
3
bds
|
3
ba
|
2,623
sqft
|
built
1996
6824 Hermoso Ct NE, Rockford, MI 49341
$-697
Cash flow
-7.7%
Cash-on-Cash Return
4.4%
Cap rate
0.7%
Rent to Value Ratio
Active
$525,000
4
bds
|
4
ba
|
5,263
sqft
|
built
2001
150 Glen Carin Dr NE, Rockford, MI 49341
$-1,033
Cash flow
-10.3%
Cash-on-Cash Return
3.8%
Cap rate
0.6%
Rent to Value Ratio

Active
$1,450,000
5
bds
|
4
ba
|
4,006
sqft
|
built
1991
6574 Gran Via Dr NE, Rockford, MI 49341
$-5,392
Cash flow
-19.4%
Cash-on-Cash Return
1.7%
Cap rate
0.3%
Rent to Value Ratio

Active
$320,000
3
bds
|
2
ba
|
1,104
sqft
|
built
1927
350 Adolph St, Rockford, MI 49341
$-539
Cash flow
-8.8%
Cash-on-Cash Return
4.1%
Cap rate
0.8%
Rent to Value Ratio
Active
$664,000
3
bds
|
3
ba
|
2,765
sqft
|
built
2000
6817 Martin View St NE, Rockford, MI 49341
$-1,638
Cash flow
-12.9%
Cash-on-Cash Return
3.2%
Cap rate
0.5%
Rent to Value Ratio
Active
$1,420,000
4
bds
|
5
ba
|
3,850
sqft
|
built
2011
7217 Davies Dr NE, Rockford, MI 49341
$-3,835
Cash flow
-14.1%
Cash-on-Cash Return
2.9%
Cap rate
0.4%
Rent to Value Ratio