49460 Investment Properties for Sale
Browse homes for sale and investment properties in 49460. Refine your search by price, property type, or more.
Best cash flowing properties in 49460

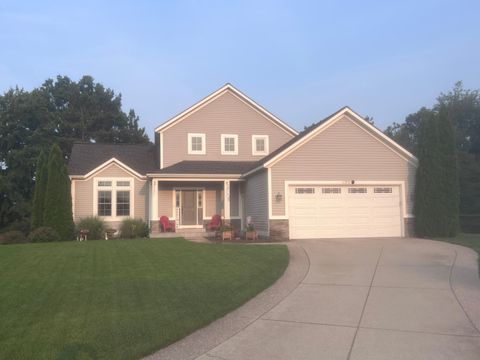
Active
$410,000
3
bds
|
3
ba
|
1,680
sqft
|
built
2019
14571 Bigleaf Dr, West Olive, MI 49460
$-500
Cash flow
-6.4%
Cash-on-Cash Return
4.7%
Cap rate
0.7%
Rent to Value Ratio

Active
$424,900
4
bds
|
3
ba
|
1,773
sqft
|
built
1977
15991 Croswell St, West Olive, MI 49460
$-603
Cash flow
-7.4%
Cash-on-Cash Return
4.4%
Cap rate
0.6%
Rent to Value Ratio
15 out of 17 properties for sale in 49460
Limited Results Shown
Create a free account, or log in to reveal all property listings and enjoy the complete experience.

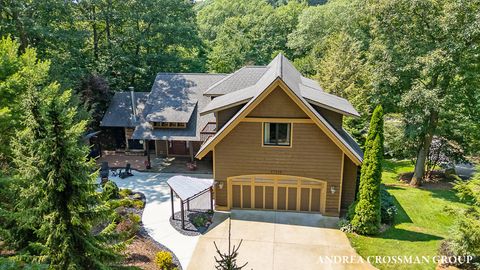
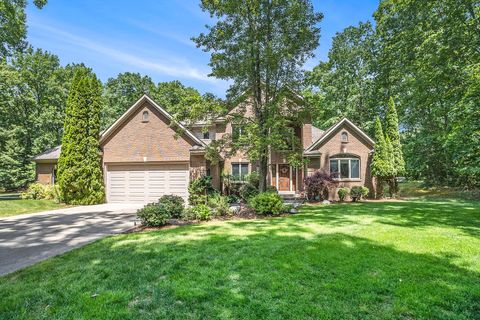
Active
$899,000
4
bds
|
3
ba
|
2,118
sqft
|
built
1977
9410 Whispering Sands Dr, West Olive, MI 49460
$-2,597
Cash flow
-15.1%
Cash-on-Cash Return
2.7%
Cap rate
0.5%
Rent to Value Ratio
Active
$950,000
3
bds
|
3
ba
|
3,234
sqft
|
built
2007
17110 Pimento Hl, West Olive, MI 49460
$-2,788
Cash flow
-15.3%
Cash-on-Cash Return
2.6%
Cap rate
0.4%
Rent to Value Ratio

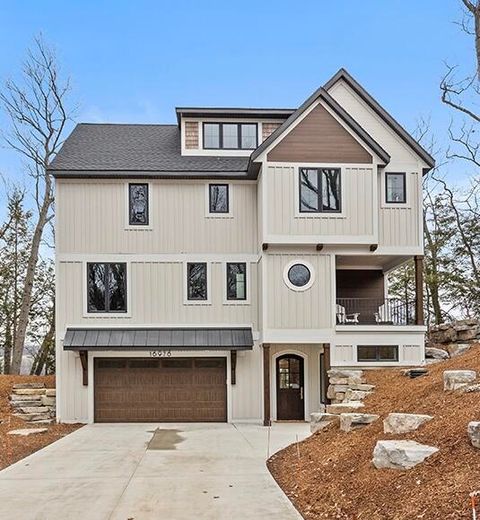
Active
$799,000
4
bds
|
3
ba
|
3,126
sqft
|
built
2018
16964 Fillmore St, West Olive, MI 49460
$-2,786
Cash flow
-18.2%
Cash-on-Cash Return
2.0%
Cap rate
0.3%
Rent to Value Ratio
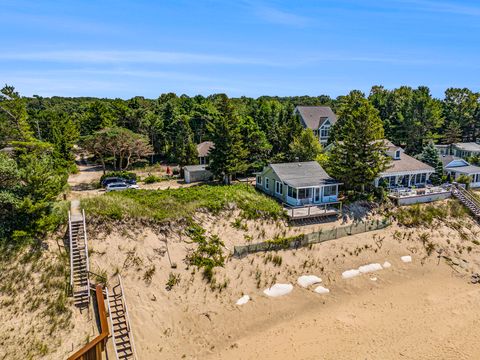
Active
$995,000
2
bds
|
1
ba
|
864
sqft
|
built
1935
10589 Lakeshore Dr, West Olive, MI 49460
$-3,797
Cash flow
-19.9%
Cash-on-Cash Return
1.6%
Cap rate
0.3%
Rent to Value Ratio
Active
$2,375,000
5
bds
|
6
ba
|
3,629
sqft
|
built
2023
16976 Lake Ave, West Olive, MI 49460
$-9,109
Cash flow
-20.0%
Cash-on-Cash Return
1.5%
Cap rate
0.3%
Rent to Value Ratio
Active
$624,900
5
bds
|
4
ba
|
3,086
sqft
|
built
2007
9355 Windward Dr, West Olive, MI 49460
$-1,300
Cash flow
-10.9%
Cash-on-Cash Return
3.7%
Cap rate
0.6%
Rent to Value Ratio
Active
$1,397,500
6
bds
|
5
ba
|
5,494
sqft
|
built
2002
17055 Forest Lake Dr, West Olive, MI 49460
$-4,806
Cash flow
-17.9%
Cash-on-Cash Return
2.0%
Cap rate
0.3%
Rent to Value Ratio
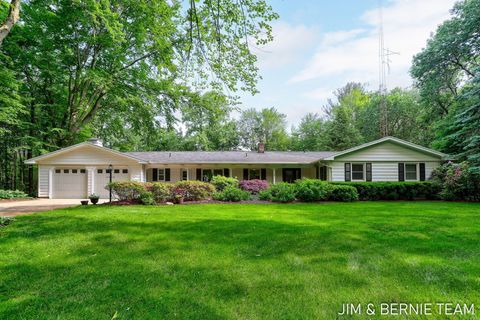
Active
$629,900
5
bds
|
4
ba
|
3,688
sqft
|
built
1969
8518 146th Ave, West Olive, MI 49460
$-1,450
Cash flow
-12.0%
Cash-on-Cash Return
3.4%
Cap rate
0.5%
Rent to Value Ratio
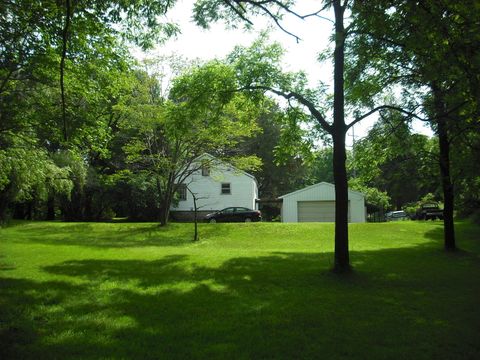
Active
$1,099,000
1
bds
|
1
ba
|
676
sqft
|
built
1945
17078 Lake Michigan Dr, West Olive, MI 49460
$-4,375
Cash flow
-20.8%
Cash-on-Cash Return
1.4%
Cap rate
0.2%
Rent to Value Ratio
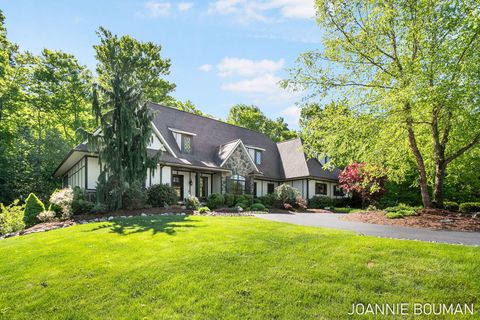
Active
$949,900
5
bds
|
5
ba
|
4,113
sqft
|
built
2010
15611 River Woods, West Olive, MI 49460
$-3,196
Cash flow
-17.6%
Cash-on-Cash Return
2.1%
Cap rate
0.4%
Rent to Value Ratio
Active
$1,355,000
5
bds
|
6
ba
|
6,732
sqft
|
built
2006
10543 Lakeshore Dr, West Olive, MI 49460
$-4,816
Cash flow
-18.5%
Cash-on-Cash Return
1.9%
Cap rate
0.3%
Rent to Value Ratio

Active
$774,499
4
bds
|
4
ba
|
3,027
sqft
|
built
1995
8894 Lakeshore Dr, West Olive, MI 49460
$-1,879
Cash flow
-12.7%
Cash-on-Cash Return
3.2%
Cap rate
0.5%
Rent to Value Ratio
Active
$809,900
4
bds
|
4
ba
|
4,331
sqft
|
built
1993
6340 Butternut Dr, West Olive, MI 49460
$-2,230
Cash flow
-14.4%
Cash-on-Cash Return
2.8%
Cap rate
0.6%
Rent to Value Ratio