49546 Investment Properties for Sale
Browse homes for sale and investment properties in 49546. Refine your search by price, property type, or more.
Best cash flowing properties in 49546
Active
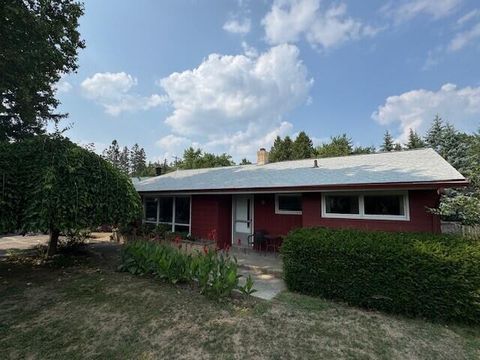
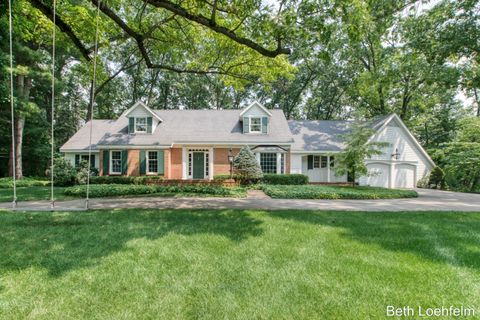
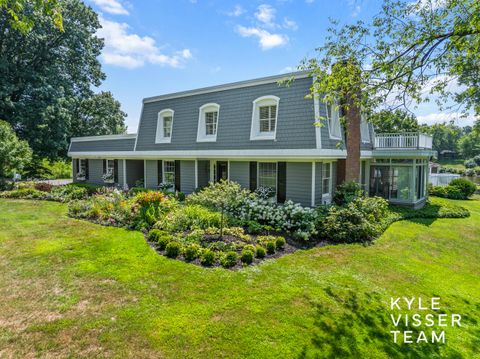
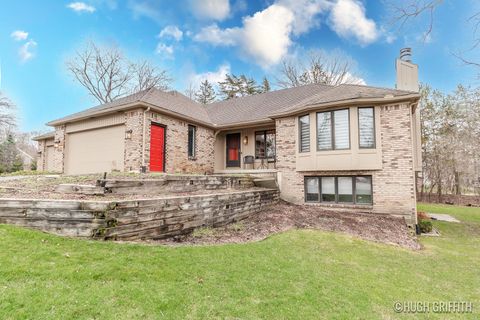
$349,900
3
bds
|
2
ba
|
2,606
sqft
|
built
1961
3447 Fulton St E, Grand Rapids, MI 49546
$-101
Cash flow
-1.5%
Cash-on-Cash Return
5.8%
Cap rate
0.8%
Rent to Value Ratio
Active
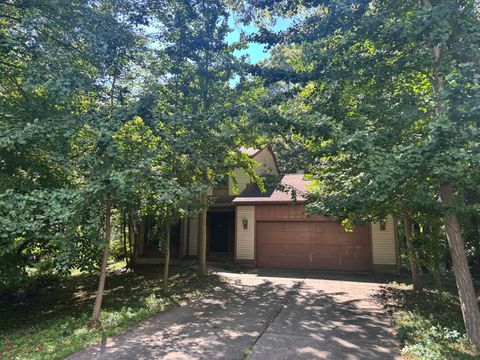
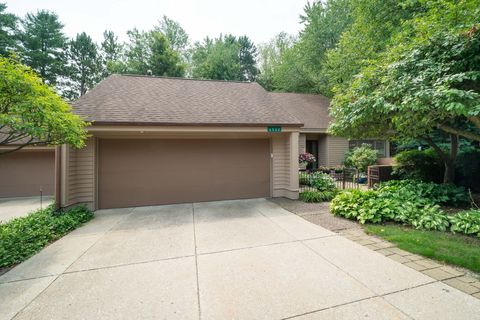
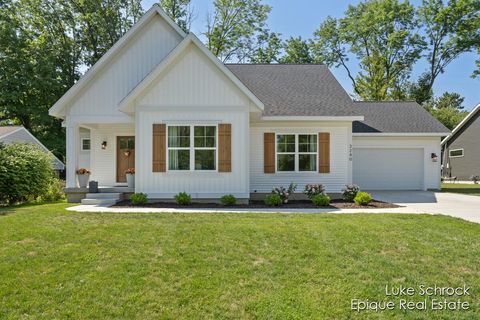
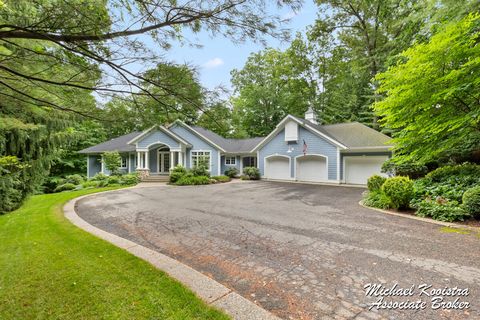
$379,000
3
bds
|
2
ba
|
1,416
sqft
|
built
1987
1131 Fernridge Ave SE, Grand Rapids, MI 49546
$-255
Cash flow
-3.5%
Cash-on-Cash Return
5.3%
Cap rate
0.7%
Rent to Value Ratio
30 out of 34 properties for sale in 49546
Limited Results Shown
Create a free account, or log in to reveal all property listings and enjoy the complete experience.

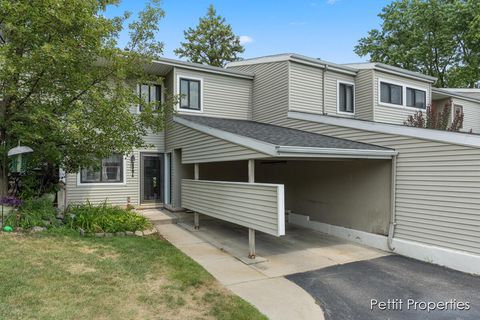
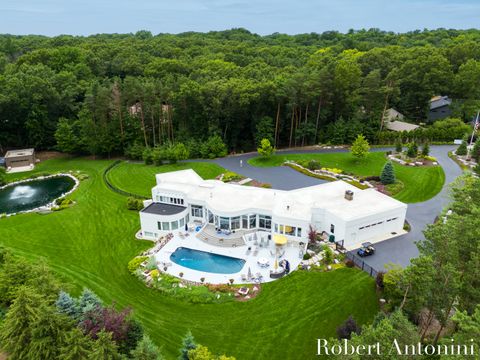
Active
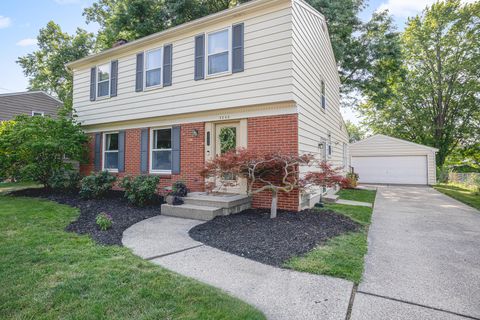
$495,000
4
bds
|
3
ba
|
2,484
sqft
|
built
1972
6565 Tanglewood Dr SE, Grand Rapids, MI 49546
$-921
Cash flow
-9.7%
Cash-on-Cash Return
3.9%
Cap rate
0.6%
Rent to Value Ratio

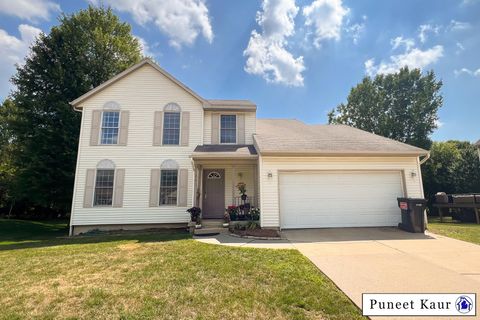
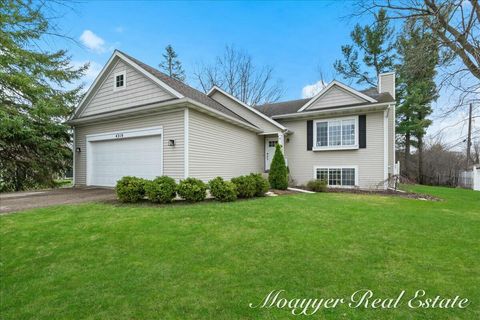
Active
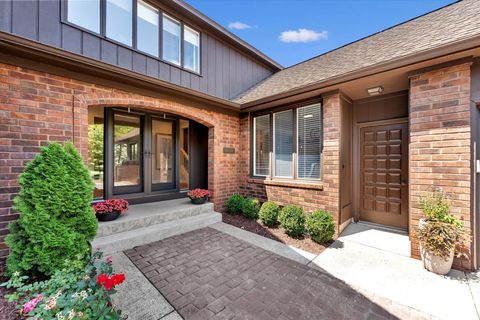
$849,900
4
bds
|
4
ba
|
4,178
sqft
|
built
2020
2726 Orange Ave SE, Grand Rapids, MI 49546
$-2,074
Cash flow
-12.7%
Cash-on-Cash Return
3.2%
Cap rate
0.6%
Rent to Value Ratio

Active
$325,000
2
bds
|
2
ba
|
1,325
sqft
|
built
1954
4239 Westchester Dr SE, Grand Rapids, MI 49546
$-515
Cash flow
-8.3%
Cash-on-Cash Return
4.2%
Cap rate
0.6%
Rent to Value Ratio

Active
$325,000
4
bds
|
3
ba
|
1,611
sqft
|
built
1988
2743 Mulford Dr SE, Grand Rapids, MI 49546
$-696
Cash flow
-11.2%
Cash-on-Cash Return
3.6%
Cap rate
0.7%
Rent to Value Ratio

Active
$750,000
5
bds
|
4
ba
|
3,901
sqft
|
built
1996
38 S Bridgestone Ct NE, Grand Rapids, MI 49546
$-1,627
Cash flow
-11.3%
Cash-on-Cash Return
3.5%
Cap rate
0.5%
Rent to Value Ratio
Active
$249,900
3
bds
|
3
ba
|
1,574
sqft
|
built
1976
2984 Chapshire Dr SE, Grand Rapids, MI 49546
$-507
Cash flow
-10.6%
Cash-on-Cash Return
3.7%
Cap rate
0.8%
Rent to Value Ratio
Active
$499,000
5
bds
|
4
ba
|
2,916
sqft
|
built
1999
2242 Christine Ct SE, Grand Rapids, MI 49546
$-1,148
Cash flow
-12.0%
Cash-on-Cash Return
3.4%
Cap rate
0.6%
Rent to Value Ratio

Active
$435,000
4
bds
|
3
ba
|
2,620
sqft
|
built
1999
3729 Windshire Dr SE, Grand Rapids, MI 49546
$-767
Cash flow
-9.2%
Cash-on-Cash Return
4.0%
Cap rate
0.7%
Rent to Value Ratio
Active
$998,000
5
bds
|
5
ba
|
5,456
sqft
|
built
1981
1661 Mont Rue Dr SE, Grand Rapids, MI 49546
$-2,860
Cash flow
-15.0%
Cash-on-Cash Return
2.7%
Cap rate
0.4%
Rent to Value Ratio

Active
$539,900
4
bds
|
3
ba
|
2,704
sqft
|
built
1969
476 Carnoustie Ave SE, Grand Rapids, MI 49546
$-1,075
Cash flow
-10.4%
Cash-on-Cash Return
3.8%
Cap rate
0.5%
Rent to Value Ratio
Active
$475,000
2
bds
|
3
ba
|
3,013
sqft
|
built
1982
6562 Glaston Ct SE, Grand Rapids, MI 49546
$-1,539
Cash flow
-16.9%
Cash-on-Cash Return
2.3%
Cap rate
0.5%
Rent to Value Ratio
Active
$465,000
3
bds
|
3
ba
|
2,173
sqft
|
built
1963
2245 Ridgewood Ave SE, Grand Rapids, MI 49546
$-950
Cash flow
-10.7%
Cash-on-Cash Return
3.7%
Cap rate
0.6%
Rent to Value Ratio
Active
$625,000
2
bds
|
3
ba
|
2,676
sqft
|
built
1977
3139 Middlegate Dr SE, Grand Rapids, MI 49546
$-1,832
Cash flow
-15.3%
Cash-on-Cash Return
2.6%
Cap rate
0.6%
Rent to Value Ratio
Active
$1,490,000
4
bds
|
3
ba
|
3,878
sqft
|
built
1977
4090 Fulton St E, Grand Rapids, MI 49546
$-5,751
Cash flow
-20.1%
Cash-on-Cash Return
1.5%
Cap rate
0.2%
Rent to Value Ratio

Active
$525,000
4
bds
|
4
ba
|
2,042
sqft
|
built
2001
4496 Shiloh Way Dr SE, Grand Rapids, MI 49546
$-1,305
Cash flow
-13.0%
Cash-on-Cash Return
3.2%
Cap rate
0.5%
Rent to Value Ratio

Active
$469,000
3
bds
|
3
ba
|
2,212
sqft
|
built
1978
6968 Cimarron Dr SE, Grand Rapids, MI 49546
$-886
Cash flow
-9.9%
Cash-on-Cash Return
3.9%
Cap rate
0.6%
Rent to Value Ratio

Active
$469,000
3
bds
|
2
ba
|
1,731
sqft
|
built
1952
7177 Thorncrest Dr SE, Grand Rapids, MI 49546
$-804
Cash flow
-8.9%
Cash-on-Cash Return
4.1%
Cap rate
0.6%
Rent to Value Ratio
Active
$599,000
3
bds
|
3
ba
|
2,200
sqft
|
built
2023
3240 Midland Dr SE, Grand Rapids, MI 49546
$-1,792
Cash flow
-15.6%
Cash-on-Cash Return
2.6%
Cap rate
0.4%
Rent to Value Ratio

Active
$1,450,000
4
bds
|
4
ba
|
4,061
sqft
|
built
2014
1641 Thornapple River Dr SE, Grand Rapids, MI 49546
$-5,134
Cash flow
-18.5%
Cash-on-Cash Return
1.9%
Cap rate
0.3%
Rent to Value Ratio
Active
$2,445,000
4
bds
|
5
ba
|
7,228
sqft
|
built
1987
1835 Linson Ct SE, Grand Rapids, MI 49546
$-7,891
Cash flow
-16.8%
Cash-on-Cash Return
2.3%
Cap rate
0.3%
Rent to Value Ratio

Active
$719,900
5
bds
|
4
ba
|
3,729
sqft
|
built
1975
2605 Shadowbrook Dr SE, Grand Rapids, MI 49546
$-1,585
Cash flow
-11.5%
Cash-on-Cash Return
3.5%
Cap rate
0.6%
Rent to Value Ratio

Active
$365,000
2
bds
|
3
ba
|
1,309
sqft
|
built
2021
2519 Inverness Rd SE, Grand Rapids, MI 49546
$-668
Cash flow
-9.5%
Cash-on-Cash Return
4.0%
Cap rate
0.8%
Rent to Value Ratio

Active
$399,900
4
bds
|
3
ba
|
2,068
sqft
|
built
1950
1145 Eastmont Dr SE, Grand Rapids, MI 49546
$-493
Cash flow
-6.4%
Cash-on-Cash Return
4.7%
Cap rate
0.6%
Rent to Value Ratio

Active
$324,900
3
bds
|
2
ba
|
1,624
sqft
|
built
1975
1150 Farnsworth Ave SE, Grand Rapids, MI 49546
$-471
Cash flow
-7.6%
Cash-on-Cash Return
4.4%
Cap rate
0.6%
Rent to Value Ratio
Active
$475,000
5
bds
|
3
ba
|
2,418
sqft
|
built
2002
4310 Heather Ln SE, Grand Rapids, MI 49546
$-898
Cash flow
-9.9%
Cash-on-Cash Return
3.9%
Cap rate
0.6%
Rent to Value Ratio
Active
$525,000
3
bds
|
3
ba
|
2,410
sqft
|
built
1987
2376 Bob White Ct SE, Grand Rapids, MI 49546
$-1,864
Cash flow
-18.5%
Cash-on-Cash Return
1.9%
Cap rate
0.5%
Rent to Value Ratio
Active
$1,695,000
4
bds
|
5
ba
|
5,218
sqft
|
built
1998
6862 Maplecrest Dr SE, Grand Rapids, MI 49546
$-6,961
Cash flow
-21.4%
Cash-on-Cash Return
1.2%
Cap rate
0.3%
Rent to Value Ratio

Active
$895,000
4
bds
|
3
ba
|
3,284
sqft
|
built
1985
610 Cascade Hills Holw SE, Grand Rapids, MI 49546
$-2,651
Cash flow
-15.5%
Cash-on-Cash Return
2.6%
Cap rate
0.5%
Rent to Value Ratio