52802 Investment Properties for Sale
Browse homes for sale and investment properties in 52802. Refine your search by price, property type, or more.
Best cash flowing properties in 52802
Active
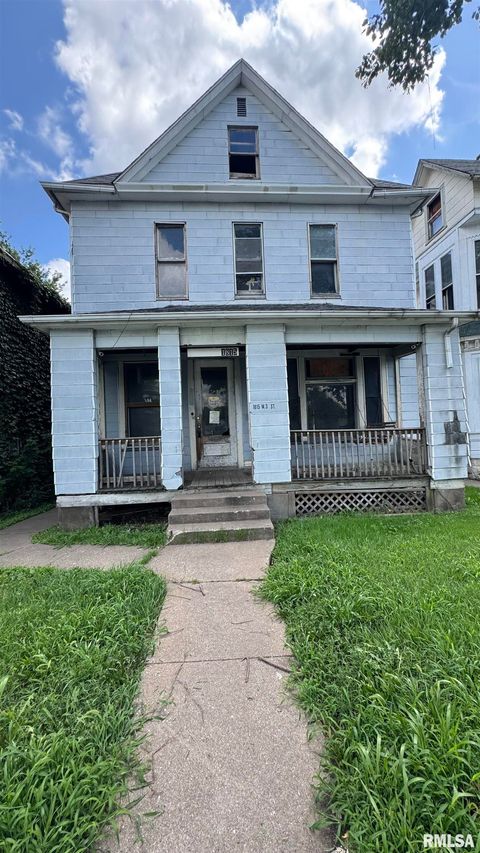
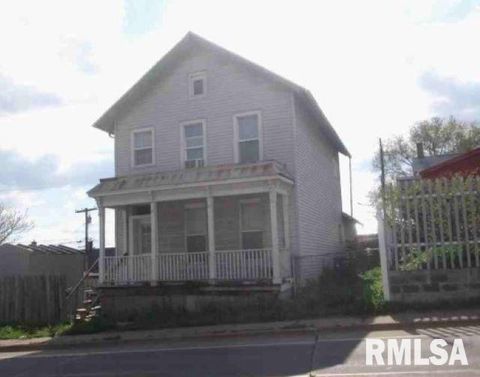
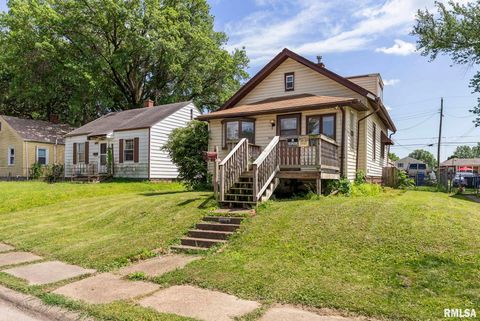
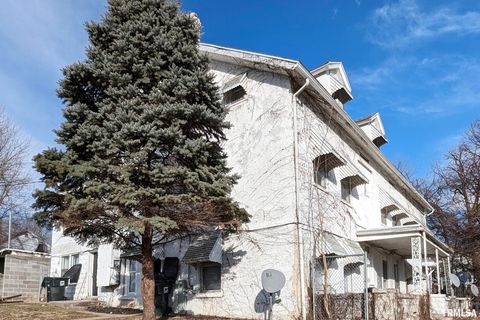
$44,900
5
bds
|
2
ba
|
2,282
sqft
|
built
1918
1815 W 3rd St, Davenport, IA 52802
$994
Cash flow
25.8%
Cash-on-Cash Return
26.6%
Cap rate
3.6%
Rent to Value Ratio
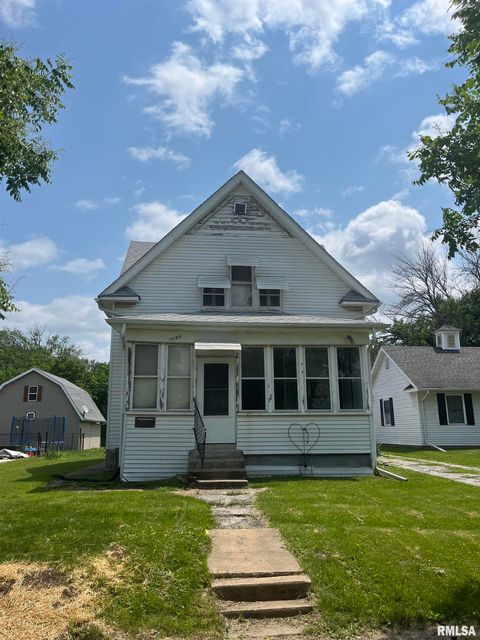
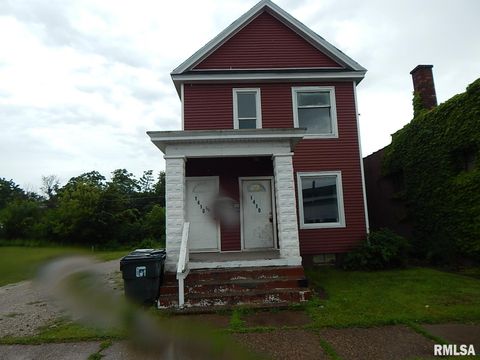
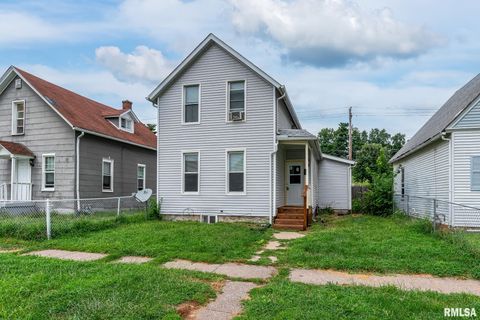
Active
$65,000
2
bds
|
2
ba
|
1,288
sqft
|
built
1914
1109 S Michigan Ave, Davenport, IA 52802
$735
Cash flow
13.2%
Cash-on-Cash Return
13.6%
Cap rate
2.0%
Rent to Value Ratio
23 out of 28 properties for sale in 52802
Limited Results Shown
Create a free account, or log in to reveal all property listings and enjoy the complete experience.
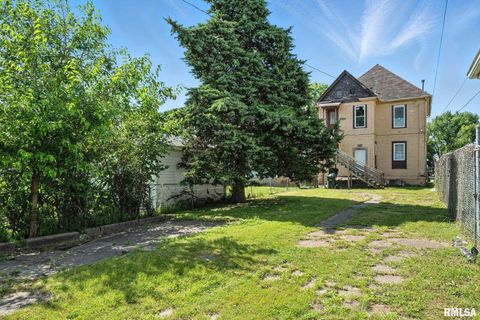
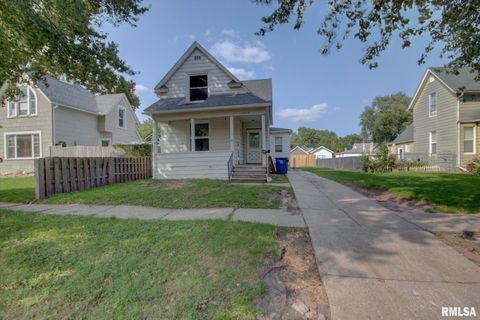
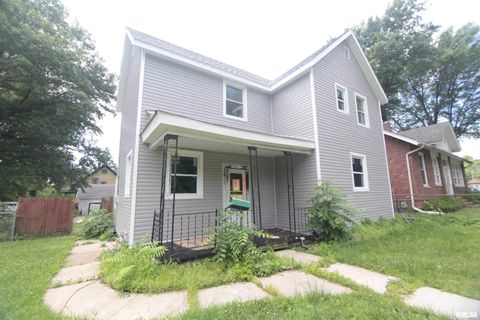
Active
$42,500
4
bds
|
0
ba
|
0
sqft
|
built
1900
1614 W 3rd St, Davenport, IA 52802
$627
Cash flow
17.2%
Cash-on-Cash Return
17.7%
Cap rate
2.4%
Rent to Value Ratio
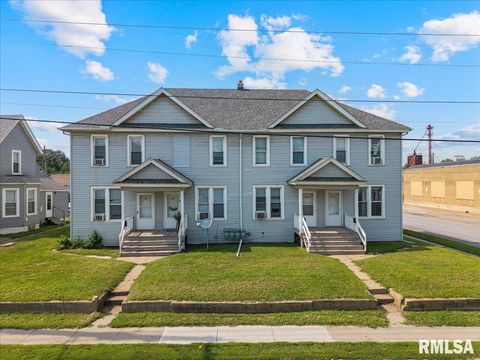
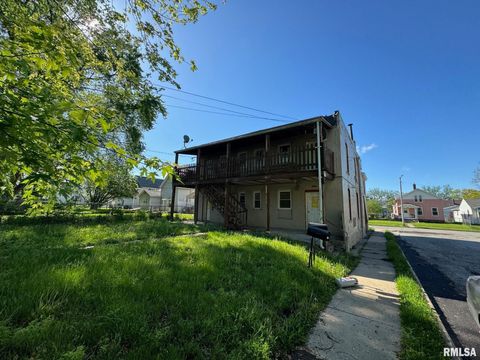
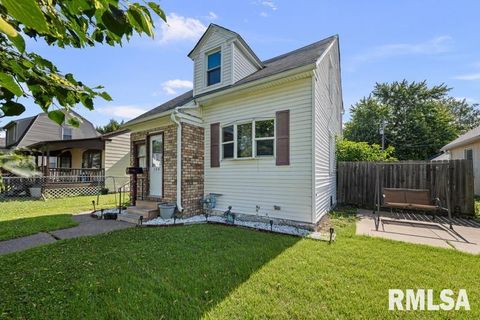
Active
$250,000
bds
|
0
ba
|
0
sqft
|
built
1904
2502 Rockingham Rd, Davenport, IA 52802
$-393
Cash flow
-8.2%
Cash-on-Cash Return
3.8%
Cap rate
0.6%
Rent to Value Ratio
Active
$239,000
bds
|
0
ba
|
0
sqft
|
built
1900
910 W 3rd St, Davenport, IA 52802
$-394
Cash flow
-8.6%
Cash-on-Cash Return
3.7%
Cap rate
0.6%
Rent to Value Ratio
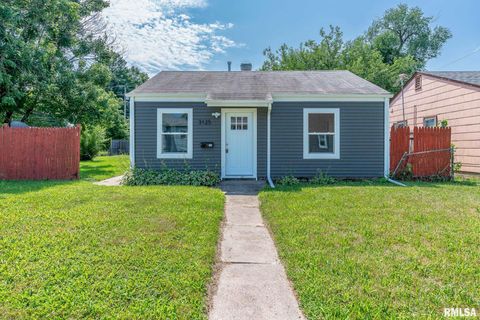
Active
$116,900
2
bds
|
1
ba
|
768
sqft
|
built
1953
3125 Pearl Ave, Davenport, IA 52802
$41
Cash flow
1.8%
Cash-on-Cash Return
6.1%
Cap rate
0.9%
Rent to Value Ratio
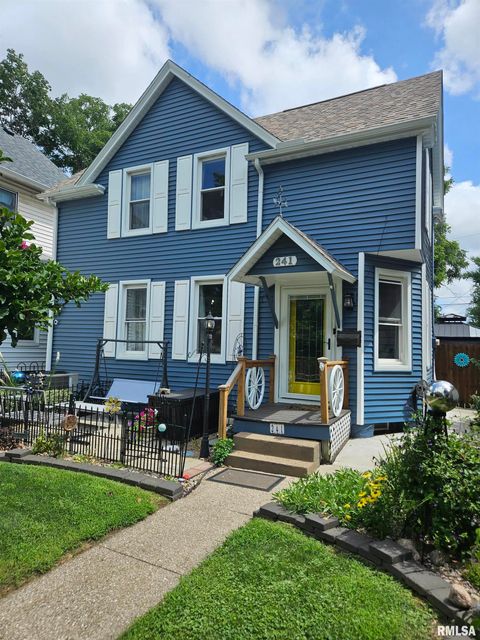
Active
$124,900
3
bds
|
1
ba
|
1,027
sqft
|
built
1900
241 S Lincoln Ave, Davenport, IA 52802
$105
Cash flow
4.4%
Cash-on-Cash Return
6.7%
Cap rate
0.9%
Rent to Value Ratio

Active
$129,900
2
bds
|
2
ba
|
1,286
sqft
|
built
1950
714 S Fairmount St, Davenport, IA 52802
$137
Cash flow
5.5%
Cash-on-Cash Return
6.9%
Cap rate
1.0%
Rent to Value Ratio
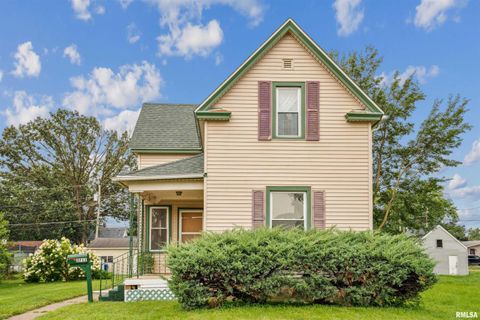
Active
$145,000
3
bds
|
1
ba
|
1,042
sqft
|
built
1895
3711 Pearl Ave, Davenport, IA 52802
$-136
Cash flow
-4.9%
Cash-on-Cash Return
4.6%
Cap rate
0.7%
Rent to Value Ratio
Active
$64,680
3
bds
|
1
ba
|
1,563
sqft
|
built
1900
422 N Marquette St, Davenport, IA 52802
$571
Cash flow
10.3%
Cash-on-Cash Return
10.6%
Cap rate
1.7%
Rent to Value Ratio
Active
$130,000
3
bds
|
2
ba
|
1,324
sqft
|
built
1894
2312 W 1st St, Davenport, IA 52802
$230
Cash flow
9.2%
Cash-on-Cash Return
7.8%
Cap rate
1.1%
Rent to Value Ratio
Active
$79,900
2
bds
|
1
ba
|
600
sqft
|
built
1942
3116 Orchard Ave, Davenport, IA 52802
$162
Cash flow
10.6%
Cash-on-Cash Return
8.1%
Cap rate
1.1%
Rent to Value Ratio
Active
$75,000
bds
|
0
ba
|
0
sqft
|
built
1900
2024 W 6th St, Davenport, IA 52802
$258
Cash flow
17.9%
Cash-on-Cash Return
9.8%
Cap rate
1.7%
Rent to Value Ratio
Active
$86,500
2
bds
|
1
ba
|
1,540
sqft
|
built
1920
3609 Boies Ave, Davenport, IA 52802
$91
Cash flow
5.5%
Cash-on-Cash Return
6.9%
Cap rate
1.0%
Rent to Value Ratio
Active
$75,000
4
bds
|
0
ba
|
0
sqft
|
built
1920
1410 W 4th St, Davenport, IA 52802
$344
Cash flow
23.9%
Cash-on-Cash Return
11.2%
Cap rate
1.5%
Rent to Value Ratio
Active
$43,000
3
bds
|
1
ba
|
1,408
sqft
|
built
1924
2243 W 4th St, Davenport, IA 52802
$699
Cash flow
18.9%
Cash-on-Cash Return
19.5%
Cap rate
2.8%
Rent to Value Ratio
Active
$124,900
2
bds
|
1
ba
|
942
sqft
|
built
1918
129 S Birchwood Ave, Davenport, IA 52802
$112
Cash flow
4.7%
Cash-on-Cash Return
6.8%
Cap rate
1.0%
Rent to Value Ratio
Active
$105,000
2
bds
|
0
ba
|
0
sqft
|
built
1920
2349 W 2nd St, Davenport, IA 52802
$-111
Cash flow
-5.5%
Cash-on-Cash Return
4.4%
Cap rate
0.7%
Rent to Value Ratio
Active
$145,000
4
bds
|
2
ba
|
1,472
sqft
|
built
1895
2614 Mc Kinley Ave, Davenport, IA 52802
$-37
Cash flow
-1.3%
Cash-on-Cash Return
5.4%
Cap rate
0.8%
Rent to Value Ratio
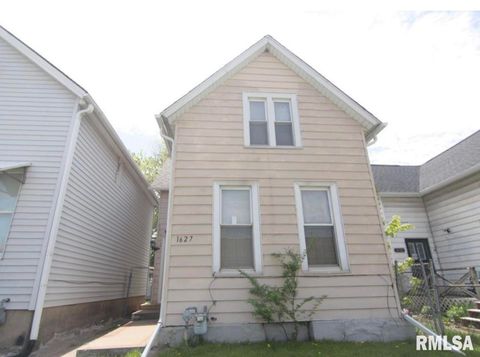
Active
$95,000
2
bds
|
1
ba
|
988
sqft
|
built
1900
1627 W 4th St, Davenport, IA 52802
$169
Cash flow
9.3%
Cash-on-Cash Return
7.8%
Cap rate
1.1%
Rent to Value Ratio
Active
$1,200,000
5
bds
|
3
ba
|
3,244
sqft
|
built
1910
5418 Chapel Hill Rd, Davenport, IA 52802
$-3,721
Cash flow
-16.2%
Cash-on-Cash Return
2.0%
Cap rate
0.3%
Rent to Value Ratio
Active
$225,000
10
bds
|
0
ba
|
0
sqft
|
built
1861
832 W 8th St, Davenport, IA 52802
$-347
Cash flow
-8.0%
Cash-on-Cash Return
3.8%
Cap rate
0.6%
Rent to Value Ratio
Active
$127,000
3
bds
|
1
ba
|
1,140
sqft
|
built
1900
1824 W 8th St, Davenport, IA 52802
$94
Cash flow
3.9%
Cash-on-Cash Return
6.6%
Cap rate
0.9%
Rent to Value Ratio