52803 Investment Properties for Sale
Browse homes for sale and investment properties in 52803. Refine your search by price, property type, or more.
Best cash flowing properties in 52803
Active
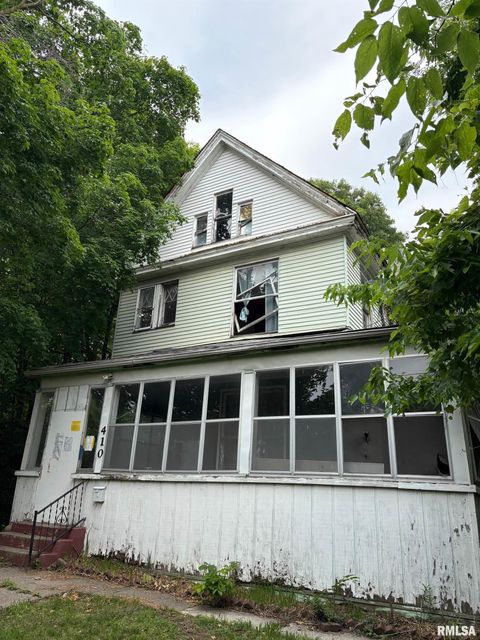
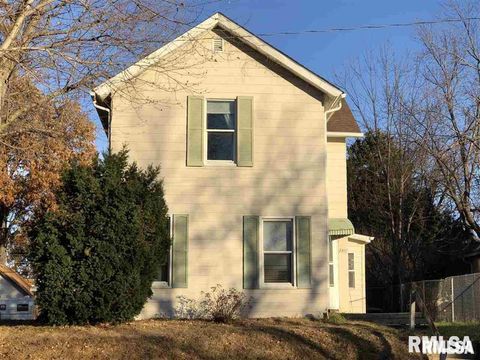
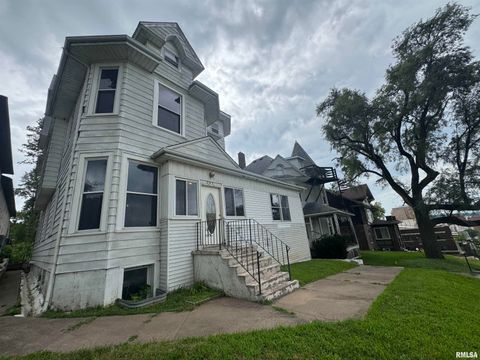
$22,500
3
bds
|
2
ba
|
3,310
sqft
|
built
1910
410 W 8th St, Davenport, IA 52803
$960
Cash flow
49.7%
Cash-on-Cash Return
51.2%
Cap rate
7.1%
Rent to Value Ratio
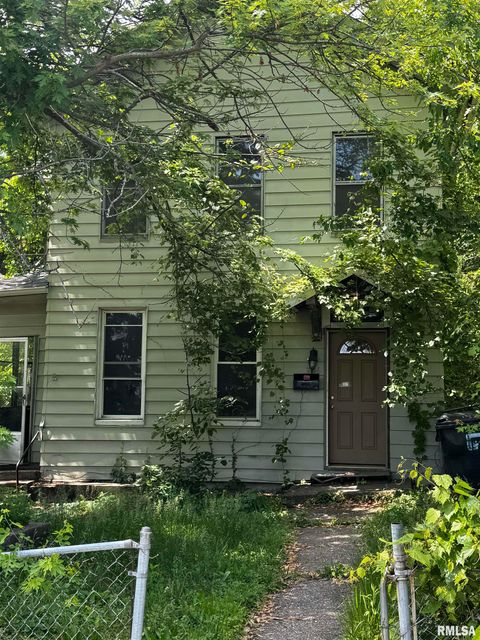
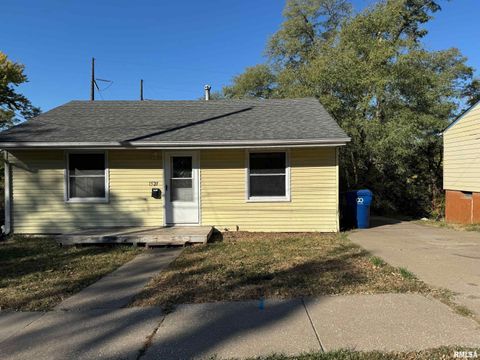
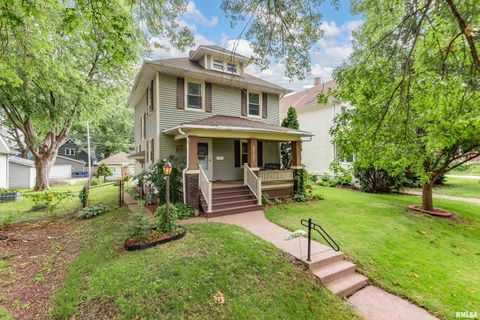
Active
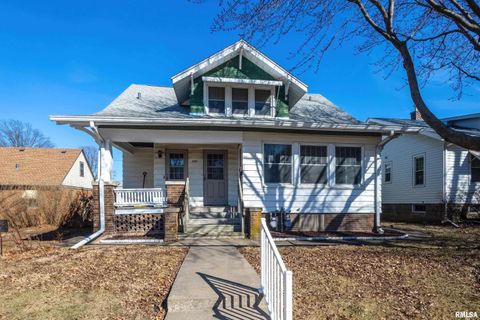
$22,500
3
bds
|
2
ba
|
1,888
sqft
|
built
1920
706 Farnam St, Davenport, IA 52803
$606
Cash flow
31.4%
Cash-on-Cash Return
32.3%
Cap rate
4.4%
Rent to Value Ratio
22 out of 35 properties for sale in 52803
Limited Results Shown
Create a free account, or log in to reveal all property listings and enjoy the complete experience.
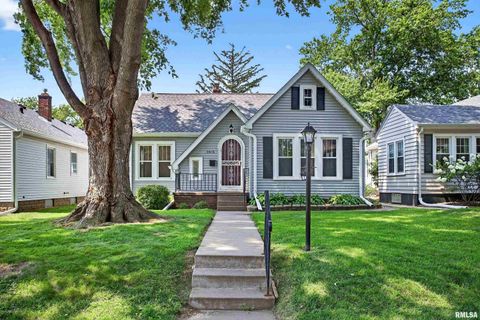
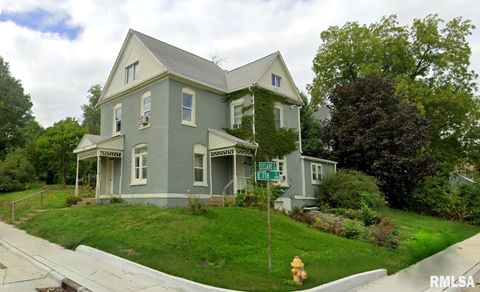
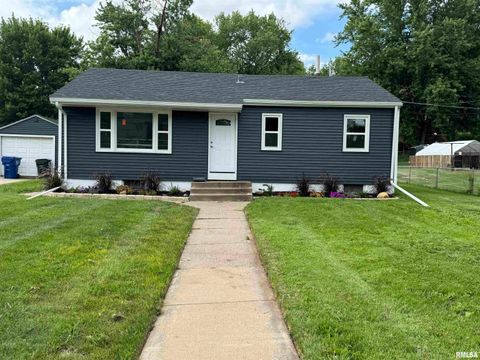
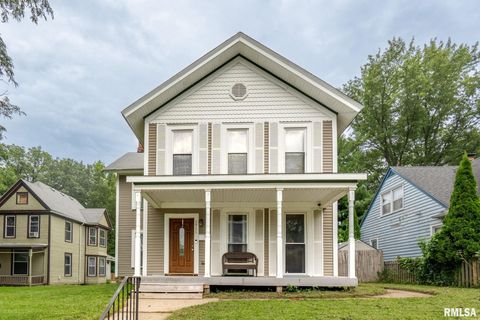
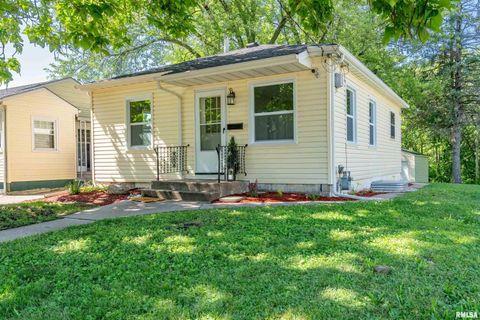
Active
$174,900
3
bds
|
2
ba
|
2,140
sqft
|
built
1935
3016 Arlington Ave, Davenport, IA 52803
$179
Cash flow
5.3%
Cash-on-Cash Return
6.9%
Cap rate
1.0%
Rent to Value Ratio
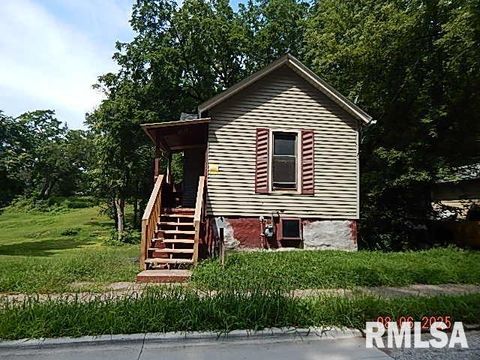
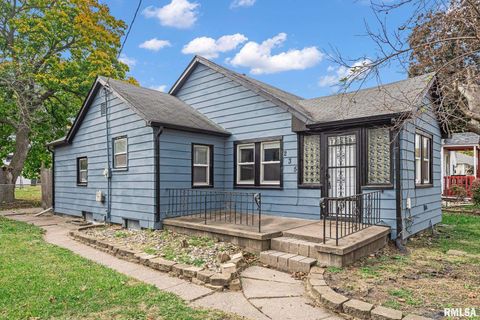
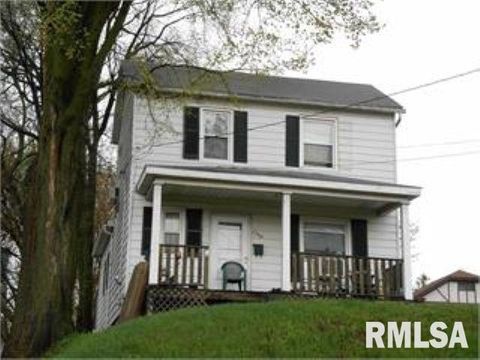
Active
$28,000
1
bds
|
1
ba
|
1,080
sqft
|
built
1900
1504 Christie St, Davenport, IA 52803
$486
Cash flow
20.2%
Cash-on-Cash Return
20.8%
Cap rate
2.9%
Rent to Value Ratio
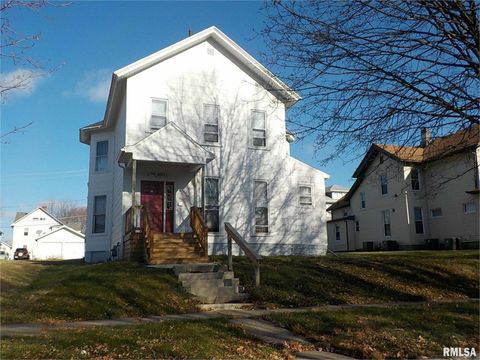
Active
$125,000
3
bds
|
2
ba
|
1,444
sqft
|
built
1879
2307 Farnam St, Davenport, IA 52803
$-7
Cash flow
-0.3%
Cash-on-Cash Return
5.6%
Cap rate
0.9%
Rent to Value Ratio
Active
$129,900
3
bds
|
0
ba
|
0
sqft
|
built
1920
2329 Pershing Ave, Davenport, IA 52803
$103
Cash flow
4.1%
Cash-on-Cash Return
6.6%
Cap rate
1.0%
Rent to Value Ratio
Active
$217,500
4
bds
|
0
ba
|
0
sqft
|
built
1890
430 E 7th St, Davenport, IA 52803
$-311
Cash flow
-7.5%
Cash-on-Cash Return
4.0%
Cap rate
0.6%
Rent to Value Ratio
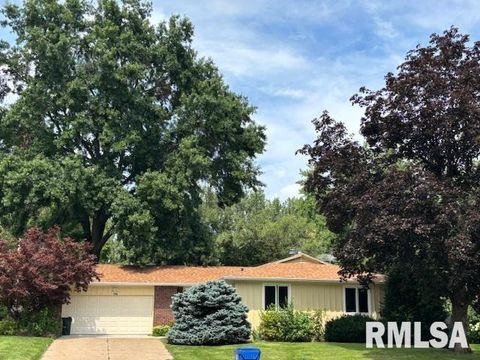
Active
$158,000
2
bds
|
1
ba
|
1,049
sqft
|
built
1940
235 W 32nd St, Davenport, IA 52803
$210
Cash flow
6.9%
Cash-on-Cash Return
7.3%
Cap rate
1.0%
Rent to Value Ratio
Active
$89,900
2
bds
|
1
ba
|
750
sqft
|
built
1955
1520 Mound St, Davenport, IA 52803
$122
Cash flow
7.1%
Cash-on-Cash Return
7.3%
Cap rate
1.1%
Rent to Value Ratio
Active
$179,900
3
bds
|
1
ba
|
1,152
sqft
|
built
1952
2222 E 13th St, Davenport, IA 52803
$-140
Cash flow
-4.1%
Cash-on-Cash Return
4.7%
Cap rate
0.7%
Rent to Value Ratio
Active
$89,900
3
bds
|
0
ba
|
0
sqft
|
built
1900
320 E 14th St, Davenport, IA 52803
$133
Cash flow
7.7%
Cash-on-Cash Return
7.4%
Cap rate
1.2%
Rent to Value Ratio
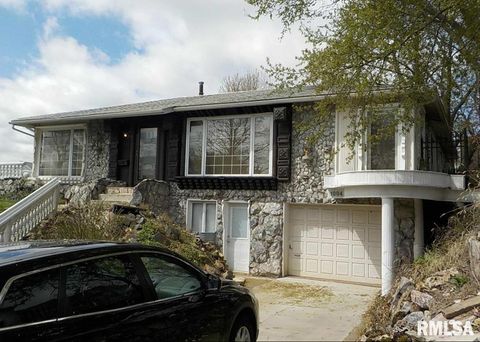
Active
$279,900
3
bds
|
3
ba
|
1,772
sqft
|
built
1972
2586 E George Washington Blvd, Davenport, IA 52803
$-249
Cash flow
-4.6%
Cash-on-Cash Return
4.6%
Cap rate
0.7%
Rent to Value Ratio
Active
$169,900
4
bds
|
3
ba
|
2,644
sqft
|
built
1900
1711 Grand Ave, Davenport, IA 52803
$159
Cash flow
4.9%
Cash-on-Cash Return
6.8%
Cap rate
1.0%
Rent to Value Ratio

Active
$163,000
4
bds
|
0
ba
|
0
sqft
|
built
1910
421 E 7th St, Davenport, IA 52803
$-59
Cash flow
-1.9%
Cash-on-Cash Return
5.2%
Cap rate
0.8%
Rent to Value Ratio
Active
$449,000
3
bds
|
0
ba
|
0
sqft
|
built
1950
1004 College Ave, Davenport, IA 52803
$-1,551
Cash flow
-18.0%
Cash-on-Cash Return
1.5%
Cap rate
0.4%
Rent to Value Ratio
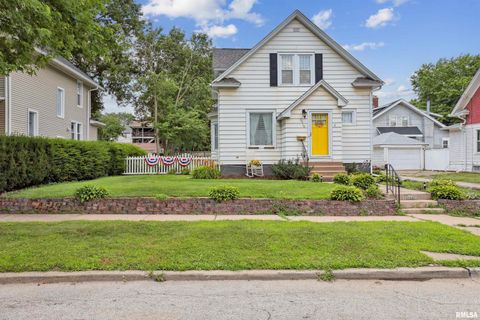
Active
$215,000
3
bds
|
2
ba
|
1,564
sqft
|
built
1914
2510 Pershing Ave, Davenport, IA 52803
$112
Cash flow
2.7%
Cash-on-Cash Return
6.3%
Cap rate
0.9%
Rent to Value Ratio
Active
$98,000
3
bds
|
0
ba
|
0
sqft
|
built
1880
415 E 7th St, Davenport, IA 52803
$93
Cash flow
5.0%
Cash-on-Cash Return
6.8%
Cap rate
1.0%
Rent to Value Ratio
Active
$179,900
6
bds
|
0
ba
|
0
sqft
|
built
1900
707 Brady St, Davenport, IA 52803
$-167
Cash flow
-4.8%
Cash-on-Cash Return
4.6%
Cap rate
0.7%
Rent to Value Ratio
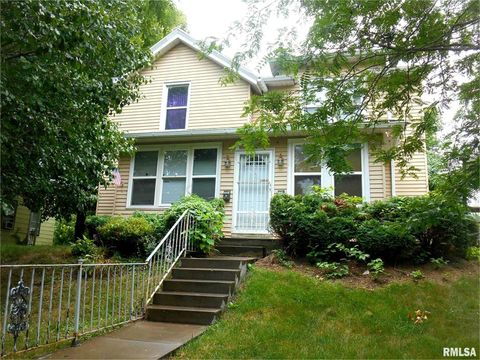
Active
$184,900
3
bds
|
2
ba
|
1,664
sqft
|
built
1920
2707 Arlington Ave, Davenport, IA 52803
$157
Cash flow
4.4%
Cash-on-Cash Return
6.7%
Cap rate
1.0%
Rent to Value Ratio

Active
$205,000
4
bds
|
2
ba
|
2,154
sqft
|
built
1920
2505 Iowa St, Davenport, IA 52803
$91
Cash flow
2.3%
Cash-on-Cash Return
6.2%
Cap rate
1.0%
Rent to Value Ratio
Active
$34,900
2
bds
|
1
ba
|
1,162
sqft
|
built
1864
2208 E Locust St, Davenport, IA 52803
$601
Cash flow
20.1%
Cash-on-Cash Return
20.7%
Cap rate
3.2%
Rent to Value Ratio
Active
$159,900
4
bds
|
2
ba
|
1,231
sqft
|
built
1955
1814 E 13th St, Davenport, IA 52803
$5
Cash flow
0.2%
Cash-on-Cash Return
5.7%
Cap rate
0.8%
Rent to Value Ratio