53204 Investment Properties for Sale
Browse homes for sale and investment properties in 53204. Refine your search by price, property type, or more.
Best cash flowing properties in 53204
Active
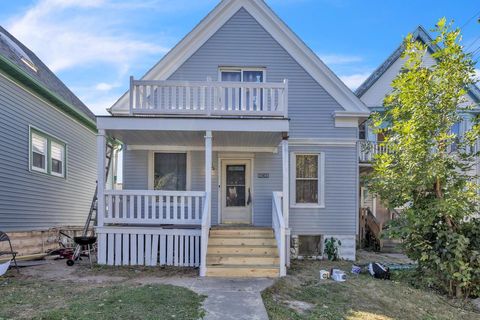
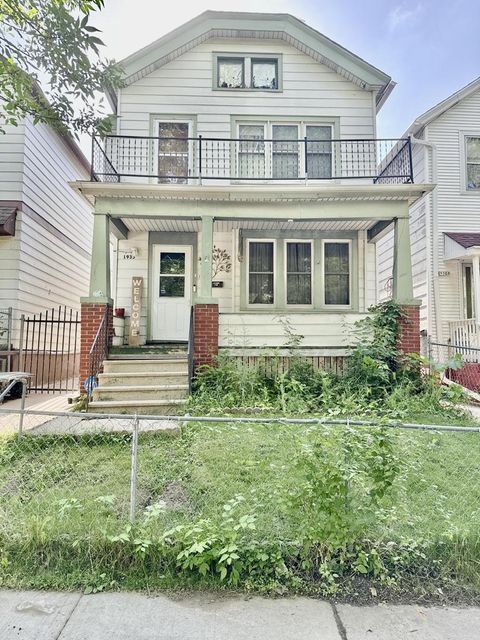
$129,900
3
bds
|
1
ba
|
1,152
sqft
|
built
1913
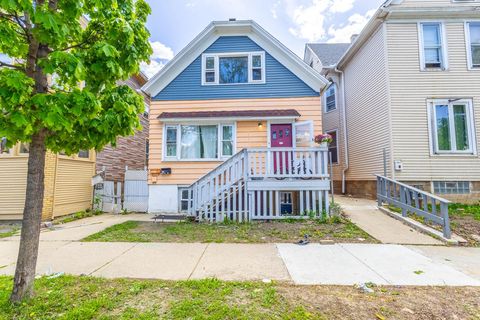
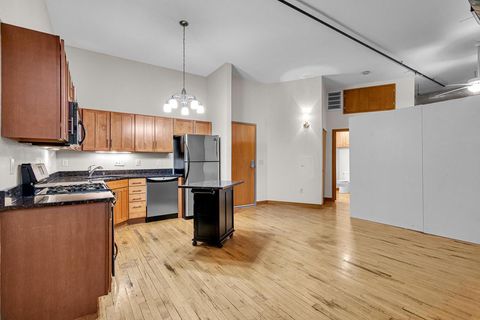
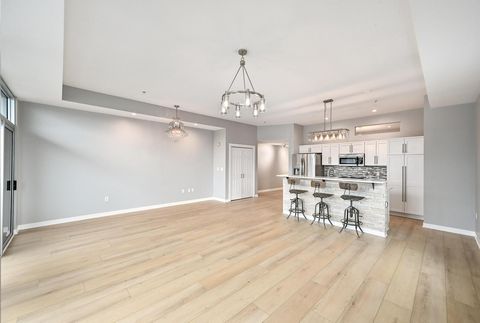
1961 S Congo Ave, Milwaukee, WI 53204
$401
Cash flow
16.1%
Cash-on-Cash Return
9.8%
Cap rate
1.3%
Rent to Value Ratio

Active
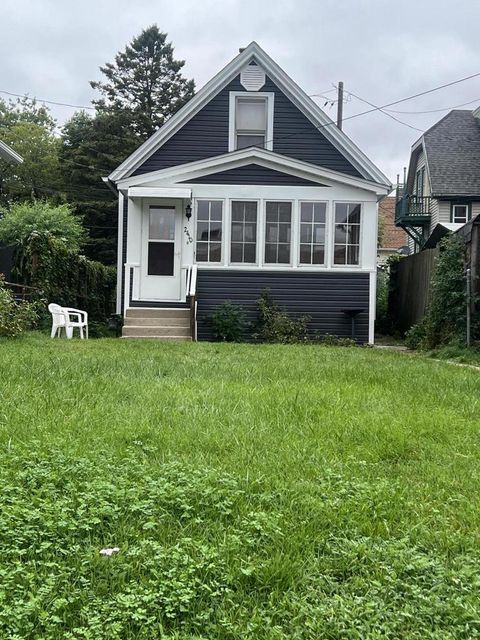
$165,000
5
bds
|
2.5
ba
|
2,196
sqft
|
built
1890
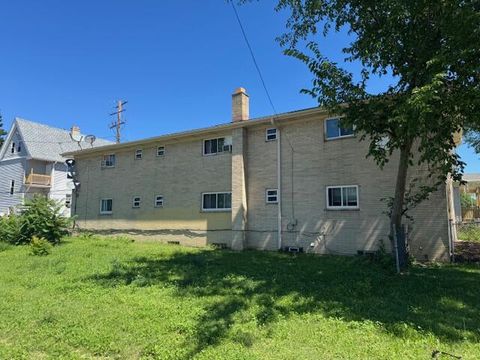
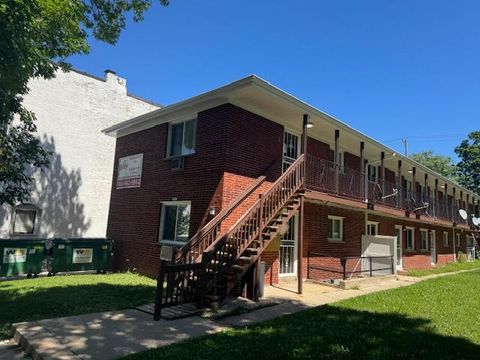
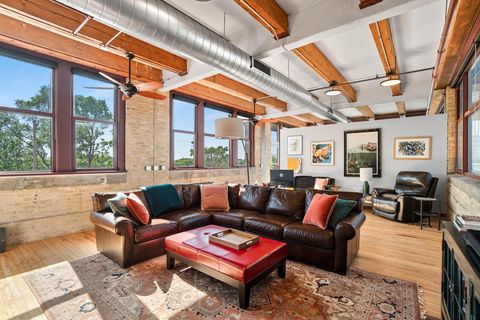
1001 S 18th St, Milwaukee, WI 53204
$118
Cash flow
3.7%
Cash-on-Cash Return
7.0%
Cap rate
1.1%
Rent to Value Ratio
26 out of 32 properties for sale in 53204
Limited Results Shown
Create a free account, or log in to reveal all property listings and enjoy the complete experience.
Active
$299,000
1
bds
|
1
ba
|
678
sqft
|
built
2006
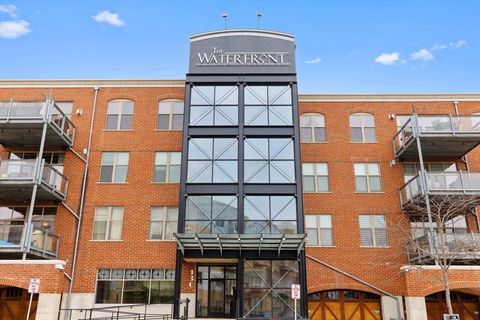
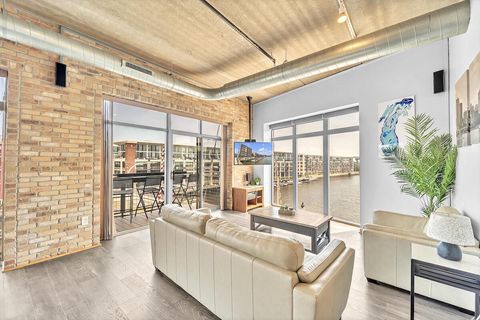
106 W Seeboth St, Milwaukee, WI 53204
$-1,456
Cash flow
-25.4%
Cash-on-Cash Return
0.3%
Cap rate
0.5%
Rent to Value Ratio
Active
$144,900
3
bds
|
1
ba
|
690
sqft
|
built
1893
2410 W Legion St, Milwaukee, WI 53204
$-98
Cash flow
-3.5%
Cash-on-Cash Return
5.3%
Cap rate
0.8%
Rent to Value Ratio
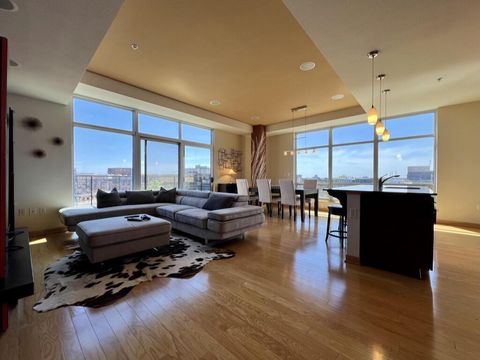
Active
$399,900
1
bds
|
1
ba
|
908
sqft
|
built
2004
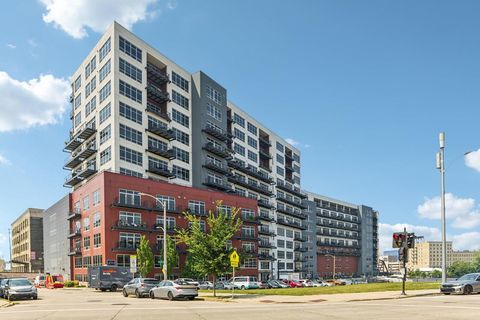
130 S Water St, Milwaukee, WI 53204
$-1,884
Cash flow
-24.6%
Cash-on-Cash Return
0.5%
Cap rate
0.5%
Rent to Value Ratio

Active
$179,900
5
bds
|
1
ba
|
1,692
sqft
|
built
1906
1300 W Greenfield Ave, Milwaukee, WI 53204
$-260
Cash flow
-7.5%
Cash-on-Cash Return
4.4%
Cap rate
0.6%
Rent to Value Ratio
Active
$697,500
2
bds
|
2
ba
|
1,510
sqft
|
built
2004
106 W Seeboth St, Milwaukee, WI 53204
$-4,168
Cash flow
-31.2%
Cash-on-Cash Return
-1.0%
Cap rate
0.4%
Rent to Value Ratio
Active
$187,000
4
bds
|
0
ba
|
1,903
sqft
|
built
1890
1327 W Orchard St, Milwaukee, WI 53204
$-483
Cash flow
-13.5%
Cash-on-Cash Return
3.0%
Cap rate
0.5%
Rent to Value Ratio
Active
$319,900
1
bds
|
1
ba
|
858
sqft
|
built
2007
106 W Seeboth St, Milwaukee, WI 53204
$-1,675
Cash flow
-27.3%
Cash-on-Cash Return
-0.1%
Cap rate
0.5%
Rent to Value Ratio
Active
$524,900
8
bds
|
1.5
ba
|
2,800
sqft
|
built
2005
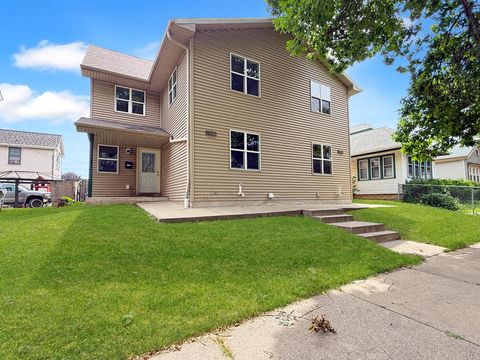
1310 S 7th St, Milwaukee, WI 53204
$-2,076
Cash flow
-20.6%
Cash-on-Cash Return
1.4%
Cap rate
0.3%
Rent to Value Ratio
Active
$165,000
3
bds
|
2
ba
|
1,290
sqft
|
built
1884
1935 S 10th St, Milwaukee, WI 53204
$-384
Cash flow
-12.1%
Cash-on-Cash Return
3.4%
Cap rate
0.5%
Rent to Value Ratio
Active
$525,000
1
bds
|
1
ba
|
1,140
sqft
|
built
2003
130 S Water St, Milwaukee, WI 53204
$-2,673
Cash flow
-26.6%
Cash-on-Cash Return
0.0%
Cap rate
0.4%
Rent to Value Ratio
Active
$480,000
bds
|
0
ba
|
0
sqft
|
built
1950
810 W Lapham Blvd, Milwaukee, WI 53204
$-1,847
Cash flow
-20.1%
Cash-on-Cash Return
1.5%
Cap rate
0.3%
Rent to Value Ratio
Active
$649,900
2
bds
|
2
ba
|
1,165
sqft
|
built
2006
210 S Water St, Milwaukee, WI 53204
$-2,760
Cash flow
-22.2%
Cash-on-Cash Return
1.1%
Cap rate
0.4%
Rent to Value Ratio
Active
$379,900
1
bds
|
1
ba
|
1,077
sqft
|
built
2006
106 W Seeboth St, Milwaukee, WI 53204
$-2,152
Cash flow
-29.6%
Cash-on-Cash Return
-0.7%
Cap rate
0.4%
Rent to Value Ratio
Active
$299,900
1
bds
|
1
ba
|
865
sqft
|
built
1875
200 S Water St, Milwaukee, WI 53204
$-1,341
Cash flow
-23.3%
Cash-on-Cash Return
0.8%
Cap rate
0.5%
Rent to Value Ratio
Active
$170,000
4
bds
|
1
ba
|
1,893
sqft
|
built
1882
2035 S 7th St, Milwaukee, WI 53204
$-319
Cash flow
-9.8%
Cash-on-Cash Return
3.9%
Cap rate
0.6%
Rent to Value Ratio
Active
$829,000
2
bds
|
2
ba
|
1,653
sqft
|
built
2004
130 S Water St, Milwaukee, WI 53204
$-3,140
Cash flow
-19.8%
Cash-on-Cash Return
1.6%
Cap rate
0.4%
Rent to Value Ratio
Active
$175,000
bds
|
1
ba
|
548
sqft
|
built
1895
1017 S 2nd St, Milwaukee, WI 53204
$-790
Cash flow
-23.6%
Cash-on-Cash Return
0.7%
Cap rate
0.5%
Rent to Value Ratio
Active
$640,000
bds
|
0
ba
|
4,400
sqft
|
built
1950
1422 S 7th St, Milwaukee, WI 53204
$-2,684
Cash flow
-21.9%
Cash-on-Cash Return
1.1%
Cap rate
0.3%
Rent to Value Ratio
Active
$209,900
bds
|
0
ba
|
0
sqft
|
built
1890
733 S 26th St, Milwaukee, WI 53204
$-563
Cash flow
-14.0%
Cash-on-Cash Return
2.9%
Cap rate
0.5%
Rent to Value Ratio
Active
$255,000
6
bds
|
1
ba
|
2,849
sqft
|
built
1880
1560 S 26th St, Milwaukee, WI 53204
$-37
Cash flow
-0.8%
Cash-on-Cash Return
6.0%
Cap rate
0.9%
Rent to Value Ratio
Active
$675,000
2
bds
|
2
ba
|
1,476
sqft
|
built
2006
106 W Seeboth St, Milwaukee, WI 53204
$-3,874
Cash flow
-29.9%
Cash-on-Cash Return
-0.7%
Cap rate
0.4%
Rent to Value Ratio
Active
$550,000
1
bds
|
2
ba
|
1,645
sqft
|
built
1921
215 W Maple St, Milwaukee, WI 53204
$-2,133
Cash flow
-20.2%
Cash-on-Cash Return
1.5%
Cap rate
0.4%
Rent to Value Ratio
Active
$369,900
1
bds
|
1
ba
|
900
sqft
|
built
1875
200 S Water St, Milwaukee, WI 53204
$-1,766
Cash flow
-24.9%
Cash-on-Cash Return
0.4%
Cap rate
0.4%
Rent to Value Ratio
Active
$170,000
5
bds
|
1
ba
|
1,978
sqft
|
built
1900
1562 W Odell St, Milwaukee, WI 53204
$-268
Cash flow
-8.2%
Cash-on-Cash Return
4.3%
Cap rate
0.6%
Rent to Value Ratio