55057 Investment Properties for Sale
Browse homes for sale and investment properties in 55057. Refine your search by price, property type, or more.
Best cash flowing properties in 55057
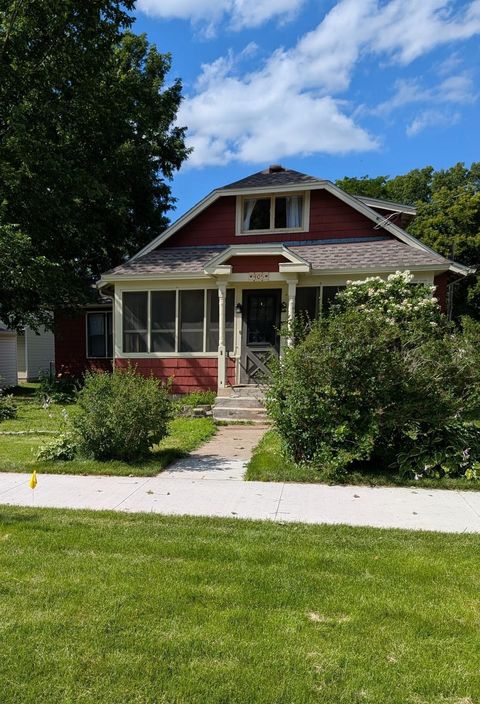
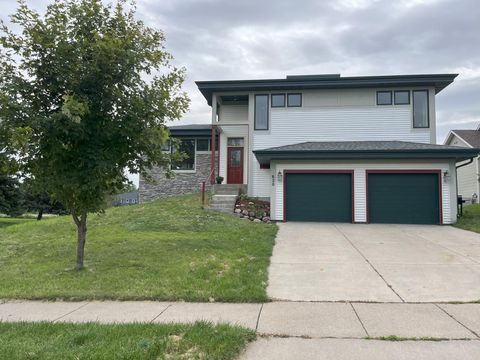
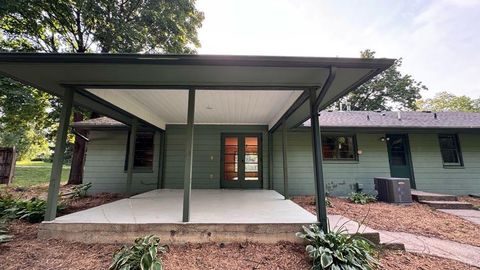
Active
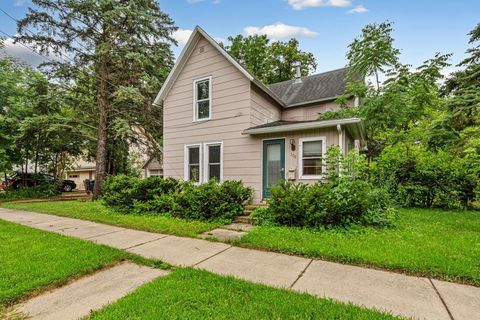
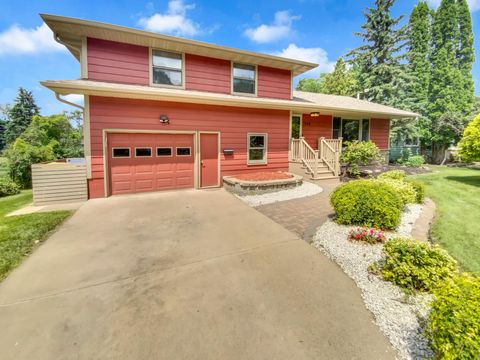
$219,900
3
bds
|
2
ba
|
1,800
sqft
|
built
1920
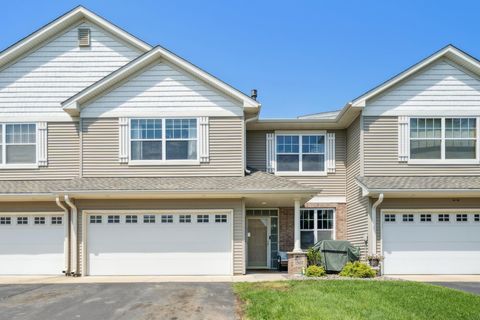
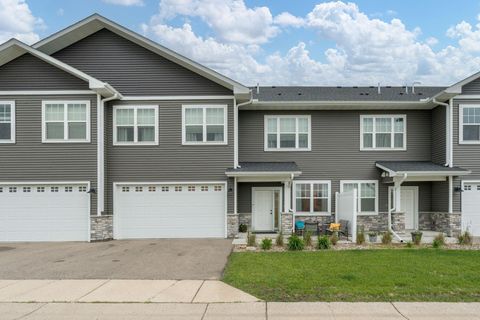
405 8th St E, Northfield, MN 55057
$23
Cash flow
0.5%
Cash-on-Cash Return
5.8%
Cap rate
0.9%
Rent to Value Ratio
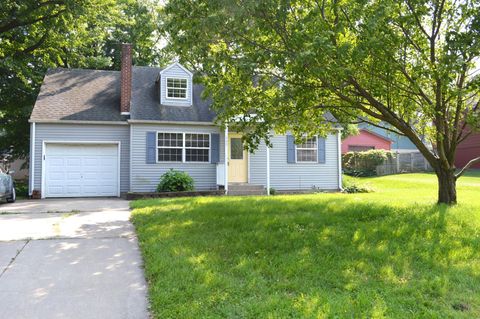
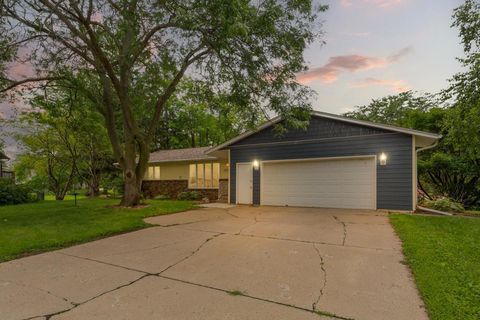
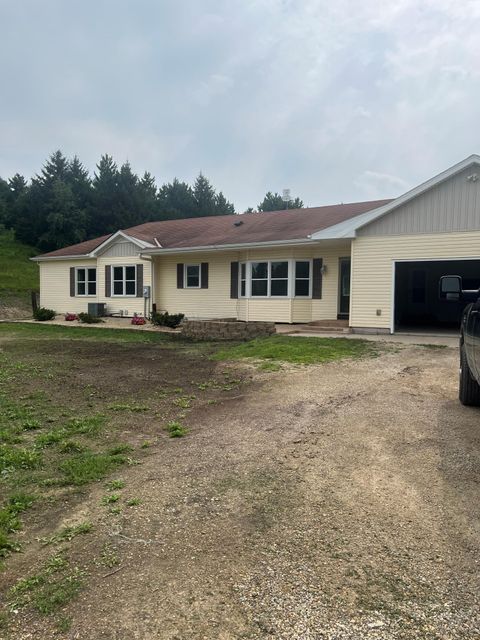
Active
$255,000
3
bds
|
1
ba
|
1,370
sqft
|
built
1960
409 Greenvale Ave W, Northfield, MN 55057
$-32
Cash flow
-0.7%
Cash-on-Cash Return
5.5%
Cap rate
0.9%
Rent to Value Ratio
32 out of 48 properties for sale in 55057
Limited Results Shown
Create a free account, or log in to reveal all property listings and enjoy the complete experience.
Active
$665,000
5
bds
|
3
ba
|
4,710
sqft
|
built
1880
917 Division St S, Northfield, MN 55057
$-1,042
Cash flow
-8.2%
Cash-on-Cash Return
3.8%
Cap rate
0.6%
Rent to Value Ratio
Active
$359,900
3
bds
|
2
ba
|
1,532
sqft
|
built
1900
701 3rd St W, Northfield, MN 55057
$-723
Cash flow
-10.5%
Cash-on-Cash Return
3.3%
Cap rate
0.5%
Rent to Value Ratio
Active
$489,995
4
bds
|
4
ba
|
2,834
sqft
|
built
2005
820 Superior Dr, Northfield, MN 55057
$-952
Cash flow
-10.1%
Cash-on-Cash Return
3.3%
Cap rate
0.7%
Rent to Value Ratio
Active
$308,000
5
bds
|
2
ba
|
2,484
sqft
|
built
1974
1710 Harrison Ct, Northfield, MN 55057
$-80
Cash flow
-1.4%
Cash-on-Cash Return
5.4%
Cap rate
0.9%
Rent to Value Ratio
Active
$1,290,000
3
bds
|
3
ba
|
3,611
sqft
|
built
1994
12326 Falk Trl, Northfield, MN 55057
$-4,168
Cash flow
-16.9%
Cash-on-Cash Return
1.8%
Cap rate
0.3%
Rent to Value Ratio
Active
$279,000
2
bds
|
2
ba
|
1,548
sqft
|
built
2002
103 Orchard St N, Northfield, MN 55057
$-496
Cash flow
-9.3%
Cash-on-Cash Return
3.5%
Cap rate
0.6%
Rent to Value Ratio
Active
$375,000
5
bds
|
2
ba
|
3,174
sqft
|
built
1949
11 Lincoln Ln, Northfield, MN 55057
$-496
Cash flow
-6.9%
Cash-on-Cash Return
4.1%
Cap rate
0.7%
Rent to Value Ratio
Active
$699,900
4
bds
|
4
ba
|
3,050
sqft
|
built
1949
7723 115th St E, Northfield, MN 55057
$-2,043
Cash flow
-15.2%
Cash-on-Cash Return
2.2%
Cap rate
0.4%
Rent to Value Ratio
Active
$630,000
5
bds
|
5
ba
|
3,887
sqft
|
built
2012
2708 Oak Lawn Dr, Northfield, MN 55057
$-1,797
Cash flow
-14.9%
Cash-on-Cash Return
2.3%
Cap rate
0.5%
Rent to Value Ratio
Active
$399,900
3
bds
|
2
ba
|
2,000
sqft
|
built
1987
1741 Roosevelt Dr, Northfield, MN 55057
$-622
Cash flow
-8.1%
Cash-on-Cash Return
3.8%
Cap rate
0.6%
Rent to Value Ratio
Active
$224,900
2
bds
|
3
ba
|
1,594
sqft
|
built
2003
1507 Independence Dr, Northfield, MN 55057
$-301
Cash flow
-7.0%
Cash-on-Cash Return
4.1%
Cap rate
0.9%
Rent to Value Ratio
Active
$400,000
2
bds
|
3
ba
|
1,446
sqft
|
built
1998
1011 Poplar St, Northfield, MN 55057
$-1,033
Cash flow
-13.5%
Cash-on-Cash Return
2.6%
Cap rate
0.4%
Rent to Value Ratio
Active
$649,900
4
bds
|
5
ba
|
5,318
sqft
|
built
1993
2655 88th Ct W, Northfield, MN 55057
$-1,014
Cash flow
-8.1%
Cash-on-Cash Return
3.8%
Cap rate
0.6%
Rent to Value Ratio
Active
$239,900
2
bds
|
1
ba
|
1,168
sqft
|
built
1986
717 Lincoln St N, Northfield, MN 55057
$-456
Cash flow
-9.9%
Cash-on-Cash Return
3.4%
Cap rate
0.8%
Rent to Value Ratio
Active
$445,000
2
bds
|
2
ba
|
1,528
sqft
|
built
2006
101 Saint Olaf Ave, Northfield, MN 55057
$-1,603
Cash flow
-18.8%
Cash-on-Cash Return
1.4%
Cap rate
0.6%
Rent to Value Ratio
Active
$205,000
2
bds
|
2
ba
|
1,167
sqft
|
built
2002
2808 Brockman Ct, Northfield, MN 55057
$-361
Cash flow
-9.2%
Cash-on-Cash Return
3.6%
Cap rate
0.9%
Rent to Value Ratio
Active
$299,900
2
bds
|
3
ba
|
1,769
sqft
|
built
2004
1907 Red Maple Ln, Northfield, MN 55057
$-635
Cash flow
-11.0%
Cash-on-Cash Return
3.1%
Cap rate
0.7%
Rent to Value Ratio
Active
$205,000
2
bds
|
1
ba
|
878
sqft
|
built
1900
308 7th St E, Northfield, MN 55057
$-135
Cash flow
-3.4%
Cash-on-Cash Return
4.9%
Cap rate
0.8%
Rent to Value Ratio
Active
$419,000
3
bds
|
3
ba
|
2,379
sqft
|
built
1968
706 Greenvale Ave W, Northfield, MN 55057
$-327
Cash flow
-4.1%
Cash-on-Cash Return
4.7%
Cap rate
0.7%
Rent to Value Ratio
Active
$428,890
4
bds
|
3
ba
|
2,346
sqft
|
built
2024
110 Maple St, Northfield, MN 55057
$-181
Cash flow
-2.2%
Cash-on-Cash Return
5.2%
Cap rate
0.7%
Rent to Value Ratio
Active
$675,000
6
bds
|
3
ba
|
3,989
sqft
|
built
2002
1809 Michigan Dr, Northfield, MN 55057
$-1,929
Cash flow
-14.9%
Cash-on-Cash Return
2.2%
Cap rate
0.5%
Rent to Value Ratio
Active
$535,000
5
bds
|
3
ba
|
3,337
sqft
|
built
2007
816 Abbey Rd, Northfield, MN 55057
$-1,170
Cash flow
-11.4%
Cash-on-Cash Return
3.1%
Cap rate
0.5%
Rent to Value Ratio
Active
$317,400
3
bds
|
3
ba
|
1,980
sqft
|
built
2020
422 Ford St E, Northfield, MN 55057
$-435
Cash flow
-7.2%
Cash-on-Cash Return
4.0%
Cap rate
0.8%
Rent to Value Ratio
Active
$1,700,000
5
bds
|
3
ba
|
4,340
sqft
|
built
1987
8705 Chester Ave, Northfield, MN 55057
$-5,958
Cash flow
-18.3%
Cash-on-Cash Return
1.5%
Cap rate
0.2%
Rent to Value Ratio
Active
$237,000
4
bds
|
2
ba
|
1,872
sqft
|
built
1992
315 Poplar St, Northfield, MN 55057
$-315
Cash flow
-6.9%
Cash-on-Cash Return
4.1%
Cap rate
0.8%
Rent to Value Ratio
Active
$580,000
5
bds
|
2
ba
|
2,171
sqft
|
built
1913
408 5th St E, Northfield, MN 55057
$-1,375
Cash flow
-12.4%
Cash-on-Cash Return
2.8%
Cap rate
0.5%
Rent to Value Ratio
Active
$989,888
4
bds
|
4
ba
|
3,897
sqft
|
built
2000
2206 Grant Ct, Northfield, MN 55057
$-3,409
Cash flow
-18.0%
Cash-on-Cash Return
1.5%
Cap rate
0.3%
Rent to Value Ratio
Active
$220,000
2
bds
|
1
ba
|
1,152
sqft
|
built
1873
504 2nd St W, Northfield, MN 55057
$-364
Cash flow
-8.6%
Cash-on-Cash Return
3.7%
Cap rate
0.7%
Rent to Value Ratio
Active
$1,490,000
5
bds
|
5
ba
|
3,954
sqft
|
built
2003
1211 Lonsdale Blvd E, Northfield, MN 55057
$-4,393
Cash flow
-15.4%
Cash-on-Cash Return
2.1%
Cap rate
0.4%
Rent to Value Ratio
Active
$3,799,999
3
bds
|
3
ba
|
2,790
sqft
|
built
2018
7243 Hazelwood Ave, Northfield, MN 55057
$-15,639
Cash flow
-21.5%
Cash-on-Cash Return
0.7%
Cap rate
0.1%
Rent to Value Ratio