55119 Investment Properties for Sale
Browse homes for sale and investment properties in 55119. Refine your search by price, property type, or more.
Best cash flowing properties in 55119
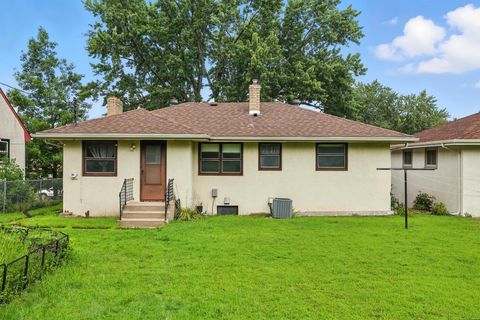
Active
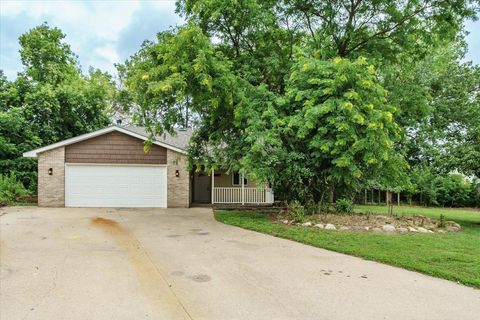
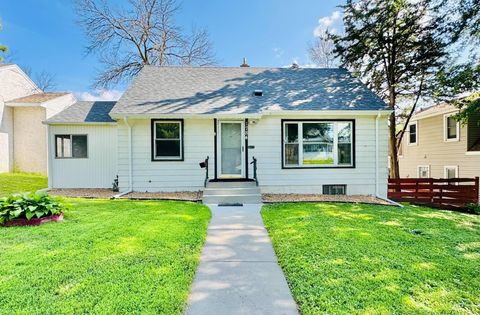
$325,000
3
bds
|
2
ba
|
1,600
sqft
|
built
1976
1172 Point Douglas Rd S, Saint Paul, MN 55119
$415
Cash flow
6.7%
Cash-on-Cash Return
7.2%
Cap rate
1.2%
Rent to Value Ratio
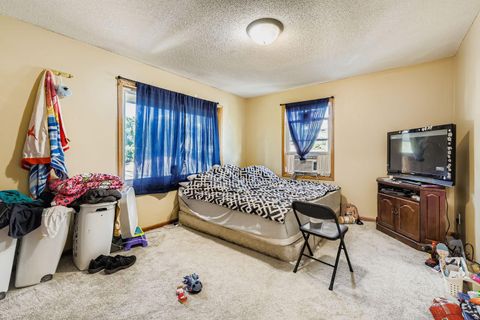
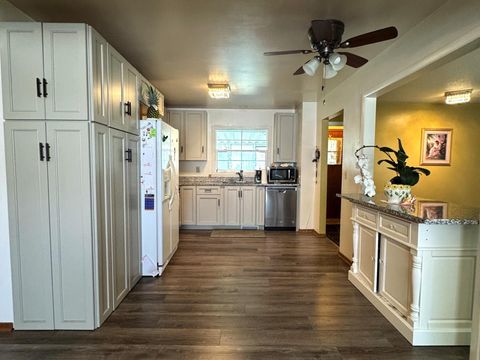
Active
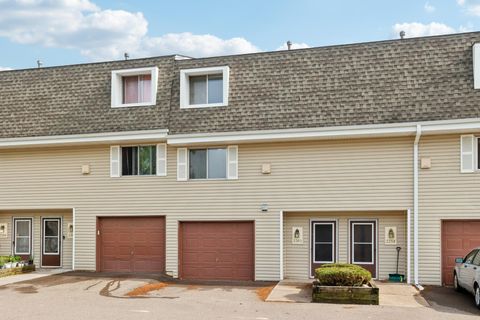
$199,900
4
bds
|
1
ba
|
1,242
sqft
|
built
1917
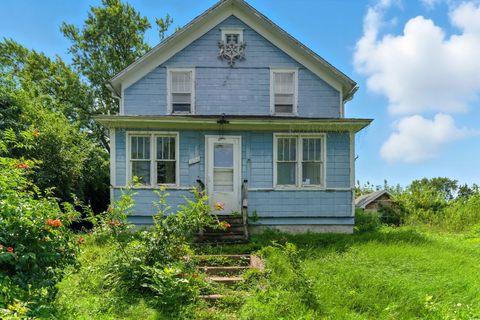
1806 Sherwood Ave, Saint Paul, MN 55119
$130
Cash flow
3.4%
Cash-on-Cash Return
6.5%
Cap rate
1.0%
Rent to Value Ratio
43 out of 58 properties for sale in 55119
Limited Results Shown
Create a free account, or log in to reveal all property listings and enjoy the complete experience.
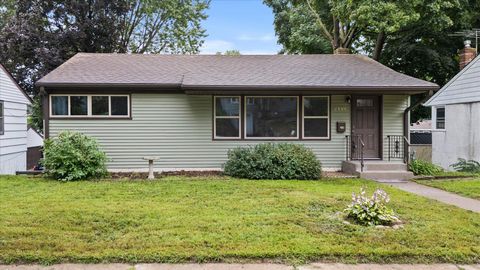
Active
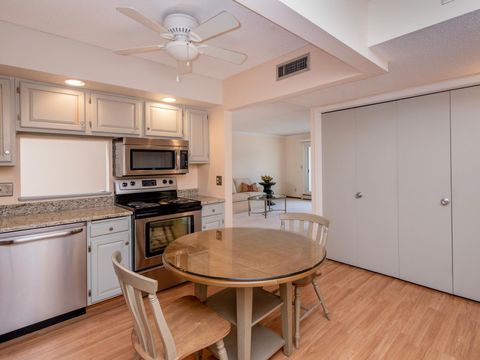
$339,000
3
bds
|
2
ba
|
2,013
sqft
|
built
1955
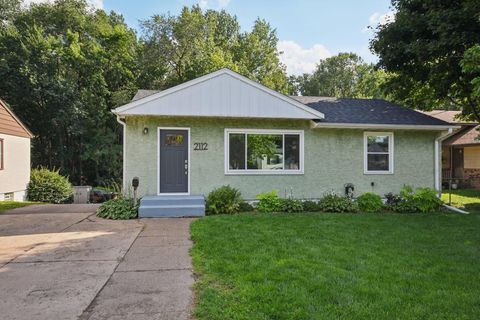
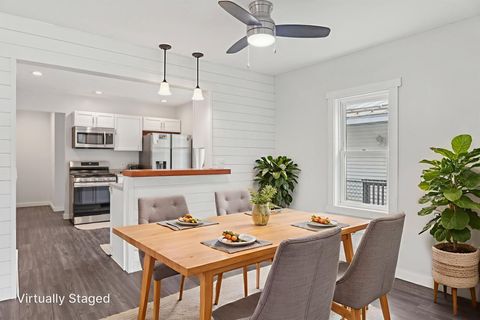
2112 Minnehaha Ave E, Saint Paul, MN 55119
$-588
Cash flow
-9.0%
Cash-on-Cash Return
3.6%
Cap rate
0.6%
Rent to Value Ratio
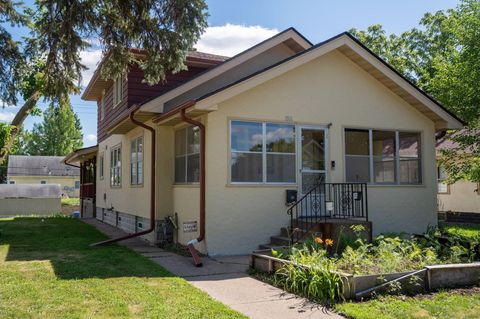
Active
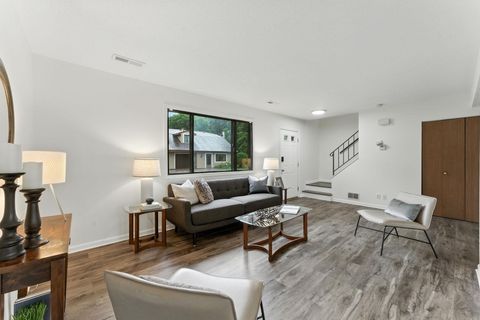
$360,000
4
bds
|
3
ba
|
2,095
sqft
|
built
1922
1935 Fremont Ave E, Saint Paul, MN 55119
$-324
Cash flow
-4.7%
Cash-on-Cash Return
4.6%
Cap rate
0.6%
Rent to Value Ratio
Active
$299,900
3
bds
|
2
ba
|
1,344
sqft
|
built
1959
2168 5th St E, Saint Paul, MN 55119
$-253
Cash flow
-4.4%
Cash-on-Cash Return
4.7%
Cap rate
0.7%
Rent to Value Ratio
Active
$450,000
7
bds
|
6
ba
|
3,229
sqft
|
built
1969
2169 Glenridge Ave, Saint Paul, MN 55119
$-1,486
Cash flow
-17.2%
Cash-on-Cash Return
1.7%
Cap rate
0.5%
Rent to Value Ratio
Active
$300,000
4
bds
|
2
ba
|
1,732
sqft
|
built
1954
2106 Waukon Ave, Saint Paul, MN 55119
$-433
Cash flow
-7.5%
Cash-on-Cash Return
3.9%
Cap rate
0.6%
Rent to Value Ratio
Active
$320,000
4
bds
|
2
ba
|
2,128
sqft
|
built
1927
1868 Ivy Ave E, Saint Paul, MN 55119
$-167
Cash flow
-2.7%
Cash-on-Cash Return
5.1%
Cap rate
0.8%
Rent to Value Ratio
Active
$270,000
4
bds
|
2
ba
|
1,300
sqft
|
built
1954
2175 Bush Ave E, Saint Paul, MN 55119
$-194
Cash flow
-3.7%
Cash-on-Cash Return
4.8%
Cap rate
0.7%
Rent to Value Ratio
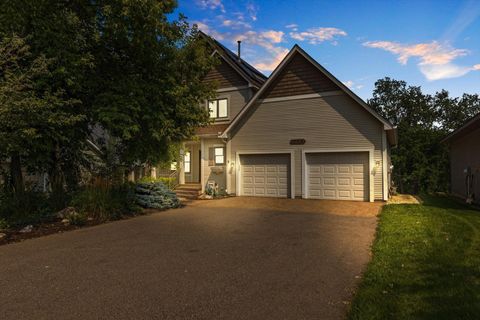
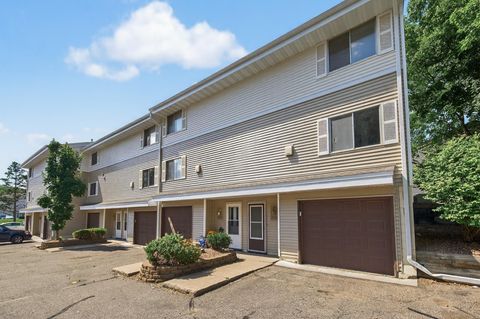
Active
$325,000
3
bds
|
3
ba
|
2,000
sqft
|
built
1991
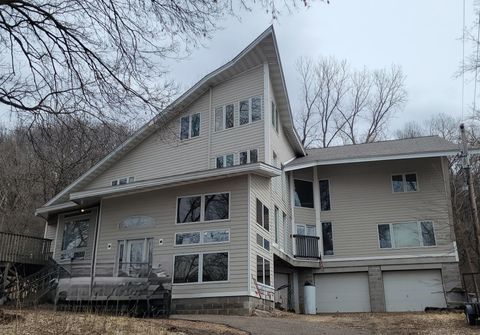
539 Deer Ridge Ln S, Saint Paul, MN 55119
$-621
Cash flow
-10.0%
Cash-on-Cash Return
3.4%
Cap rate
0.8%
Rent to Value Ratio
Active
$299,000
3
bds
|
2
ba
|
1,760
sqft
|
built
1951
1840 Iowa Ave E, Saint Paul, MN 55119
$-293
Cash flow
-5.1%
Cash-on-Cash Return
4.5%
Cap rate
0.7%
Rent to Value Ratio
Active
$450,000
4
bds
|
3
ba
|
2,025
sqft
|
built
1987
567 Lakewood Dr S, Maplewood, MN 55119
$-629
Cash flow
-7.3%
Cash-on-Cash Return
4.0%
Cap rate
0.6%
Rent to Value Ratio
Active
$524,000
4
bds
|
3
ba
|
2,678
sqft
|
built
1995
606 Sterling St S, Maplewood, MN 55119
$-839
Cash flow
-8.4%
Cash-on-Cash Return
3.8%
Cap rate
0.6%
Rent to Value Ratio
Active
$450,000
6
bds
|
3
ba
|
2,848
sqft
|
built
1973
688 Burlington Rd, Saint Paul, MN 55119
$-1,340
Cash flow
-15.5%
Cash-on-Cash Return
2.1%
Cap rate
0.5%
Rent to Value Ratio
Active
$250,000
2
bds
|
1
ba
|
1,122
sqft
|
built
1991
514 Deer Ridge Ln S, Maplewood, MN 55119
$-574
Cash flow
-12.0%
Cash-on-Cash Return
2.9%
Cap rate
0.7%
Rent to Value Ratio
Active
$329,900
5
bds
|
1
ba
|
1,640
sqft
|
built
1975
1827 Hyacinth Ave E, Saint Paul, MN 55119
$-358
Cash flow
-5.7%
Cash-on-Cash Return
4.4%
Cap rate
0.7%
Rent to Value Ratio
Active
$448,100
4
bds
|
2
ba
|
2,148
sqft
|
built
1992
819 Dorland Rd S, Maplewood, MN 55119
$-793
Cash flow
-9.2%
Cash-on-Cash Return
3.6%
Cap rate
0.6%
Rent to Value Ratio

Active
$300,000
4
bds
|
2
ba
|
1,865
sqft
|
built
1959
2051 Suburban Ave, Saint Paul, MN 55119
$-66
Cash flow
-1.1%
Cash-on-Cash Return
5.4%
Cap rate
0.8%
Rent to Value Ratio

Active
$329,900
3
bds
|
2
ba
|
2,205
sqft
|
built
2000
906 New Century Blvd S, Maplewood, MN 55119
$-522
Cash flow
-8.3%
Cash-on-Cash Return
3.8%
Cap rate
0.8%
Rent to Value Ratio
Active
$364,900
4
bds
|
2
ba
|
1,944
sqft
|
built
1967
2197 Falcon Ave, Saint Paul, MN 55119
$-375
Cash flow
-5.4%
Cash-on-Cash Return
4.4%
Cap rate
0.7%
Rent to Value Ratio
Active
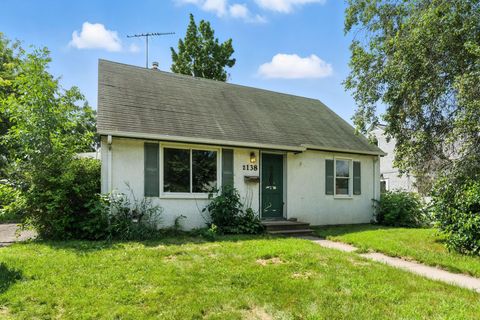
$224,900
3
bds
|
1
ba
|
1,018
sqft
|
built
1950
2138 3rd St E, Saint Paul, MN 55119
$-8
Cash flow
-0.2%
Cash-on-Cash Return
5.6%
Cap rate
0.9%
Rent to Value Ratio
Active
$330,000
4
bds
|
2
ba
|
1,344
sqft
|
built
2006
1891 Maryland Ave E, Saint Paul, MN 55119
$-422
Cash flow
-6.7%
Cash-on-Cash Return
4.1%
Cap rate
0.7%
Rent to Value Ratio
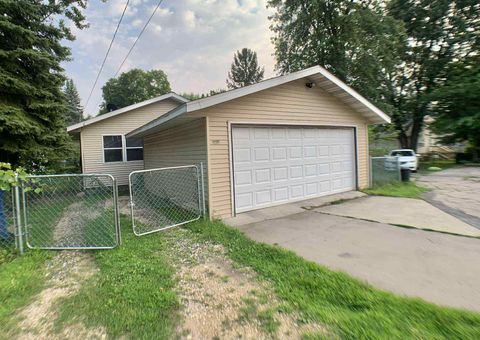
Active
$269,000
4
bds
|
1
ba
|
1,901
sqft
|
built
1950
1784 Sims Ave, Saint Paul, MN 55119
$-245
Cash flow
-4.8%
Cash-on-Cash Return
4.6%
Cap rate
0.7%
Rent to Value Ratio
Active
$181,000
3
bds
|
2
ba
|
1,715
sqft
|
built
1972
2360 Mailand Ct E, Maplewood, MN 55119
$-160
Cash flow
-4.6%
Cash-on-Cash Return
4.6%
Cap rate
1.1%
Rent to Value Ratio
Active
$159,000
1
bds
|
1
ba
|
778
sqft
|
built
1973
2485 Londin Ln E, Maplewood, MN 55119
$-337
Cash flow
-11.1%
Cash-on-Cash Return
3.1%
Cap rate
0.9%
Rent to Value Ratio
Active
$224,900
2
bds
|
1
ba
|
1,152
sqft
|
built
1981
1216 Ferndale St N, Maplewood, MN 55119
$-494
Cash flow
-11.5%
Cash-on-Cash Return
3.0%
Cap rate
0.7%
Rent to Value Ratio

Active
$145,000
1
bds
|
1
ba
|
918
sqft
|
built
1982
2060 Pathways Dr, Saint Paul, MN 55119
$-239
Cash flow
-8.6%
Cash-on-Cash Return
3.7%
Cap rate
1.0%
Rent to Value Ratio
Active
$279,500
3
bds
|
2
ba
|
1,366
sqft
|
built
1955
2172 Reaney Ave E, Saint Paul, MN 55119
$-187
Cash flow
-3.5%
Cash-on-Cash Return
4.9%
Cap rate
0.7%
Rent to Value Ratio
Active
$364,900
3
bds
|
2
ba
|
1,700
sqft
|
built
1979
570 Crestview Dr S, Maplewood, MN 55119
$-379
Cash flow
-5.4%
Cash-on-Cash Return
4.4%
Cap rate
0.7%
Rent to Value Ratio
Active
$234,900
3
bds
|
1
ba
|
730
sqft
|
built
1914
1826 Case Ave E, Saint Paul, MN 55119
$-286
Cash flow
-6.4%
Cash-on-Cash Return
4.2%
Cap rate
0.7%
Rent to Value Ratio
Active
$419,900
3
bds
|
3
ba
|
2,803
sqft
|
built
1978
2125 Skyway Dr, Saint Paul, MN 55119
$-643
Cash flow
-8.0%
Cash-on-Cash Return
3.8%
Cap rate
0.7%
Rent to Value Ratio
Active
$185,000
2
bds
|
2
ba
|
1,660
sqft
|
built
1972
2365 Dorland Ct E, Maplewood, MN 55119
$-348
Cash flow
-9.8%
Cash-on-Cash Return
3.4%
Cap rate
1.0%
Rent to Value Ratio
Active
$139,000
2
bds
|
2
ba
|
1,332
sqft
|
built
2006
935 Ferndale St N, Maplewood, MN 55119
$-1,602
Cash flow
-60.1%
Cash-on-Cash Return
-8.1%
Cap rate
1.3%
Rent to Value Ratio
Active
$379,900
3
bds
|
2
ba
|
2,312
sqft
|
built
1954
2233 Fremont Ave E, Saint Paul, MN 55119
$-279
Cash flow
-3.8%
Cash-on-Cash Return
4.8%
Cap rate
0.7%
Rent to Value Ratio
Active
$399,000
4
bds
|
2
ba
|
2,228
sqft
|
built
1973
1989 N Park Dr, Saint Paul, MN 55119
$-538
Cash flow
-7.0%
Cash-on-Cash Return
4.1%
Cap rate
0.7%
Rent to Value Ratio
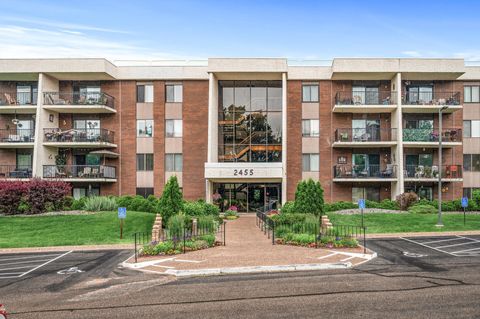
Active
$200,000
2
bds
|
2
ba
|
1,310
sqft
|
built
1979
2455 Londin Ln E, Maplewood, MN 55119
$-303
Cash flow
-7.9%
Cash-on-Cash Return
3.9%
Cap rate
1.0%
Rent to Value Ratio
Active
$284,900
3
bds
|
2
ba
|
1,597
sqft
|
built
1939
1803 Bush Ave E, Saint Paul, MN 55119
$-304
Cash flow
-5.6%
Cash-on-Cash Return
4.4%
Cap rate
0.7%
Rent to Value Ratio

Active
$325,000
3
bds
|
2
ba
|
1,505
sqft
|
built
1963
2243 Edgebrook Ave, Saint Paul, MN 55119
$-239
Cash flow
-3.8%
Cash-on-Cash Return
4.8%
Cap rate
0.8%
Rent to Value Ratio

Active
$249,900
3
bds
|
2
ba
|
1,478
sqft
|
built
1983
1264 Ferndale St N, Saint Paul, MN 55119
$-404
Cash flow
-8.4%
Cash-on-Cash Return
3.7%
Cap rate
0.8%
Rent to Value Ratio
Active
$374,900
3
bds
|
3
ba
|
2,050
sqft
|
built
2019
2651 New Century Blvd S, Maplewood, MN 55119
$-740
Cash flow
-10.3%
Cash-on-Cash Return
3.3%
Cap rate
0.7%
Rent to Value Ratio