55408 Investment Properties for Sale
Browse homes for sale and investment properties in 55408. Refine your search by price, property type, or more.
Best cash flowing properties in 55408
Active
$349,000
4
bds
|
2
ba
|
1,838
sqft
|
built
1900
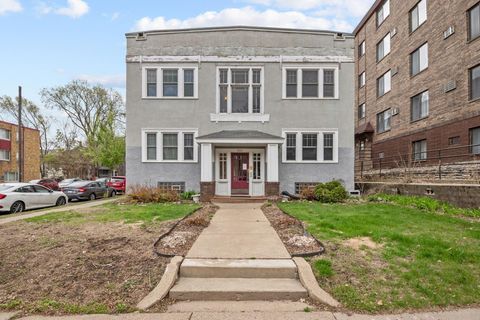
3148 3rd Ave S, Minneapolis, MN 55408
$73
Cash flow
1.1%
Cash-on-Cash Return
5.9%
Cap rate
0.7%
Rent to Value Ratio
Active
$94,900
0
bds
|
1
ba
|
400
sqft
|
built
1970
2616 Harriet Ave, Minneapolis, MN 55408
$4
Cash flow
0.2%
Cash-on-Cash Return
5.7%
Cap rate
1.2%
Rent to Value Ratio
33 out of 43 properties for sale in 55408
Limited Results Shown
Create a free account, or log in to reveal all property listings and enjoy the complete experience.
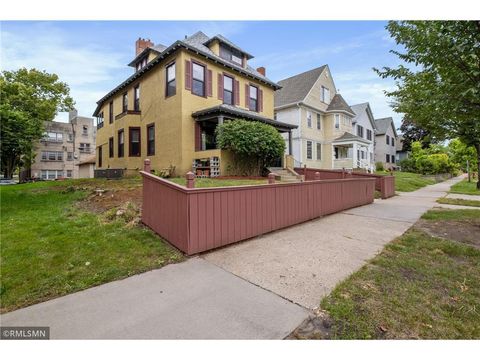
Active
$700,000
4
bds
|
2
ba
|
2,479
sqft
|
built
1909
3129 Holmes Ave S, Minneapolis, MN 55408
$-1,665
Cash flow
-12.4%
Cash-on-Cash Return
2.8%
Cap rate
0.5%
Rent to Value Ratio
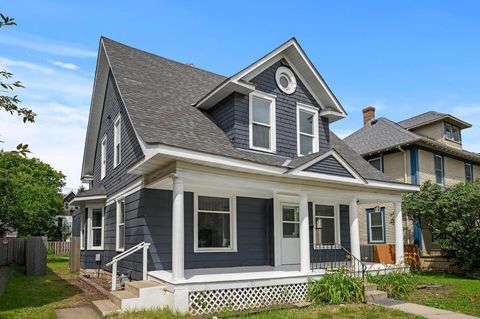
Active
$419,000
7
bds
|
2
ba
|
2,486
sqft
|
built
1890
3208 Pleasant Ave, Minneapolis, MN 55408
$-1,170
Cash flow
-14.6%
Cash-on-Cash Return
2.3%
Cap rate
0.5%
Rent to Value Ratio
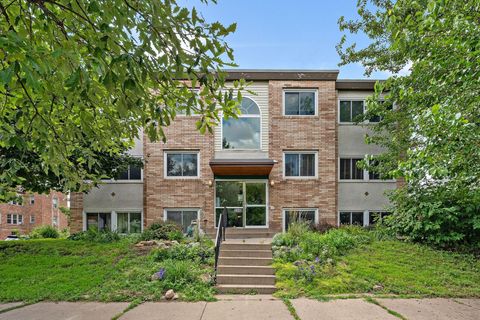
Active
$230,000
1
bds
|
1
ba
|
885
sqft
|
built
1979
2885 Knox Ave S, Minneapolis, MN 55408
$-960
Cash flow
-21.8%
Cash-on-Cash Return
0.7%
Cap rate
0.7%
Rent to Value Ratio

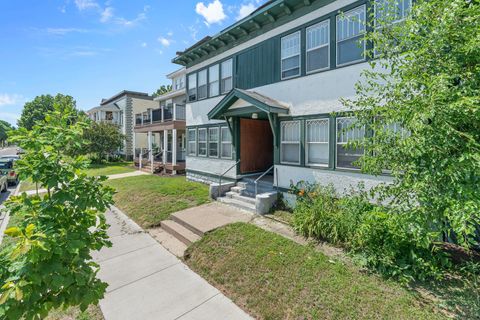
Active
$260,000
2
bds
|
1
ba
|
982
sqft
|
built
1963
2706 Humboldt Ave S, Minneapolis, MN 55408
$-971
Cash flow
-19.5%
Cash-on-Cash Return
1.2%
Cap rate
0.5%
Rent to Value Ratio
Active
$450,000
3
bds
|
2
ba
|
1,428
sqft
|
built
1913
1458 W 33rd St, Minneapolis, MN 55408
$-659
Cash flow
-7.6%
Cash-on-Cash Return
3.9%
Cap rate
0.6%
Rent to Value Ratio
Active
$599,900
7
bds
|
3
ba
|
3,959
sqft
|
built
1921
3448 Girard Ave S, Minneapolis, MN 55408
$-2,127
Cash flow
-18.5%
Cash-on-Cash Return
1.4%
Cap rate
0.4%
Rent to Value Ratio
Active
$219,900
1
bds
|
1
ba
|
818
sqft
|
built
2006
1211 Lagoon Ave, Minneapolis, MN 55408
$-516
Cash flow
-12.2%
Cash-on-Cash Return
2.9%
Cap rate
0.7%
Rent to Value Ratio
Active
$519,900
5
bds
|
2
ba
|
2,708
sqft
|
built
1900
3136 Lyndale Ave S, Minneapolis, MN 55408
$-942
Cash flow
-9.5%
Cash-on-Cash Return
3.5%
Cap rate
0.4%
Rent to Value Ratio
Active
$450,000
4
bds
|
1
ba
|
1,790
sqft
|
built
1907
3236 Hennepin Ave, Minneapolis, MN 55408
$-934
Cash flow
-10.8%
Cash-on-Cash Return
3.2%
Cap rate
0.7%
Rent to Value Ratio
Active
$189,900
2
bds
|
1
ba
|
840
sqft
|
built
1961
3446 Pleasant Ave, Minneapolis, MN 55408
$-624
Cash flow
-17.1%
Cash-on-Cash Return
1.7%
Cap rate
0.7%
Rent to Value Ratio
Active
$634,999
10
bds
|
4
ba
|
3,848
sqft
|
built
1915
3012 Bryant Ave S, Minneapolis, MN 55408
$-2,195
Cash flow
-18.0%
Cash-on-Cash Return
1.5%
Cap rate
0.4%
Rent to Value Ratio
Active
$499,900
4
bds
|
2
ba
|
1,682
sqft
|
built
1955
3413 Humboldt Ave S, Minneapolis, MN 55408
$-1,420
Cash flow
-14.8%
Cash-on-Cash Return
2.3%
Cap rate
0.5%
Rent to Value Ratio
Active
$619,900
4
bds
|
3
ba
|
3,000
sqft
|
built
1900
2742 Dupont Ave S, Minneapolis, MN 55408
$-1,048
Cash flow
-8.8%
Cash-on-Cash Return
3.7%
Cap rate
0.6%
Rent to Value Ratio
Active
$375,000
3
bds
|
1
ba
|
1,684
sqft
|
built
1906
3316 5th Ave S, Minneapolis, MN 55408
$-551
Cash flow
-7.7%
Cash-on-Cash Return
3.9%
Cap rate
0.7%
Rent to Value Ratio
Active
$539,900
6
bds
|
2
ba
|
2,632
sqft
|
built
1909
2724 Garfield Ave, Minneapolis, MN 55408
$-1,651
Cash flow
-16.0%
Cash-on-Cash Return
2.0%
Cap rate
0.4%
Rent to Value Ratio
Active
$120,000
1
bds
|
1
ba
|
780
sqft
|
built
1986
1425 W 28th St, Minneapolis, MN 55408
$-415
Cash flow
-18.0%
Cash-on-Cash Return
1.5%
Cap rate
1.2%
Rent to Value Ratio
Active
$325,000
2
bds
|
2
ba
|
1,405
sqft
|
built
1911
3502 Grand Ave S, Minneapolis, MN 55408
$-255
Cash flow
-4.1%
Cash-on-Cash Return
4.7%
Cap rate
0.7%
Rent to Value Ratio
Active
$249,000
1
bds
|
1
ba
|
900
sqft
|
built
1979
2885 Knox Ave S, Minneapolis, MN 55408
$-828
Cash flow
-17.3%
Cash-on-Cash Return
1.7%
Cap rate
0.8%
Rent to Value Ratio
Active
$119,000
1
bds
|
1
ba
|
0
sqft
|
built
1923
2739 Girard Ave S, Minneapolis, MN 55408
$-303
Cash flow
-13.3%
Cash-on-Cash Return
2.6%
Cap rate
0.9%
Rent to Value Ratio
Active
$570,000
7
bds
|
4
ba
|
3,676
sqft
|
built
1887
3035 Aldrich Ave S, Minneapolis, MN 55408
$-2,088
Cash flow
-19.1%
Cash-on-Cash Return
1.3%
Cap rate
0.4%
Rent to Value Ratio
Active
$498,900
4
bds
|
3
ba
|
2,724
sqft
|
built
1900
2813 Garfield Ave, Minneapolis, MN 55408
$-1,221
Cash flow
-12.8%
Cash-on-Cash Return
2.7%
Cap rate
0.5%
Rent to Value Ratio
Active
$269,900
2
bds
|
2
ba
|
1,200
sqft
|
built
1986
1425 W 28th St, Minneapolis, MN 55408
$-1,165
Cash flow
-22.5%
Cash-on-Cash Return
0.5%
Cap rate
0.7%
Rent to Value Ratio
Active
$124,900
1
bds
|
1
ba
|
860
sqft
|
built
1986
1425 W 28th St, Minneapolis, MN 55408
$-491
Cash flow
-20.5%
Cash-on-Cash Return
1.0%
Cap rate
1.2%
Rent to Value Ratio
Active
$337,900
4
bds
|
2
ba
|
2,024
sqft
|
built
1884
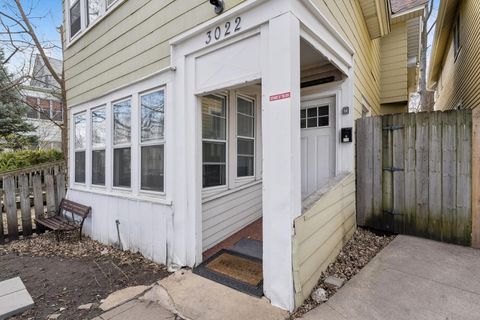
3022 Grand Ave S, Minneapolis, MN 55408
$-523
Cash flow
-8.1%
Cash-on-Cash Return
3.8%
Cap rate
0.6%
Rent to Value Ratio
Active
$115,000
1
bds
|
1
ba
|
650
sqft
|
built
1963
3018 Aldrich Ave S, Minneapolis, MN 55408
$-118
Cash flow
-5.4%
Cash-on-Cash Return
4.4%
Cap rate
1.2%
Rent to Value Ratio
Active
$2,375,000
3
bds
|
3
ba
|
4,033
sqft
|
built
1907
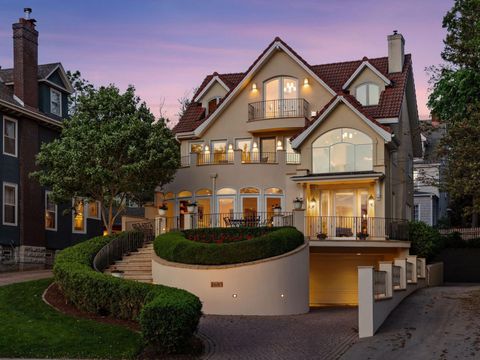
2683 E Lake Of The Isles Pkwy, Minneapolis, MN 55408
$-10,312
Cash flow
-22.7%
Cash-on-Cash Return
0.5%
Cap rate
0.2%
Rent to Value Ratio
Active
$220,000
2
bds
|
1
ba
|
1,022
sqft
|
built
1922
3501 Dupont Ave S, Minneapolis, MN 55408
$-368
Cash flow
-8.7%
Cash-on-Cash Return
3.7%
Cap rate
0.8%
Rent to Value Ratio
Active
$123,000
1
bds
|
1
ba
|
640
sqft
|
built
1958
3120 Hennepin Ave, Minneapolis, MN 55408
$-509
Cash flow
-21.6%
Cash-on-Cash Return
0.7%
Cap rate
1.0%
Rent to Value Ratio
Active
$385,000
2
bds
|
3
ba
|
1,424
sqft
|
built
2006
2828 Aldrich Ave S, Minneapolis, MN 55408
$-608
Cash flow
-8.2%
Cash-on-Cash Return
3.8%
Cap rate
0.8%
Rent to Value Ratio
Active
$720,000
8
bds
|
4
ba
|
2,856
sqft
|
built
1909
2740 Lyndale Ave S, Minneapolis, MN 55408
$-3,189
Cash flow
-23.1%
Cash-on-Cash Return
0.4%
Cap rate
0.3%
Rent to Value Ratio
Active
$1,495,000
2
bds
|
3
ba
|
2,359
sqft
|
built
2024
3041 Holmes Ave S, Minneapolis, MN 55408
$-4,209
Cash flow
-14.7%
Cash-on-Cash Return
2.3%
Cap rate
0.4%
Rent to Value Ratio