55442 Investment Properties for Sale
Browse homes for sale and investment properties in 55442. Refine your search by price, property type, or more.
Best cash flowing properties in 55442
Active
$153,000
2
bds
|
1
ba
|
950
sqft
|
built
1969
10840 Rockford Rd, Plymouth, MN 55442
$-186
Cash flow
-6.3%
Cash-on-Cash Return
4.2%
Cap rate
1.0%
Rent to Value Ratio
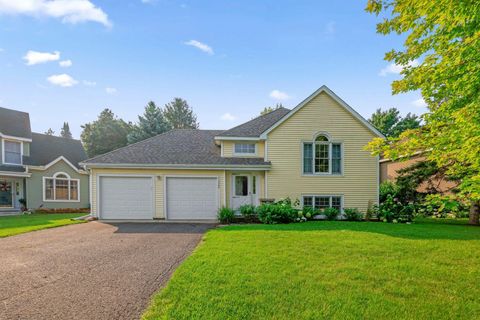
Active
$224,900
2
bds
|
2
ba
|
1,104
sqft
|
built
1988
5425 Orleans Ln N, Plymouth, MN 55442
$-205
Cash flow
-4.8%
Cash-on-Cash Return
4.6%
Cap rate
0.9%
Rent to Value Ratio
16 out of 33 properties for sale in 55442
Limited Results Shown
Create a free account, or log in to reveal all property listings and enjoy the complete experience.

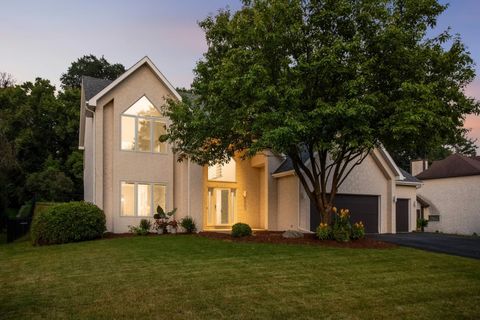
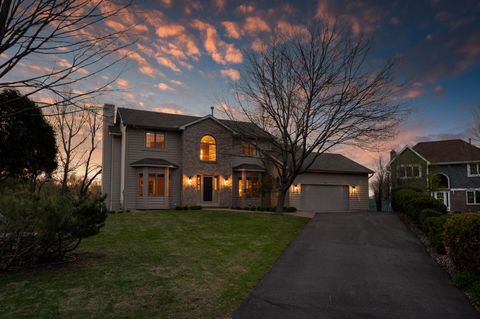
Active
$499,000
5
bds
|
4
ba
|
2,806
sqft
|
built
1980
5105 Balsam Ln N, Plymouth, MN 55442
$-557
Cash flow
-5.8%
Cash-on-Cash Return
4.3%
Cap rate
0.6%
Rent to Value Ratio
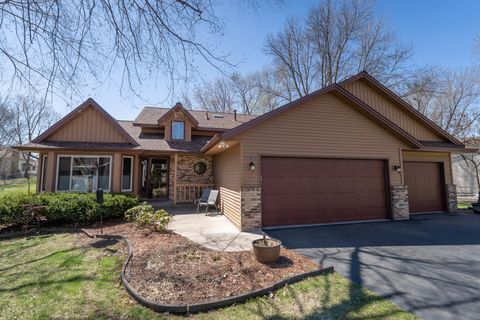
Active
$479,000
4
bds
|
2
ba
|
2,094
sqft
|
built
1992
5910 Pineview Ln N, Minneapolis, MN 55442
$-742
Cash flow
-8.1%
Cash-on-Cash Return
3.8%
Cap rate
0.6%
Rent to Value Ratio
Active
$475,000
3
bds
|
4
ba
|
2,473
sqft
|
built
1985
11420 49th Pl N, Minneapolis, MN 55442
$-517
Cash flow
-5.7%
Cash-on-Cash Return
4.4%
Cap rate
0.7%
Rent to Value Ratio
Active
$392,000
4
bds
|
3
ba
|
2,150
sqft
|
built
1987
10695 53rd Ave N, Plymouth, MN 55442
$-853
Cash flow
-11.4%
Cash-on-Cash Return
3.1%
Cap rate
0.7%
Rent to Value Ratio
Active
$399,900
4
bds
|
2
ba
|
1,698
sqft
|
built
1985
11266 50th Pl N, Minneapolis, MN 55442
$-377
Cash flow
-4.9%
Cash-on-Cash Return
4.5%
Cap rate
0.7%
Rent to Value Ratio
Active
$675,000
4
bds
|
4
ba
|
3,809
sqft
|
built
1993
4720 Goldenrod Ln N, Plymouth, MN 55442
$-1,080
Cash flow
-8.3%
Cash-on-Cash Return
3.8%
Cap rate
0.6%
Rent to Value Ratio
Active
$474,900
3
bds
|
3
ba
|
2,452
sqft
|
built
1986
12405 52nd Ave N, Plymouth, MN 55442
$-611
Cash flow
-6.7%
Cash-on-Cash Return
4.1%
Cap rate
0.6%
Rent to Value Ratio
Active
$299,000
2
bds
|
3
ba
|
1,790
sqft
|
built
2005
4940 Underwood Ln N, Plymouth, MN 55442
$-556
Cash flow
-9.7%
Cash-on-Cash Return
3.4%
Cap rate
0.8%
Rent to Value Ratio
Active
$669,900
5
bds
|
4
ba
|
3,425
sqft
|
built
1992
5825 Rosewood Ln N, Plymouth, MN 55442
$-1,438
Cash flow
-11.2%
Cash-on-Cash Return
3.1%
Cap rate
0.5%
Rent to Value Ratio
Active
$375,000
2
bds
|
2
ba
|
1,704
sqft
|
built
1999
10630 57th Pl N, Plymouth, MN 55442
$-935
Cash flow
-13.0%
Cash-on-Cash Return
2.7%
Cap rate
0.7%
Rent to Value Ratio
Active
$425,000
3
bds
|
4
ba
|
2,640
sqft
|
built
2001
10840 57th Ave N, Plymouth, MN 55442
$-813
Cash flow
-10.0%
Cash-on-Cash Return
3.4%
Cap rate
0.7%
Rent to Value Ratio
Active
$479,900
4
bds
|
3
ba
|
2,527
sqft
|
built
1984
5435 Norwood Ln N, Plymouth, MN 55442
$-227
Cash flow
-2.5%
Cash-on-Cash Return
5.1%
Cap rate
0.8%
Rent to Value Ratio
Active
$147,250
2
bds
|
1
ba
|
900
sqft
|
built
1970
10720 Rockford Rd, Plymouth, MN 55442
$-290
Cash flow
-10.3%
Cash-on-Cash Return
3.3%
Cap rate
1.1%
Rent to Value Ratio
Active
$997,777
5
bds
|
5
ba
|
6,123
sqft
|
built
1985
4335 Kirkwood Ln N, Plymouth, MN 55442
$-2,716
Cash flow
-14.2%
Cash-on-Cash Return
2.4%
Cap rate
0.4%
Rent to Value Ratio