58078 Investment Properties for Sale
Browse homes for sale and investment properties in 58078. Refine your search by price, property type, or more.
Best cash flowing properties in 58078
Active
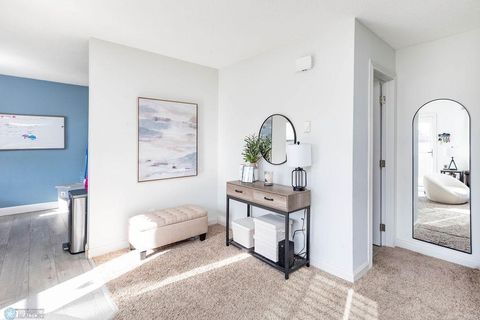
$149,000
2
bds
|
2
ba
|
1,632
sqft
|
built
1975
961 4th Ave W, West Fargo, ND 58078
$9
Cash flow
0.3%
Cash-on-Cash Return
5.8%
Cap rate
1.1%
Rent to Value Ratio
Active
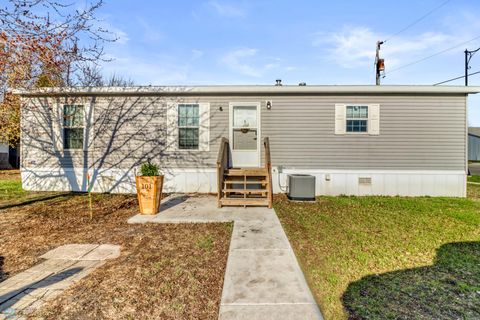
$55,000
3
bds
|
2
ba
|
1,248
sqft
|
built
2021
101 F St, West Fargo, ND 58078
$0
Cash flow
n/a
Cash-on-Cash Return
n/a
Cap rate
n/a
Rent to Value Ratio
20 out of 142 properties for sale in 58078
Limited Results Shown
Create a free account, or log in to reveal all property listings and enjoy the complete experience.

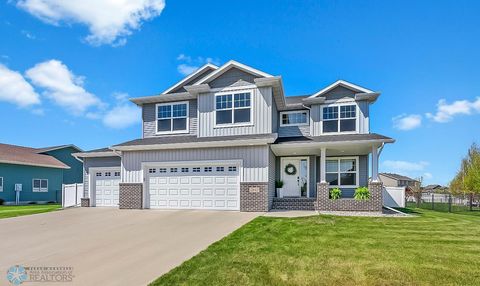
Active
$674,900
3
bds
|
3
ba
|
2,428
sqft
|
built
2017
1336 Goldenwood Dr, West Fargo, ND 58078
$-1,157
Cash flow
-8.9%
Cash-on-Cash Return
3.6%
Cap rate
0.6%
Rent to Value Ratio
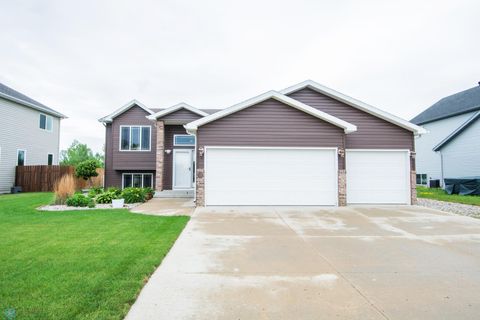
Active
$675,000
4
bds
|
4
ba
|
3,431
sqft
|
built
2016
2842 Mc Leod Dr E, West Fargo, ND 58078
$-1,766
Cash flow
-13.7%
Cash-on-Cash Return
2.5%
Cap rate
0.5%
Rent to Value Ratio
Active
$380,000
4
bds
|
3
ba
|
2,182
sqft
|
built
2010
4425 Westport Pkwy, West Fargo, ND 58078
$-273
Cash flow
-3.7%
Cash-on-Cash Return
4.8%
Cap rate
0.7%
Rent to Value Ratio
Active
$174,900
3
bds
|
2
ba
|
1,488
sqft
|
built
1975
961 4th Ave W, West Fargo, ND 58078
$-33
Cash flow
-1.0%
Cash-on-Cash Return
5.5%
Cap rate
1.0%
Rent to Value Ratio
Active
$285,000
3
bds
|
3
ba
|
1,694
sqft
|
built
2004
508 19th Ave W, West Fargo, ND 58078
$-496
Cash flow
-9.1%
Cash-on-Cash Return
3.6%
Cap rate
0.7%
Rent to Value Ratio
Active
$294,990
3
bds
|
3
ba
|
1,822
sqft
|
built
2009
1381 Westport Beach Way, West Fargo, ND 58078
$-212
Cash flow
-3.7%
Cash-on-Cash Return
4.8%
Cap rate
0.7%
Rent to Value Ratio
Active
$259,000
3
bds
|
2
ba
|
1,672
sqft
|
built
2003
1030 Oak Pl, West Fargo, ND 58078
$-120
Cash flow
-2.4%
Cash-on-Cash Return
5.1%
Cap rate
0.8%
Rent to Value Ratio
Active
$675,000
4
bds
|
2
ba
|
2,011
sqft
|
built
2015
3629 Houkom Dr E, West Fargo, ND 58078
$-1,358
Cash flow
-10.5%
Cash-on-Cash Return
3.3%
Cap rate
0.5%
Rent to Value Ratio

Active
$519,000
4
bds
|
4
ba
|
2,674
sqft
|
built
2021
1326 Commander Dr W, West Fargo, ND 58078
$-1,240
Cash flow
-12.5%
Cash-on-Cash Return
2.8%
Cap rate
0.5%
Rent to Value Ratio
Active
$350,000
2
bds
|
3
ba
|
1,631
sqft
|
built
1996
1426 Heatherwood Ct, West Fargo, ND 58078
$-770
Cash flow
-11.5%
Cash-on-Cash Return
3.0%
Cap rate
0.6%
Rent to Value Ratio

Active
$745,000
5
bds
|
3
ba
|
3,655
sqft
|
built
2016
2800 Mc Leod Dr E, West Fargo, ND 58078
$-1,216
Cash flow
-8.5%
Cash-on-Cash Return
3.7%
Cap rate
0.7%
Rent to Value Ratio

Active
$739,900
5
bds
|
3
ba
|
3,608
sqft
|
built
2014
3784 Bell Blvd E, West Fargo, ND 58078
$-1,665
Cash flow
-11.7%
Cash-on-Cash Return
3.0%
Cap rate
0.5%
Rent to Value Ratio
Active
$380,000
3
bds
|
3
ba
|
1,866
sqft
|
built
2018
977 Ashley Dr W, West Fargo, ND 58078
$-741
Cash flow
-10.2%
Cash-on-Cash Return
3.3%
Cap rate
0.7%
Rent to Value Ratio
Active
$534,000
5
bds
|
3
ba
|
3,084
sqft
|
built
2009
3463 Loberg Dr, West Fargo, ND 58078
$-1,171
Cash flow
-11.4%
Cash-on-Cash Return
3.0%
Cap rate
0.5%
Rent to Value Ratio
Active
$549,000
5
bds
|
3
ba
|
2,726
sqft
|
built
1997
4708 Mc Mahon Estates Ct, West Fargo, ND 58078
$-1,241
Cash flow
-11.8%
Cash-on-Cash Return
3.0%
Cap rate
0.5%
Rent to Value Ratio

Active
$779,900
5
bds
|
3
ba
|
3,038
sqft
|
built
1997
1814 Brentwood Ct, West Fargo, ND 58078
$-1,232
Cash flow
-8.2%
Cash-on-Cash Return
3.8%
Cap rate
0.6%
Rent to Value Ratio

Active
$339,000
1
bds
|
2
ba
|
1,352
sqft
|
built
2022
360 32nd Ave W, West Fargo, ND 58078
$-804
Cash flow
-12.4%
Cash-on-Cash Return
2.8%
Cap rate
0.7%
Rent to Value Ratio

Active
$345,000
1
bds
|
2
ba
|
1,352
sqft
|
built
2022
360 32nd Ave W, West Fargo, ND 58078
$-693
Cash flow
-10.5%
Cash-on-Cash Return
3.3%
Cap rate
0.7%
Rent to Value Ratio