60010 Investment Properties for Sale
Browse homes for sale and investment properties in 60010. Refine your search by price, property type, or more.
Best cash flowing properties in 60010
Active
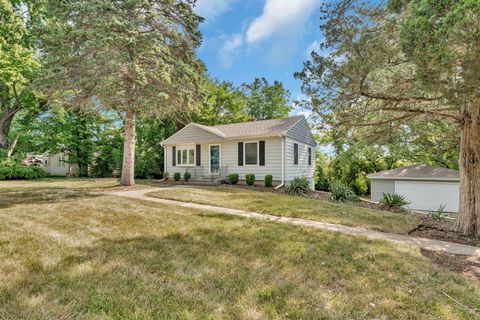
$339,850
3
bds
|
2
ba
|
1,250
sqft
|
built
1950
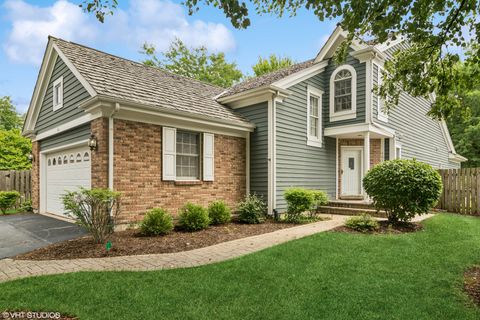
1107 S Hough St, Barrington, IL 60010
$-70
Cash flow
-1.1%
Cash-on-Cash Return
5.4%
Cap rate
0.9%
Rent to Value Ratio
Active
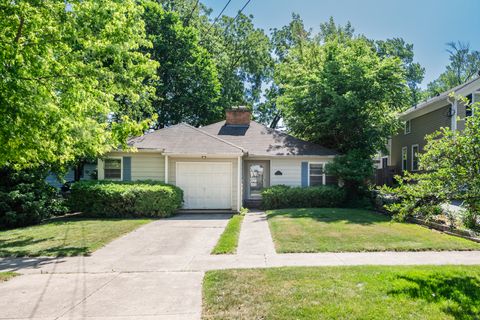
$325,000
2
bds
|
1
ba
|
1,223
sqft
|
built
1951
125 N Hager Ave, Barrington, IL 60010
$-270
Cash flow
-4.3%
Cash-on-Cash Return
4.7%
Cap rate
0.8%
Rent to Value Ratio
60 out of 79 properties for sale in 60010
Limited Results Shown
Create a free account, or log in to reveal all property listings and enjoy the complete experience.
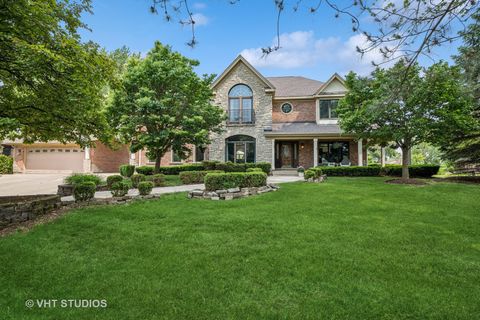
Active
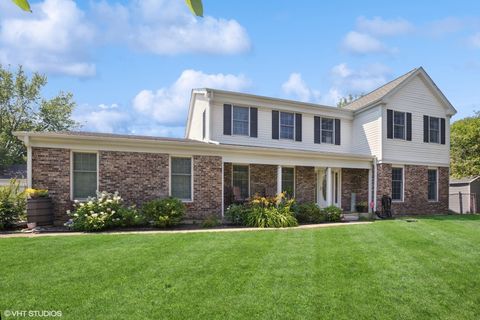
$649,990
4
bds
|
3
ba
|
2,656
sqft
|
built
1974
523 N Ela Rd, Barrington, IL 60010
$-1,432
Cash flow
-11.5%
Cash-on-Cash Return
3.0%
Cap rate
0.6%
Rent to Value Ratio

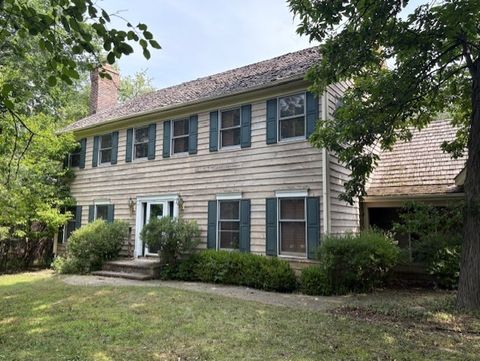
Active
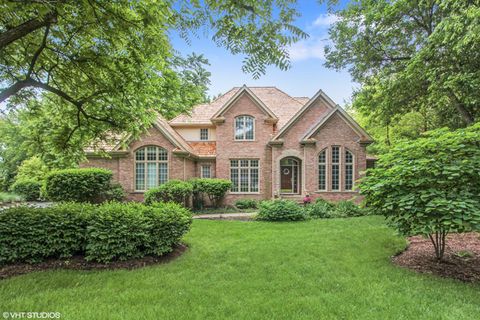
$1,300,000
3
bds
|
3
ba
|
5,849
sqft
|
built
2017
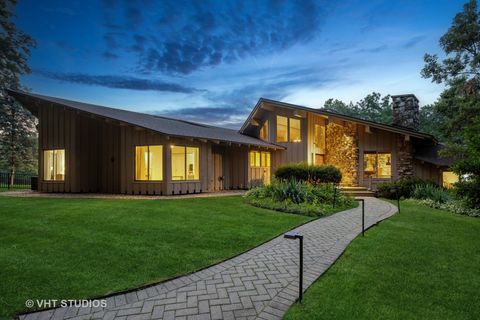
26303 W Merton Rd, Barrington, IL 60010
$-4,670
Cash flow
-18.7%
Cash-on-Cash Return
1.4%
Cap rate
0.3%
Rent to Value Ratio

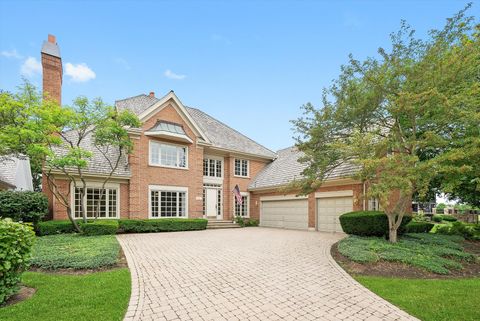
Active
$1,089,000
4
bds
|
6
ba
|
4,539
sqft
|
built
1994
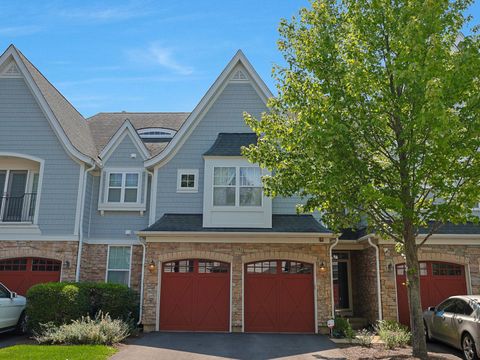
12 Riderwood Rd, North Barrington, IL 60010
$-2,918
Cash flow
-14.0%
Cash-on-Cash Return
2.5%
Cap rate
0.6%
Rent to Value Ratio
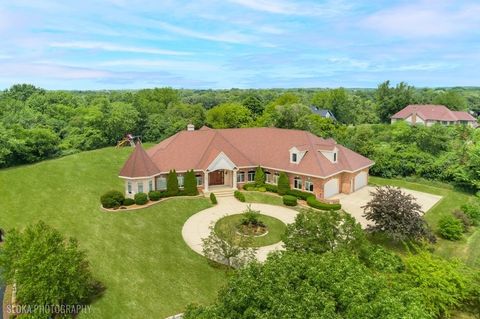
Active
$895,000
4
bds
|
5
ba
|
4,351
sqft
|
built
1996
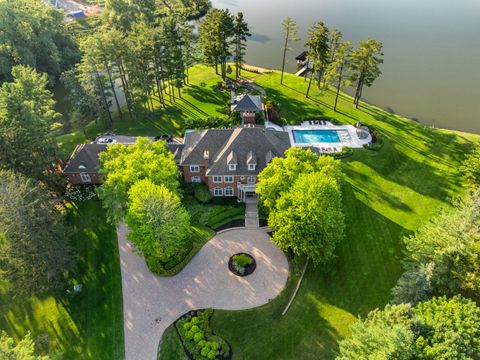
26495 Southgate Trl, Port Barrington, IL 60010
$-1,869
Cash flow
-10.9%
Cash-on-Cash Return
3.2%
Cap rate
0.6%
Rent to Value Ratio
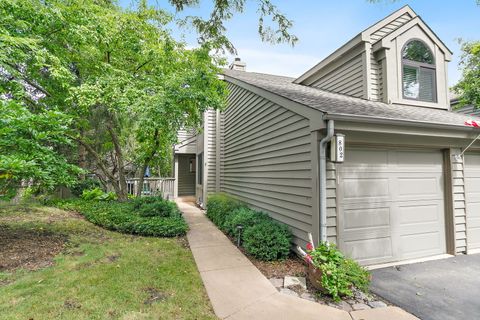
Active
$410,000
2
bds
|
3
ba
|
2,450
sqft
|
built
1990
802 Golf Ln, Lake Barrington, IL 60010
$-1,316
Cash flow
-16.7%
Cash-on-Cash Return
1.8%
Cap rate
0.7%
Rent to Value Ratio
Active
$695,000
4
bds
|
3
ba
|
2,238
sqft
|
built
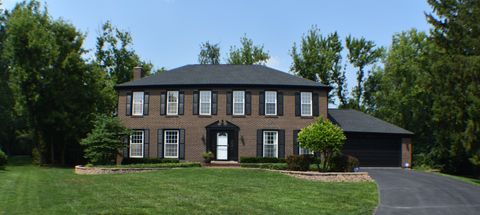
1963
248 Beverly Rd, Barrington, IL 60010
$-1,719
Cash flow
-12.9%
Cash-on-Cash Return
2.7%
Cap rate
0.5%
Rent to Value Ratio
Active
$720,000
4
bds
|
5
ba
|
3,446
sqft
|
built
1989
25410 N Cayuga Trl, Lake Barrington, IL 60010
$-1,770
Cash flow
-12.8%
Cash-on-Cash Return
2.7%
Cap rate
0.5%
Rent to Value Ratio
Active
$369,900
2
bds
|
3
ba
|
1,850
sqft
|
built
1990
4850 Prestwick Pl, Hoffman Estates, IL 60010
$-692
Cash flow
-9.8%
Cash-on-Cash Return
3.4%
Cap rate
0.8%
Rent to Value Ratio
Active
$659,900
4
bds
|
3
ba
|
2,112
sqft
|
built
1972
36 Ferndale Rd, Deer Park, IL 60010
$-1,508
Cash flow
-11.9%
Cash-on-Cash Return
2.9%
Cap rate
0.5%
Rent to Value Ratio
Active
$402,000
2
bds
|
3
ba
|
1,798
sqft
|
built
1991
4890 Prestwick Pl, Hoffman Estates, IL 60010
$-938
Cash flow
-12.2%
Cash-on-Cash Return
2.9%
Cap rate
0.7%
Rent to Value Ratio
Active
$495,000
4
bds
|
2
ba
|
1,300
sqft
|
built
1969
23036 W Long Grove Rd, Deer Park, IL 60010
$-1,169
Cash flow
-12.3%
Cash-on-Cash Return
2.8%
Cap rate
0.6%
Rent to Value Ratio
Active
$699,000
4
bds
|
2
ba
|
2,500
sqft
|
built
1926
500 North Ave, Barrington, IL 60010
$-2,003
Cash flow
-15.0%
Cash-on-Cash Return
2.2%
Cap rate
0.5%
Rent to Value Ratio
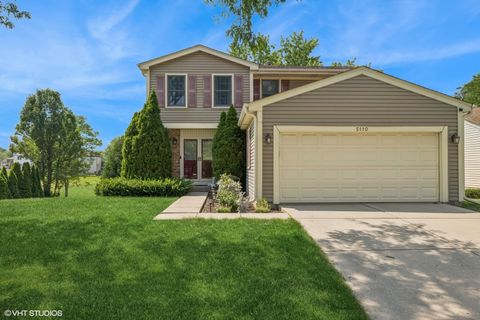
Active
$425,000
3
bds
|
2
ba
|
1,600
sqft
|
built
1978
5110 Chambers Dr, Hoffman Estates, IL 60010
$-743
Cash flow
-9.1%
Cash-on-Cash Return
3.6%
Cap rate
0.7%
Rent to Value Ratio
Active
$849,900
4
bds
|
3
ba
|
3,323
sqft
|
built
1988
5070 Thornbark Dr, Hoffman Estates, IL 60010
$-2,038
Cash flow
-12.5%
Cash-on-Cash Return
2.8%
Cap rate
0.5%
Rent to Value Ratio
Active
$795,000
4
bds
|
4
ba
|
5,000
sqft
|
built
1988
455 Eton Dr, North Barrington, IL 60010
$-2,293
Cash flow
-15.0%
Cash-on-Cash Return
2.2%
Cap rate
0.5%
Rent to Value Ratio
Active
$860,000
4
bds
|
4
ba
|
4,996
sqft
|
built
2000
513 Pond Gate Dr, Barrington, IL 60010
$-2,303
Cash flow
-14.0%
Cash-on-Cash Return
2.5%
Cap rate
0.6%
Rent to Value Ratio
Active
$1,150,000
4
bds
|
5
ba
|
4,185
sqft
|
built
2001
540 Harvard Ave, Barrington, IL 60010
$-3,237
Cash flow
-14.7%
Cash-on-Cash Return
2.3%
Cap rate
0.4%
Rent to Value Ratio
Active
$575,000
4
bds
|
4
ba
|
3,285
sqft
|
built
1988
25138 N Pawnee Rd, Barrington, IL 60010
$-1,064
Cash flow
-9.7%
Cash-on-Cash Return
3.5%
Cap rate
0.7%
Rent to Value Ratio
Active
$855,000
3
bds
|
4
ba
|
3,577
sqft
|
built
1989
16 Graystone Ct, North Barrington, IL 60010
$-1,317
Cash flow
-8.0%
Cash-on-Cash Return
3.8%
Cap rate
0.7%
Rent to Value Ratio
Active
$1,595,000
6
bds
|
7
ba
|
10,347
sqft
|
built
2007
20 Terra Vita Ct, South Barrington, IL 60010
$-5,967
Cash flow
-19.5%
Cash-on-Cash Return
1.2%
Cap rate
0.3%
Rent to Value Ratio
Active
$574,900
4
bds
|
3
ba
|
3,374
sqft
|
built
1970
28426 W Lindbergh Dr, Barrington, IL 60010
$-1,043
Cash flow
-9.5%
Cash-on-Cash Return
3.5%
Cap rate
0.6%
Rent to Value Ratio
Active
$749,000
4
bds
|
4
ba
|
3,260
sqft
|
built
1974
257 Kimberly Rd, North Barrington, IL 60010
$-1,882
Cash flow
-13.1%
Cash-on-Cash Return
2.7%
Cap rate
0.5%
Rent to Value Ratio
Active
$949,000
3
bds
|
3
ba
|
2,558
sqft
|
built
1959
23489 N Old Barrington Rd, North Barrington, IL 60010
$-3,136
Cash flow
-17.2%
Cash-on-Cash Return
1.7%
Cap rate
0.4%
Rent to Value Ratio
Active
$650,000
5
bds
|
3
ba
|
2,772
sqft
|
built
2003
215 N Hager Ave, Barrington, IL 60010
$-1,394
Cash flow
-11.2%
Cash-on-Cash Return
3.1%
Cap rate
0.6%
Rent to Value Ratio
Active
$1,275,000
4
bds
|
5
ba
|
5,728
sqft
|
built
1970
610 Signal Hill Rd, North Barrington, IL 60010
$-2,509
Cash flow
-10.3%
Cash-on-Cash Return
3.3%
Cap rate
0.6%
Rent to Value Ratio
Active
$650,000
4
bds
|
4
ba
|
3,187
sqft
|
built
2007
21947 W Tori Ln, Deer Park, IL 60010
$-1,797
Cash flow
-14.4%
Cash-on-Cash Return
2.4%
Cap rate
0.6%
Rent to Value Ratio
Active
$4,500,000
5
bds
|
7
ba
|
6,434
sqft
|
built
2001
92 Hawthorne Rd, Barrington, IL 60010
$-19,072
Cash flow
-22.1%
Cash-on-Cash Return
0.6%
Cap rate
0.1%
Rent to Value Ratio
Active
$765,000
4
bds
|
3
ba
|
2,748
sqft
|
built
1975
175 Hilltop Ave, Barrington, IL 60010
$-2,167
Cash flow
-14.8%
Cash-on-Cash Return
2.3%
Cap rate
0.5%
Rent to Value Ratio

Active
$2,000,000
5
bds
|
7
ba
|
8,706
sqft
|
built
2001
33 Aburdour Ct, North Barrington, IL 60010
$-6,080
Cash flow
-15.9%
Cash-on-Cash Return
2.0%
Cap rate
0.4%
Rent to Value Ratio
Active
$699,900
4
bds
|
3
ba
|
2,727
sqft
|
built
1999
104 Howe Ter, Barrington, IL 60010
$-1,646
Cash flow
-12.3%
Cash-on-Cash Return
2.9%
Cap rate
0.5%
Rent to Value Ratio
Active
$559,900
2
bds
|
2
ba
|
1,615
sqft
|
built
1990
401 Park Barrington Dr, Barrington, IL 60010
$-1,407
Cash flow
-13.1%
Cash-on-Cash Return
2.7%
Cap rate
0.6%
Rent to Value Ratio
Active
$699,000
4
bds
|
3
ba
|
3,338
sqft
|
built
1959
600 Eton Dr, North Barrington, IL 60010
$-1,852
Cash flow
-13.8%
Cash-on-Cash Return
2.5%
Cap rate
0.4%
Rent to Value Ratio
Active
$1,100,000
4
bds
|
3
ba
|
4,178
sqft
|
built
1960
170 N Rainbow Rd, North Barrington, IL 60010
$-1,482
Cash flow
-7.0%
Cash-on-Cash Return
4.1%
Cap rate
0.6%
Rent to Value Ratio
Active
$650,000
2
bds
|
3
ba
|
2,604
sqft
|
built
1993
461 Park Barrington Dr, South Barrington, IL 60010
$-1,724
Cash flow
-13.8%
Cash-on-Cash Return
2.5%
Cap rate
0.5%
Rent to Value Ratio
Active
$1,465,000
4
bds
|
6
ba
|
5,093
sqft
|
built
1995
110 Hillshire Dr, Inverness, IL 60010
$-4,867
Cash flow
-17.3%
Cash-on-Cash Return
1.7%
Cap rate
0.3%
Rent to Value Ratio
Active
$925,000
4
bds
|
4
ba
|
3,141
sqft
|
built
1983
8 Stone Ridge Dr, South Barrington, IL 60010
$-2,347
Cash flow
-13.2%
Cash-on-Cash Return
2.6%
Cap rate
0.5%
Rent to Value Ratio
Active
$2,450,000
5
bds
|
7
ba
|
10,452
sqft
|
built
2016
23 Enclave Ct, South Barrington, IL 60010
$-8,300
Cash flow
-17.7%
Cash-on-Cash Return
1.6%
Cap rate
0.4%
Rent to Value Ratio
Active
$225,000
2
bds
|
2
ba
|
1,100
sqft
|
built
1971
520 Shorely Dr, Barrington, IL 60010
$-583
Cash flow
-13.5%
Cash-on-Cash Return
2.6%
Cap rate
0.8%
Rent to Value Ratio