60013 Investment Properties for Sale
Browse homes for sale and investment properties in 60013. Refine your search by price, property type, or more.
Best cash flowing properties in 60013
Active
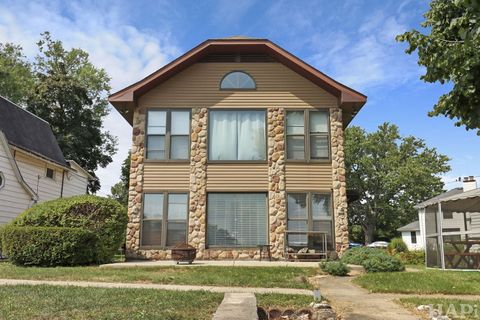
$369,000
3
bds
|
2
ba
|
1,650
sqft
|
built
215 Northwest Hwy, Cary, IL 60013
$-198
Cash flow
-2.8%
Cash-on-Cash Return
5.0%
Cap rate
0.9%
Rent to Value Ratio
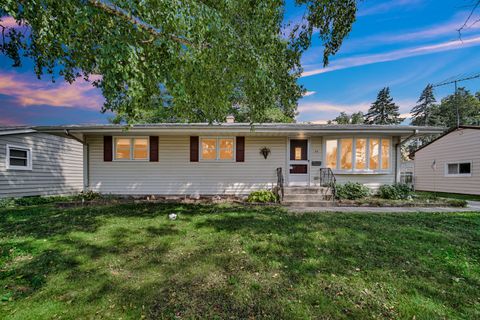
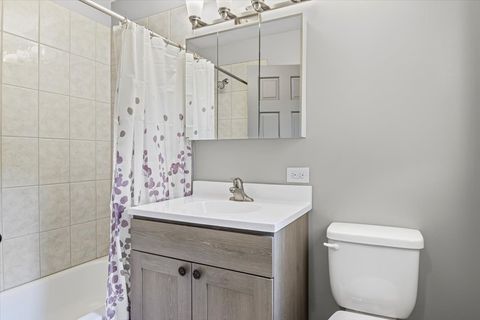
Active
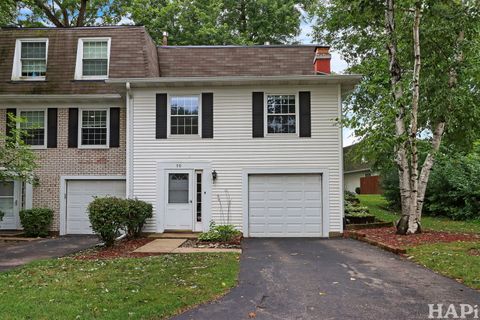
$224,900
3
bds
|
3
ba
|
1,357
sqft
|
built
1973
50 Bright Oaks Cir, Cary, IL 60013
$-289
Cash flow
-6.7%
Cash-on-Cash Return
4.1%
Cap rate
0.9%
Rent to Value Ratio
17 out of 21 properties for sale in 60013
Limited Results Shown
Create a free account, or log in to reveal all property listings and enjoy the complete experience.
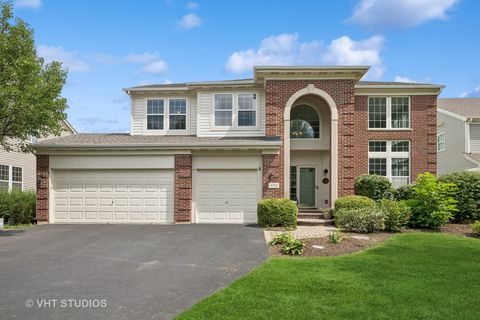
Active
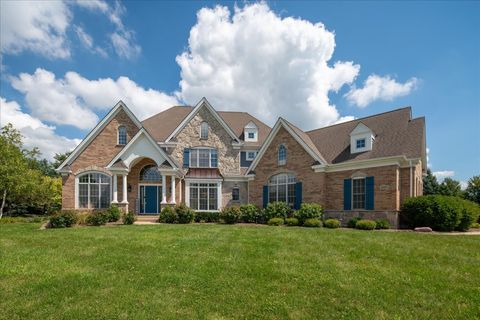
$810,000
5
bds
|
4
ba
|
3,037
sqft
|
built
2003
28413 W Harvest Glen Cir, Cary, IL 60013
$-1,801
Cash flow
-11.6%
Cash-on-Cash Return
3.0%
Cap rate
0.6%
Rent to Value Ratio
Active
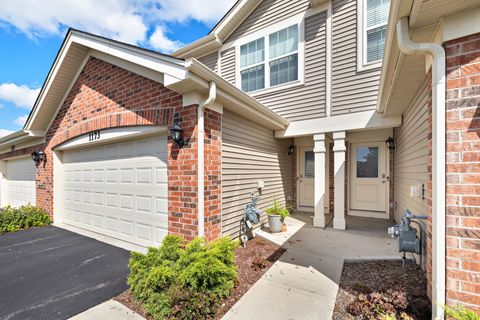
$319,900
2
bds
|
3
ba
|
1,359
sqft
|
built
2021
1173 Amber Dr, Cary, IL 60013
$-481
Cash flow
-7.8%
Cash-on-Cash Return
3.9%
Cap rate
0.8%
Rent to Value Ratio
Active
$325,000
3
bds
|
2
ba
|
2,258
sqft
|
built
1962
26 Wagner Dr, Cary, IL 60013
$-635
Cash flow
-10.2%
Cash-on-Cash Return
3.3%
Cap rate
0.6%
Rent to Value Ratio
Active
$374,900
3
bds
|
1
ba
|
1,572
sqft
|
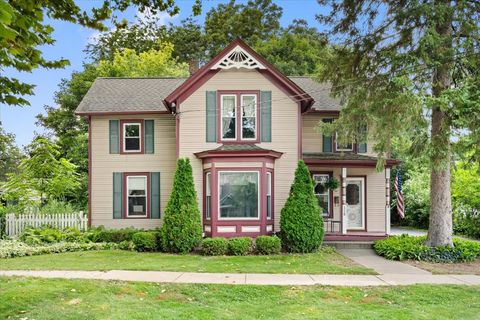
built
1917
2016 Grove Ln, Cary, IL 60013
$-940
Cash flow
-13.1%
Cash-on-Cash Return
2.7%
Cap rate
0.6%
Rent to Value Ratio
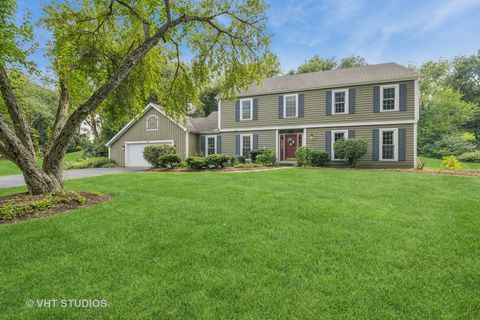
Active
$575,000
4
bds
|
4
ba
|
3,179
sqft
|
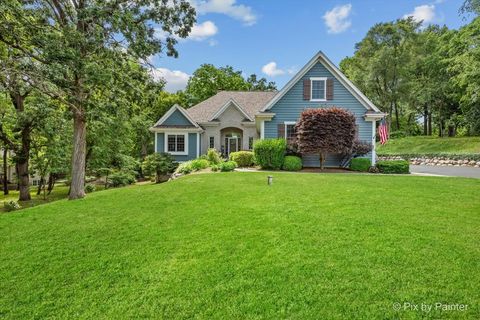
built
2003
390 Sterling Cir, Cary, IL 60013
$-1,314
Cash flow
-11.9%
Cash-on-Cash Return
2.9%
Cap rate
0.6%
Rent to Value Ratio
Active
$585,000
4
bds
|
4
ba
|
2,500
sqft
|
built
1986
55 Cahill Rd, Trout Valley, IL 60013
$-1,522
Cash flow
-13.6%
Cash-on-Cash Return
2.6%
Cap rate
0.6%
Rent to Value Ratio
Active
$365,000
4
bds
|
2
ba
|
2,104
sqft
|
built
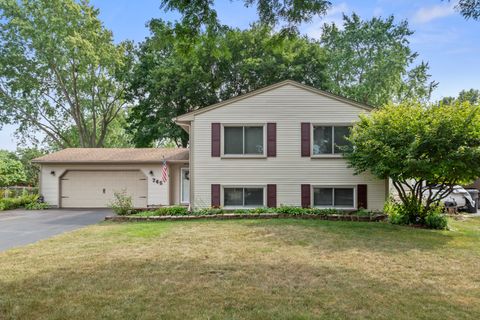
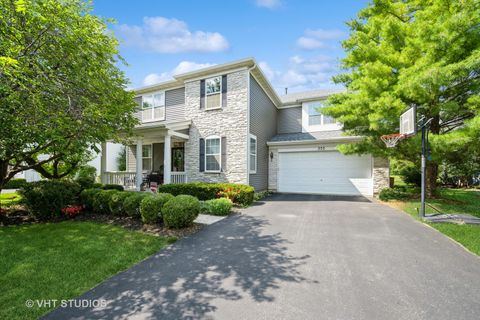
1978
745 Merrimac St, Cary, IL 60013
$-444
Cash flow
-6.3%
Cash-on-Cash Return
4.2%
Cap rate
0.8%
Rent to Value Ratio
Active
$585,000
4
bds
|
6
ba
|
3,922
sqft
|
built
2004
380 Merion Dr, Cary, IL 60013
$-1,165
Cash flow
-10.4%
Cash-on-Cash Return
3.3%
Cap rate
0.7%
Rent to Value Ratio
Active
$275,000
4
bds
|
2
ba
|
1,967
sqft
|
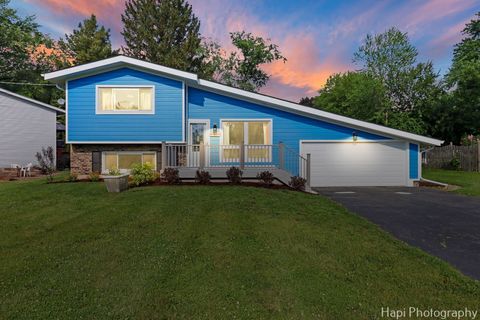
built
116 Spring St, Cary, IL 60013
$-341
Cash flow
-6.5%
Cash-on-Cash Return
4.2%
Cap rate
0.8%
Rent to Value Ratio
Active
$549,900
4
bds
|
2
ba
|
3,139
sqft
|
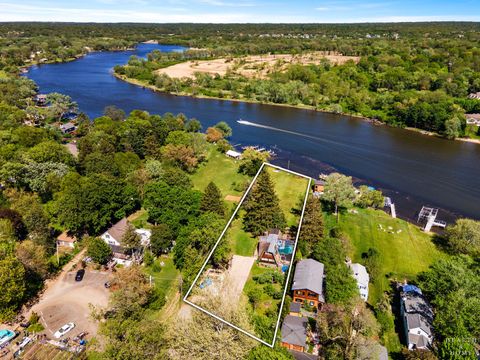
built
1971
24211 N Riverside Dr, Cary, IL 60013
$-1,353
Cash flow
-12.8%
Cash-on-Cash Return
2.7%
Cap rate
0.6%
Rent to Value Ratio
Active
$521,000
4
bds
|
3
ba
|
3,420
sqft
|
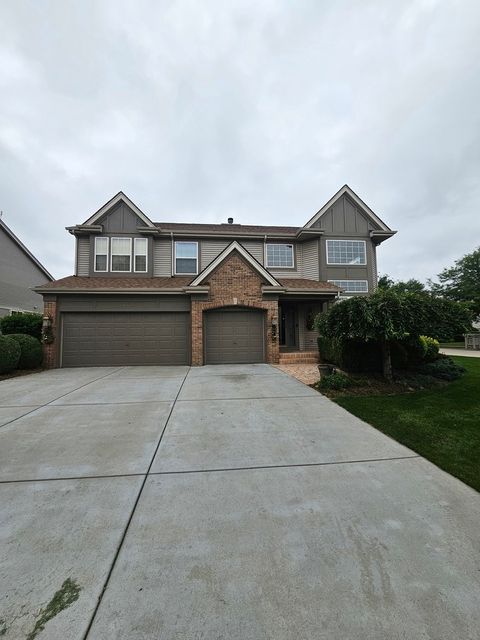
built
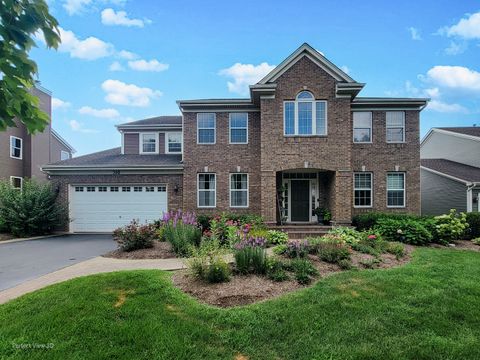
2002
322 Parkstone Dr, Cary, IL 60013
$-1,205
Cash flow
-12.1%
Cash-on-Cash Return
2.9%
Cap rate
0.7%
Rent to Value Ratio
Active
$499,500
5
bds
|
3
ba
|
3,073
sqft
|
built
2001
10 Montclair Dr, Cary, IL 60013
$-1,107
Cash flow
-11.6%
Cash-on-Cash Return
3.0%
Cap rate
0.7%
Rent to Value Ratio
Active
$385,000
3
bds
|
2
ba
|
2,425
sqft
|
built
1973
6312 Londonderry Dr, Cary, IL 60013
$-335
Cash flow
-4.5%
Cash-on-Cash Return
4.6%
Cap rate
0.8%
Rent to Value Ratio
Active
$725,000
5
bds
|
4
ba
|
4,297
sqft
|
built
2006
6407 Kingsbridge Dr, Cary, IL 60013
$-2,124
Cash flow
-15.3%
Cash-on-Cash Return
2.2%
Cap rate
0.6%
Rent to Value Ratio
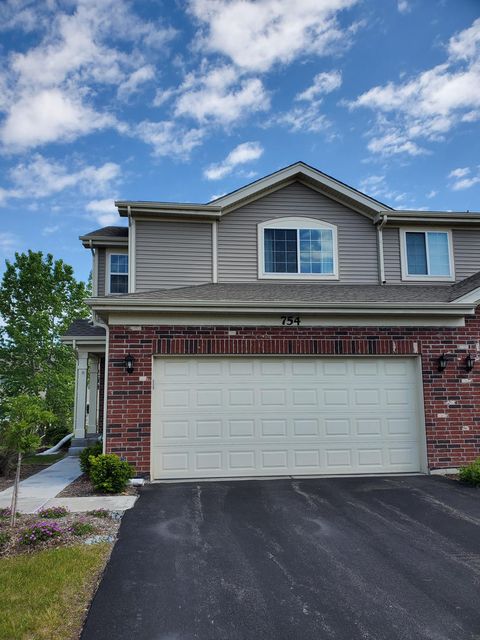
Active
$359,900
3
bds
|
3
ba
|
1,574
sqft
|
built
2023
754 Westbury Dr, Cary, IL 60013
$-612
Cash flow
-8.9%
Cash-on-Cash Return
3.6%
Cap rate
0.8%
Rent to Value Ratio