60425 Investment Properties for Sale
Browse homes for sale and investment properties in 60425. Refine your search by price, property type, or more.
Best cash flowing properties in 60425
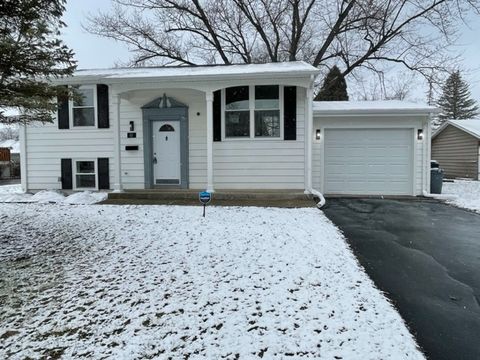
Active
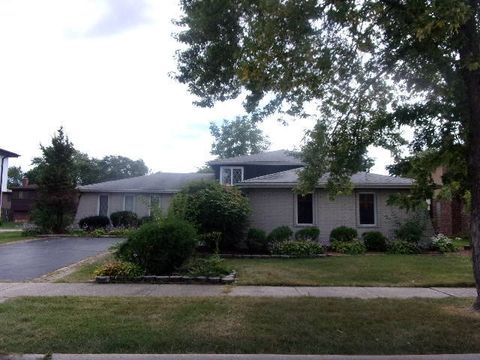
$250,000
3
bds
|
3
ba
|
2,008
sqft
|
built
1975
951 E 193rd St, Glenwood, IL 60425
$392
Cash flow
8.2%
Cash-on-Cash Return
7.6%
Cap rate
1.3%
Rent to Value Ratio
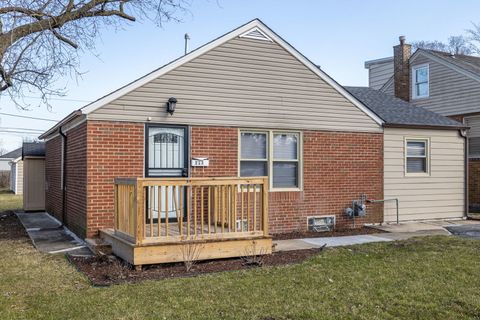
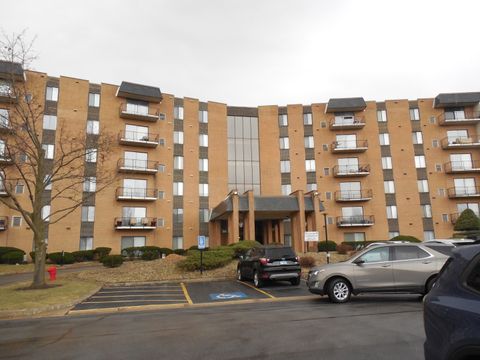
Active
$120,700
2
bds
|
1
ba
|
809
sqft
|
built
1954
830 E 191st Pl, Glenwood, IL 60425
$301
Cash flow
13.0%
Cash-on-Cash Return
8.7%
Cap rate
1.7%
Rent to Value Ratio
13 out of 30 properties for sale in 60425
Limited Results Shown
Create a free account, or log in to reveal all property listings and enjoy the complete experience.
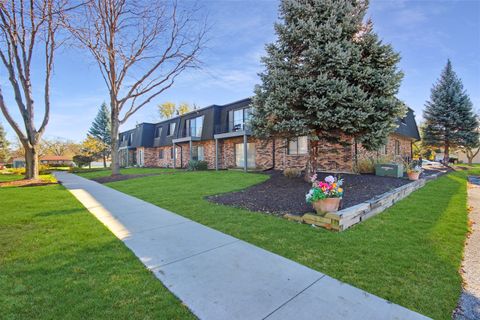
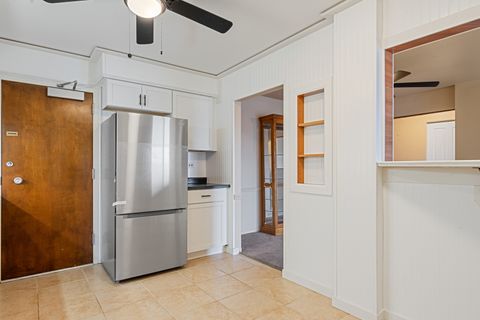
Active
$134,900
2
bds
|
2
ba
|
1,000
sqft
|
built
1974
900 W Sunset Dr, Glenwood, IL 60425
$267
Cash flow
10.3%
Cash-on-Cash Return
8.1%
Cap rate
1.5%
Rent to Value Ratio
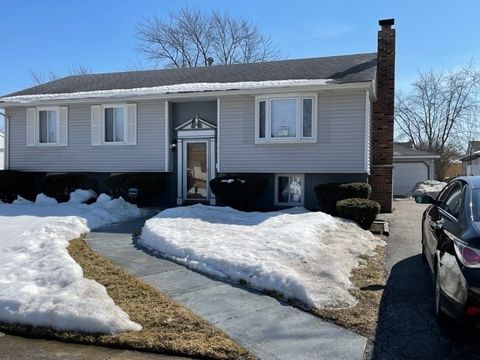
Active
$209,000
3
bds
|
2
ba
|
964
sqft
|
built
1956
113 N Rebecca St, Glenwood, IL 60425
$-48
Cash flow
-1.2%
Cash-on-Cash Return
5.4%
Cap rate
1.1%
Rent to Value Ratio

Active
$294,700
3
bds
|
2
ba
|
1,088
sqft
|
built
1963
214 N Gay Ct, Glenwood, IL 60425
$-475
Cash flow
-8.4%
Cash-on-Cash Return
3.7%
Cap rate
0.8%
Rent to Value Ratio

Active
$220,000
3
bds
|
1
ba
|
1,416
sqft
|
built
1923
22 W Main St, Glenwood, IL 60425
$175
Cash flow
4.2%
Cash-on-Cash Return
6.6%
Cap rate
1.2%
Rent to Value Ratio

Active
$218,000
4
bds
|
2
ba
|
1,690
sqft
|
built
1972
436 N Pleasant Dr, Glenwood, IL 60425
$120
Cash flow
2.9%
Cash-on-Cash Return
6.3%
Cap rate
1.3%
Rent to Value Ratio
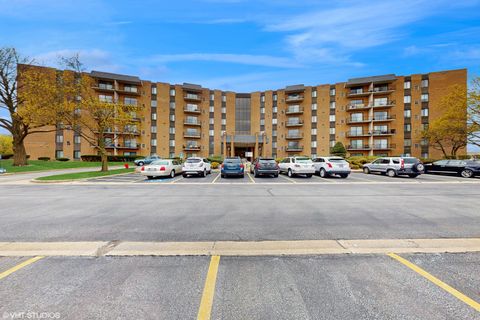
Active
$155,000
2
bds
|
2
ba
|
1,200
sqft
|
built
1971
700 N Bruce Ln, Glenwood, IL 60425
$118
Cash flow
4.0%
Cash-on-Cash Return
6.6%
Cap rate
1.3%
Rent to Value Ratio

Active
$120,000
2
bds
|
1
ba
|
700
sqft
|
built
1972
830 E 191st Pl, Glenwood, IL 60425
$96
Cash flow
4.2%
Cash-on-Cash Return
6.6%
Cap rate
1.4%
Rent to Value Ratio
Active
$119,000
2
bds
|
2
ba
|
1,100
sqft
|
built
1974
900 W Sunset Dr, Glenwood, IL 60425
$101
Cash flow
4.4%
Cash-on-Cash Return
6.7%
Cap rate
1.7%
Rent to Value Ratio
Active
$229,000
2
bds
|
2
ba
|
763
sqft
|
built
1967
40 N Sycamore Ln, Glenwood, IL 60425
$234
Cash flow
5.3%
Cash-on-Cash Return
6.9%
Cap rate
1.1%
Rent to Value Ratio
Active
$235,000
4
bds
|
2
ba
|
1,800
sqft
|
built
1970
304 E Birch Dr, Glenwood, IL 60425
$235
Cash flow
5.2%
Cash-on-Cash Return
6.9%
Cap rate
1.1%
Rent to Value Ratio
Active
$195,000
3
bds
|
1
ba
|
950
sqft
|
built
1971
110 N Oak St, Glenwood, IL 60425
$120
Cash flow
3.2%
Cash-on-Cash Return
6.4%
Cap rate
1.1%
Rent to Value Ratio