60430 Investment Properties for Sale
Browse homes for sale and investment properties in 60430. Refine your search by price, property type, or more.
Best cash flowing properties in 60430
Active
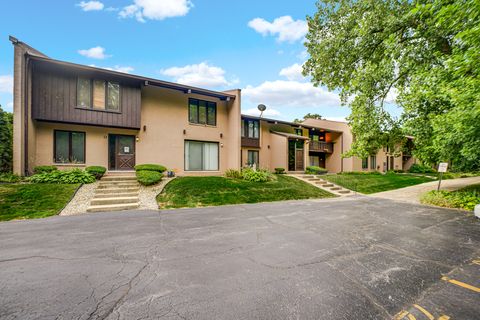
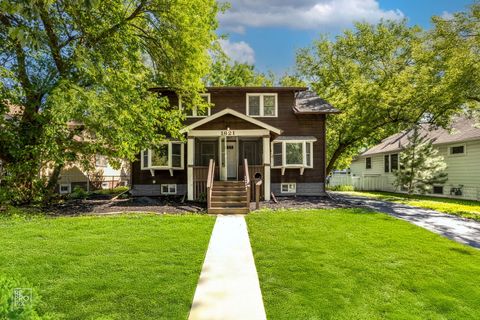
$147,999
2
bds
|
2
ba
|
1,000
sqft
|
built
1972
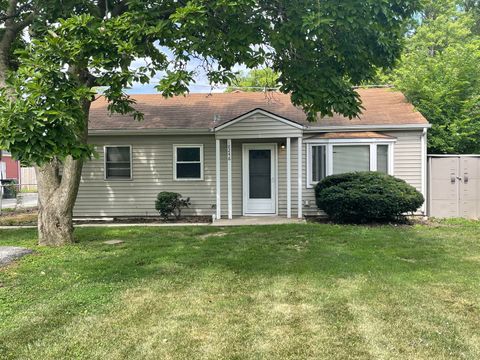
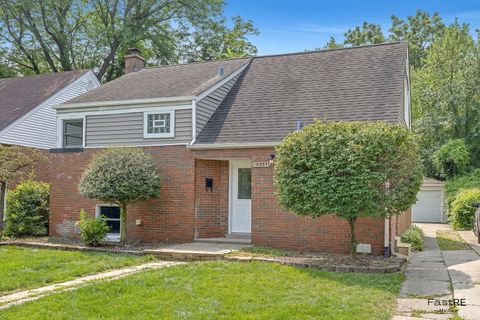
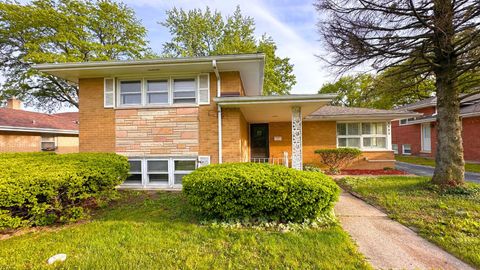
1100 Holbrook Rd, Homewood, IL 60430
$437
Cash flow
15.4%
Cash-on-Cash Return
9.2%
Cap rate
1.4%
Rent to Value Ratio
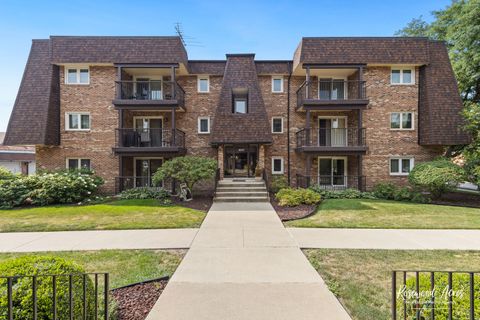
Active
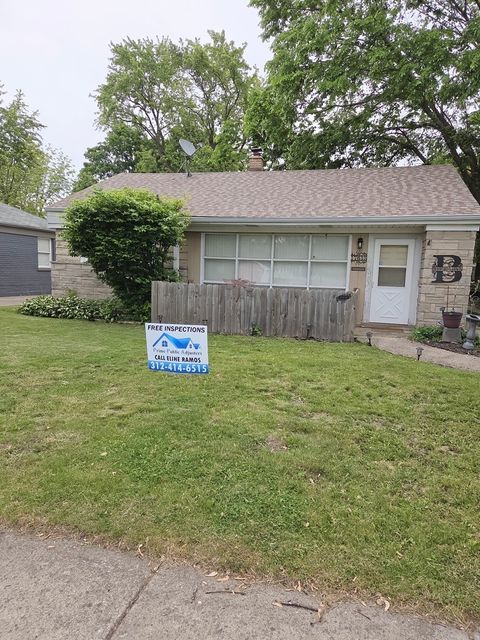
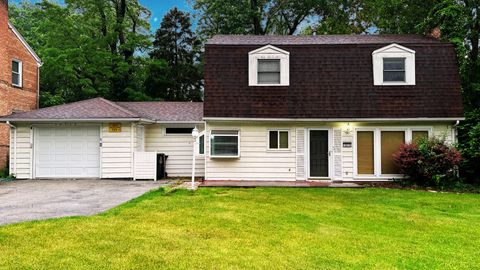
$199,900
3
bds
|
1
ba
|
1,340
sqft
|
built
1950
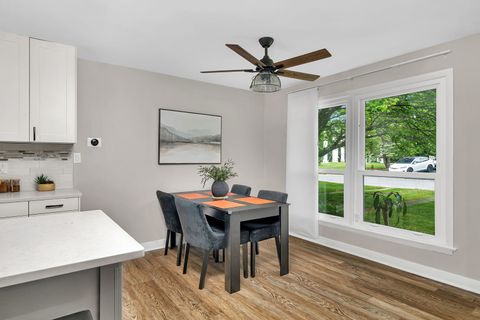
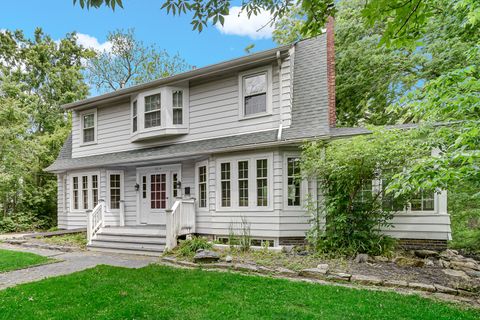
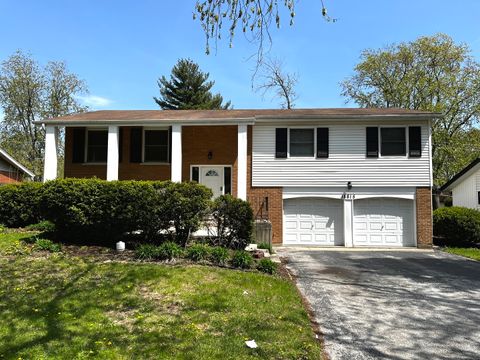
17613 Dundee Ave, Homewood, IL 60430
$383
Cash flow
10.0%
Cash-on-Cash Return
8.0%
Cap rate
1.3%
Rent to Value Ratio
41 out of 43 properties for sale in 60430
Limited Results Shown
Create a free account, or log in to reveal all property listings and enjoy the complete experience.
Active
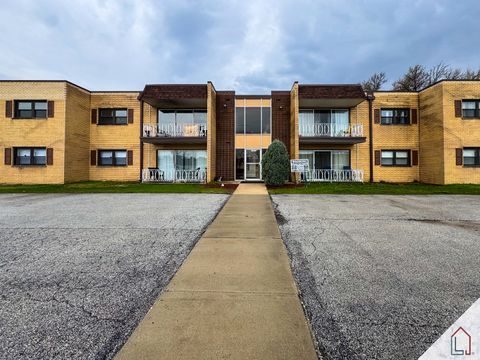
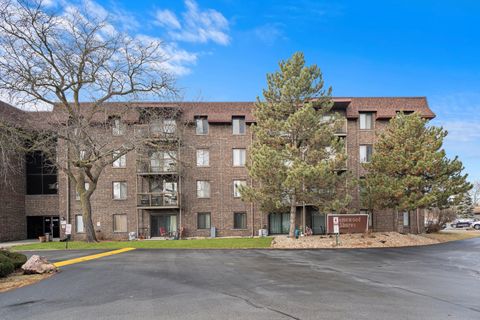
$132,900
2
bds
|
2
ba
|
1,000
sqft
|
built
1969
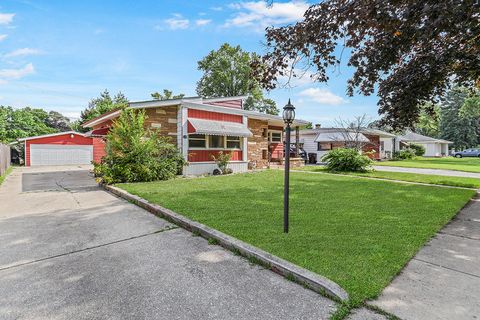
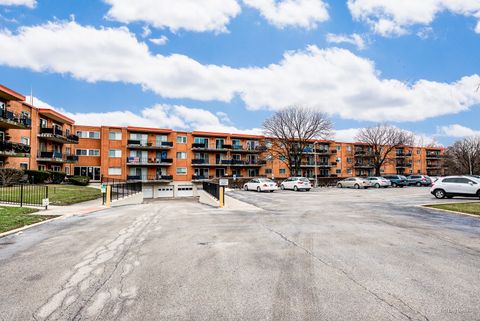
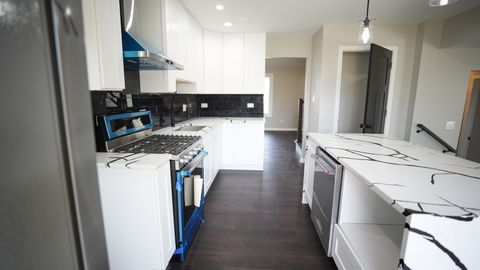
18320 Cherry Creek Dr, Homewood, IL 60430
$0
Cash flow
0.0%
Cash-on-Cash Return
5.7%
Cap rate
1.5%
Rent to Value Ratio
Active
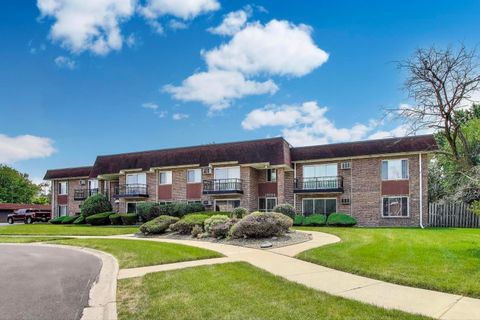
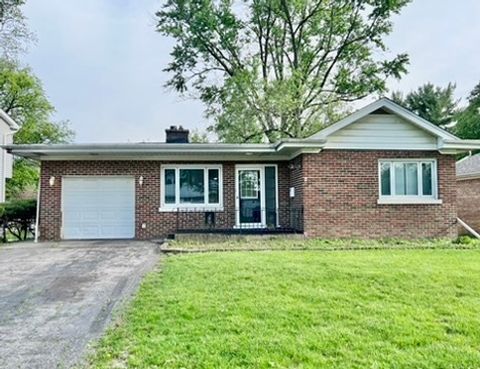
$149,000
2
bds
|
2
ba
|
1,102
sqft
|
built
1971
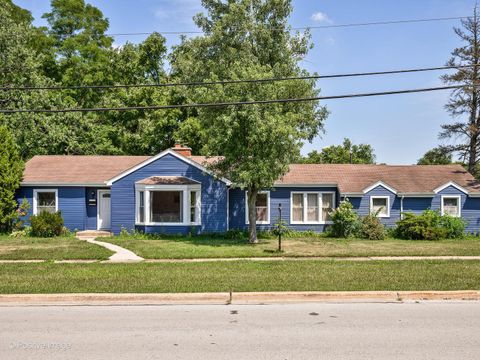
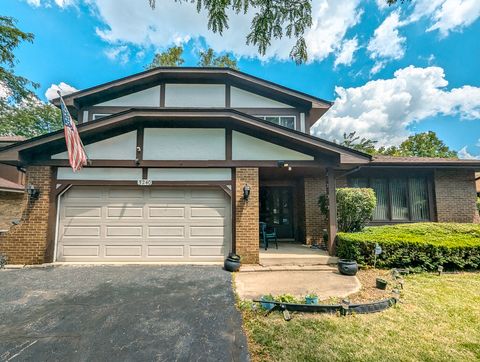
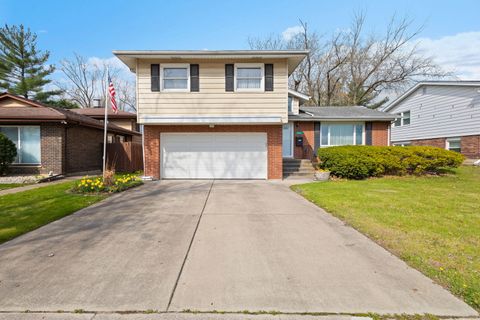
18223 Hart Dr, Homewood, IL 60430
$-77
Cash flow
-2.7%
Cash-on-Cash Return
5.1%
Cap rate
1.3%
Rent to Value Ratio
Active
$349,900
3
bds
|
3
ba
|
1,290
sqft
|
built
1983
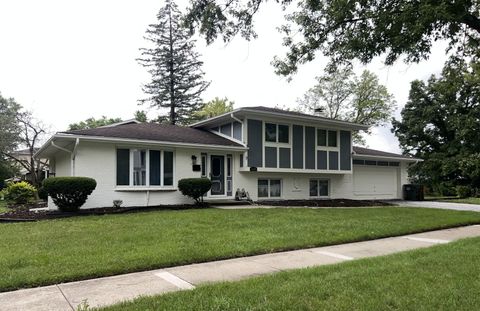
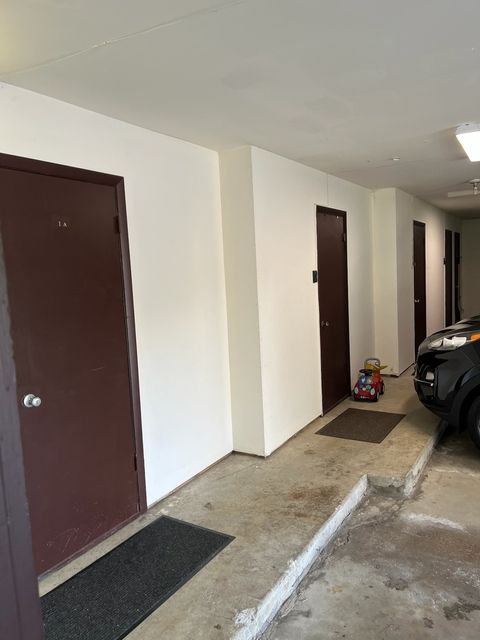
1115 Birch Rd, Homewood, IL 60430
$-327
Cash flow
-4.9%
Cash-on-Cash Return
4.6%
Cap rate
0.9%
Rent to Value Ratio
Active
$332,000
3
bds
|
3
ba
|
1,864
sqft
|
built
1955
1121 Olive Rd, Homewood, IL 60430
$-389
Cash flow
-6.1%
Cash-on-Cash Return
4.3%
Cap rate
0.8%
Rent to Value Ratio
Active
$285,000
3
bds
|
2
ba
|
1,497
sqft
|
built
1952
18530 Stedhall Rd, Homewood, IL 60430
$114
Cash flow
2.1%
Cash-on-Cash Return
6.2%
Cap rate
1.0%
Rent to Value Ratio
Active
$171,000
2
bds
|
2
ba
|
1,000
sqft
|
built
1984
18137 Martin Ave, Homewood, IL 60430
$-96
Cash flow
-2.9%
Cash-on-Cash Return
5.0%
Cap rate
1.2%
Rent to Value Ratio
Active
$175,000
2
bds
|
1
ba
|
864
sqft
|
built
1954
18246 Martin Ave, Homewood, IL 60430
$54
Cash flow
1.6%
Cash-on-Cash Return
6.0%
Cap rate
1.1%
Rent to Value Ratio
Active
$339,500
4
bds
|
2
ba
|
1,632
sqft
|
built
1970
2533 Hickory Rd, Homewood, IL 60430
$-273
Cash flow
-4.2%
Cash-on-Cash Return
4.7%
Cap rate
0.9%
Rent to Value Ratio
Active
$225,000
3
bds
|
1
ba
|
1,067
sqft
|
built
1953
1120 183rd St, Homewood, IL 60430
$100
Cash flow
2.3%
Cash-on-Cash Return
6.2%
Cap rate
1.1%
Rent to Value Ratio
Active
$275,000
3
bds
|
2
ba
|
1,718
sqft
|
built
1953
18327 Argyle Ave, Homewood, IL 60430
$130
Cash flow
2.5%
Cash-on-Cash Return
6.2%
Cap rate
1.0%
Rent to Value Ratio
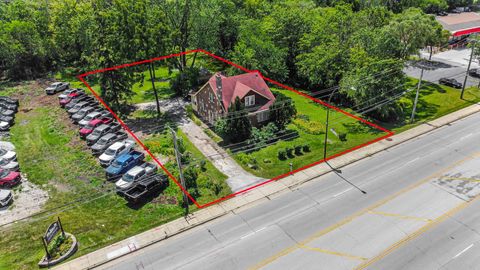
Active
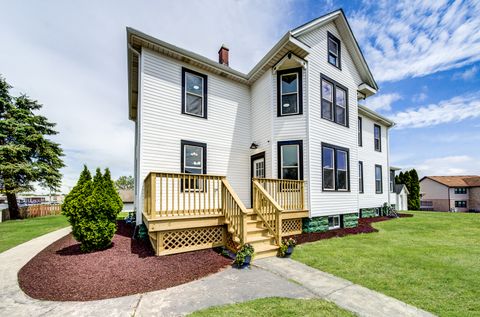
$698,000
5
bds
|
4
ba
|
3,400
sqft
|
built
1905
18445 Kedzie Ave, Homewood, IL 60430
$-2,256
Cash flow
-16.9%
Cash-on-Cash Return
1.8%
Cap rate
0.4%
Rent to Value Ratio
Active
$279,000
3
bds
|
3
ba
|
1,667
sqft
|
built
1963
18745 Queens Rd, Homewood, IL 60430
$-9
Cash flow
-0.2%
Cash-on-Cash Return
5.6%
Cap rate
1.0%
Rent to Value Ratio
Active
$250,000
3
bds
|
2
ba
|
938
sqft
|
built
1953
18509 Stedhall Rd, Homewood, IL 60430
$-139
Cash flow
-2.9%
Cash-on-Cash Return
5.0%
Cap rate
0.9%
Rent to Value Ratio
Active
$310,000
3
bds
|
2
ba
|
1,418
sqft
|
built
1959
18823 Ashland Ave, Homewood, IL 60430
$-502
Cash flow
-8.4%
Cash-on-Cash Return
3.7%
Cap rate
0.8%
Rent to Value Ratio
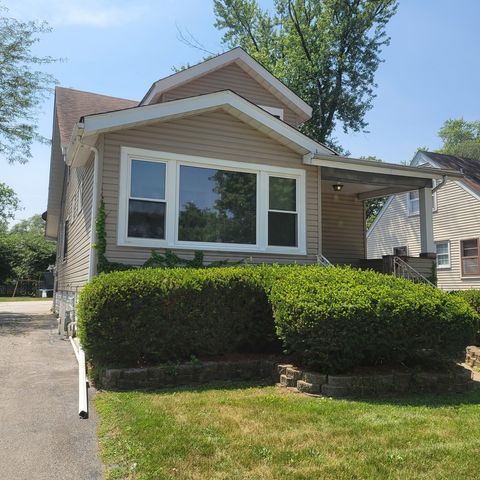
Active
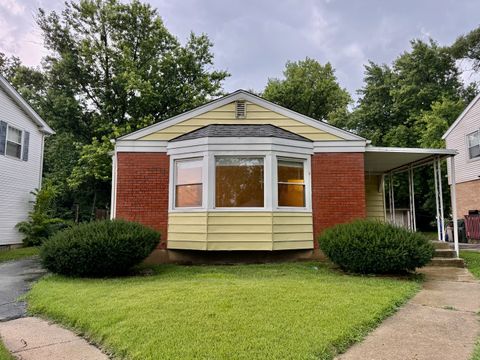
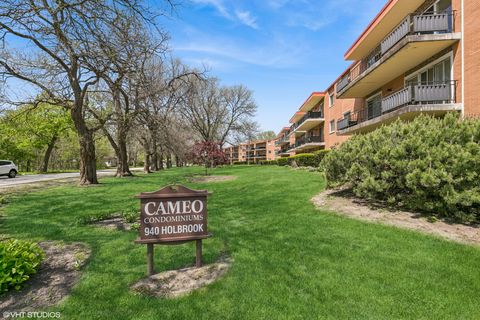
$115,000
2
bds
|
1
ba
|
1,100
sqft
|
built
1972
940 Holbrook Rd, Homewood, IL 60430
$365
Cash flow
16.6%
Cash-on-Cash Return
9.5%
Cap rate
1.6%
Rent to Value Ratio
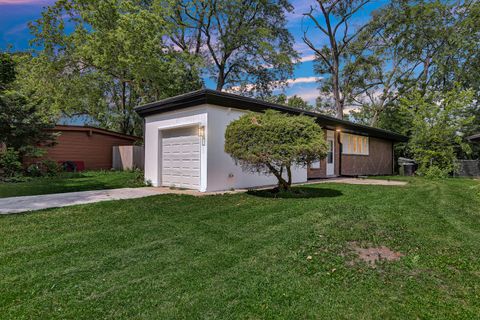
Active
$105,999
2
bds
|
1
ba
|
1,010
sqft
|
built
1970
18340 Cherry Creek Dr, Homewood, IL 60430
$100
Cash flow
4.9%
Cash-on-Cash Return
6.8%
Cap rate
1.7%
Rent to Value Ratio
Active
$298,000
5
bds
|
2
ba
|
1,476
sqft
|
built
1925
1635 Linden Rd, Homewood, IL 60430
$-317
Cash flow
-5.6%
Cash-on-Cash Return
4.4%
Cap rate
0.8%
Rent to Value Ratio
Active
$339,900
3
bds
|
2
ba
|
1,671
sqft
|
built
1927
18241 Gottschalk Ave, Homewood, IL 60430
$-311
Cash flow
-4.8%
Cash-on-Cash Return
4.6%
Cap rate
0.9%
Rent to Value Ratio
Active
$410,000
4
bds
|
2
ba
|
2,230
sqft
|
built
1921
2114 Cedar Rd, Homewood, IL 60430
$-370
Cash flow
-4.7%
Cash-on-Cash Return
4.6%
Cap rate
0.9%
Rent to Value Ratio
Active
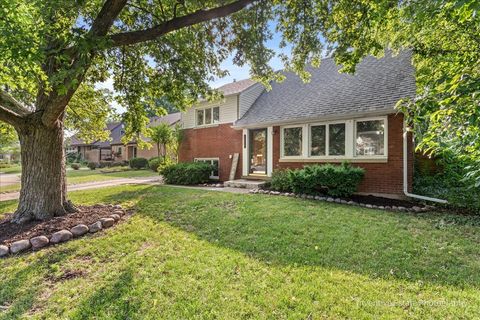
$204,900
3
bds
|
3
ba
|
1,600
sqft
|
built
1953
18548 Lyn Ct, Homewood, IL 60430
$376
Cash flow
9.6%
Cash-on-Cash Return
7.9%
Cap rate
1.4%
Rent to Value Ratio
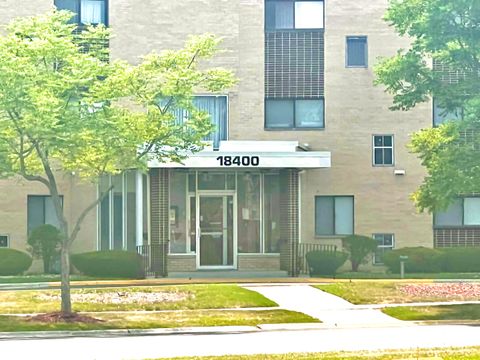
Active
$114,999
2
bds
|
2
ba
|
0
sqft
|
built
1970
18400 Cherry Creek Dr, Homewood, IL 60430
$242
Cash flow
11.0%
Cash-on-Cash Return
8.2%
Cap rate
1.7%
Rent to Value Ratio
Active
$350,000
4
bds
|
2
ba
|
1,100
sqft
|
built
1938
3255 183rd St, Homewood, IL 60430
$10
Cash flow
0.1%
Cash-on-Cash Return
5.7%
Cap rate
0.9%
Rent to Value Ratio
Active
$270,000
3
bds
|
2
ba
|
1,351
sqft
|
built
1951
2059 Downey Rd, Homewood, IL 60430
$-128
Cash flow
-2.5%
Cash-on-Cash Return
5.1%
Cap rate
0.9%
Rent to Value Ratio
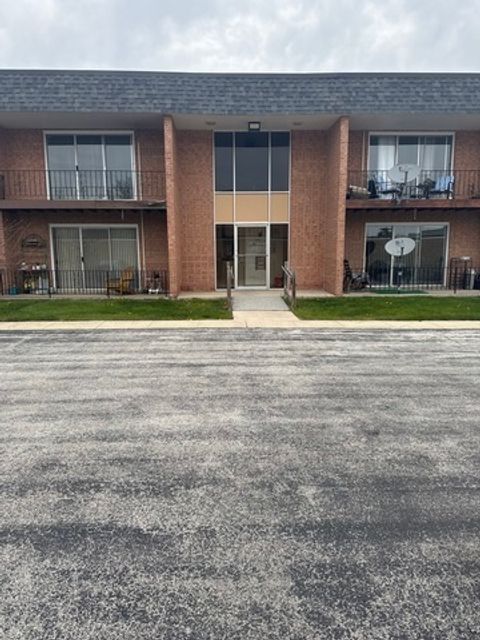
Active
$97,999
1
bds
|
1
ba
|
680
sqft
|
built
1971
940 Holbrook Rd, Homewood, IL 60430
$93
Cash flow
5.0%
Cash-on-Cash Return
6.8%
Cap rate
1.4%
Rent to Value Ratio
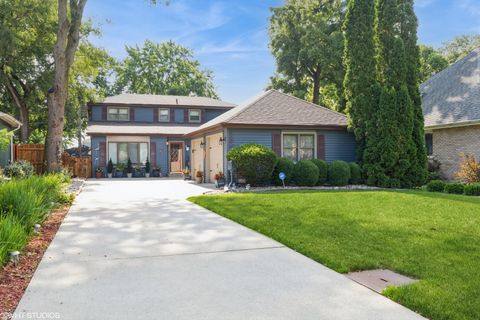
Active
$369,900
4
bds
|
3
ba
|
2,317
sqft
|
built
1979
3240 Knollwood Ln, Homewood, IL 60430
$-519
Cash flow
-7.3%
Cash-on-Cash Return
4.0%
Cap rate
0.8%
Rent to Value Ratio
Active
$155,000
2
bds
|
2
ba
|
900
sqft
|
built
1976
3349 184th St, Homewood, IL 60430
$80
Cash flow
2.7%
Cash-on-Cash Return
6.3%
Cap rate
1.3%
Rent to Value Ratio
Active
$250,000
3
bds
|
2
ba
|
2,074
sqft
|
built
1929
1621 Burr Oak Rd, Homewood, IL 60430
$63
Cash flow
1.3%
Cash-on-Cash Return
6.0%
Cap rate
1.2%
Rent to Value Ratio
Active
$276,000
4
bds
|
2
ba
|
1,950
sqft
|
built
1954
18210 Perth Ave, Homewood, IL 60430
$-295
Cash flow
-5.6%
Cash-on-Cash Return
4.4%
Cap rate
0.9%
Rent to Value Ratio
Active
$132,900
2
bds
|
2
ba
|
900
sqft
|
built
1977
820 Elder Rd, Homewood, IL 60430
$219
Cash flow
8.6%
Cash-on-Cash Return
7.7%
Cap rate
1.7%
Rent to Value Ratio
Active
$257,000
3
bds
|
3
ba
|
1,563
sqft
|
built
1953
2109 Magnolia Rd, Homewood, IL 60430
$172
Cash flow
3.5%
Cash-on-Cash Return
6.5%
Cap rate
1.1%
Rent to Value Ratio
Active
$258,000
3
bds
|
2
ba
|
1,423
sqft
|
built
1960
1431 Willow Rd, Homewood, IL 60430
$-80
Cash flow
-1.6%
Cash-on-Cash Return
5.3%
Cap rate
1.1%
Rent to Value Ratio
Active
$267,000
3
bds
|
3
ba
|
1,262
sqft
|
built
1964
18815 Morgan St, Homewood, IL 60430
$-45
Cash flow
-0.9%
Cash-on-Cash Return
5.5%
Cap rate
1.0%
Rent to Value Ratio
Active
$440,000
4
bds
|
3
ba
|
2,200
sqft
|
built
1972
1413 Jill Ct, Homewood, IL 60430
$-907
Cash flow
-10.8%
Cash-on-Cash Return
3.2%
Cap rate
0.7%
Rent to Value Ratio
Active
$300,000
4
bds
|
3
ba
|
1,791
sqft
|
built
1969
18524 Center Ave, Homewood, IL 60430
$29
Cash flow
0.5%
Cash-on-Cash Return
5.8%
Cap rate
1.0%
Rent to Value Ratio
Active
$188,500
3
bds
|
1
ba
|
900
sqft
|
built
1945
18512 Dixie Hwy, Homewood, IL 60430
$178
Cash flow
4.9%
Cash-on-Cash Return
6.8%
Cap rate
1.2%
Rent to Value Ratio
Active
$167,000
3
bds
|
2
ba
|
1,480
sqft
|
built
1977
3251 184th St, Homewood, IL 60430
$148
Cash flow
4.6%
Cash-on-Cash Return
6.7%
Cap rate
1.5%
Rent to Value Ratio
Active
$262,000
3
bds
|
2
ba
|
1,820
sqft
|
built
1964
1308 191st St, Homewood, IL 60430
$-31
Cash flow
-0.6%
Cash-on-Cash Return
5.5%
Cap rate
1.1%
Rent to Value Ratio
Active
$372,000
4
bds
|
4
ba
|
2,644
sqft
|
built
1965
18842 Morgan St, Homewood, IL 60430
$-162
Cash flow
-2.3%
Cash-on-Cash Return
5.2%
Cap rate
1.0%
Rent to Value Ratio