60438 Investment Properties for Sale
Browse homes for sale and investment properties in 60438. Refine your search by price, property type, or more.
Best cash flowing properties in 60438
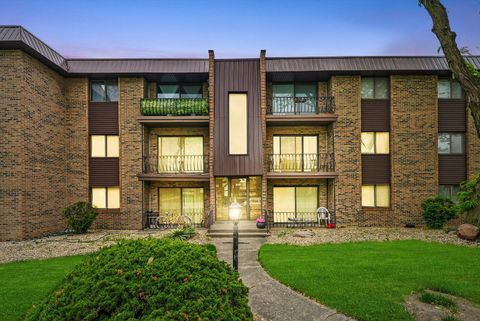
Active
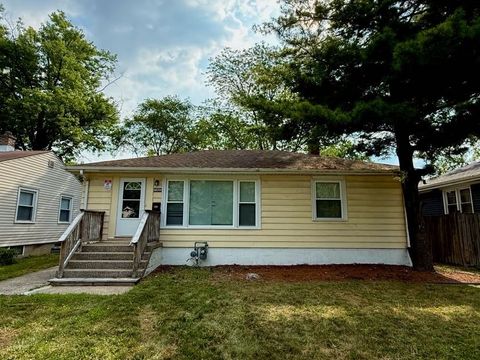
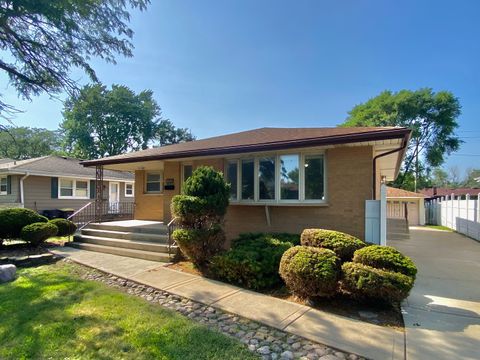
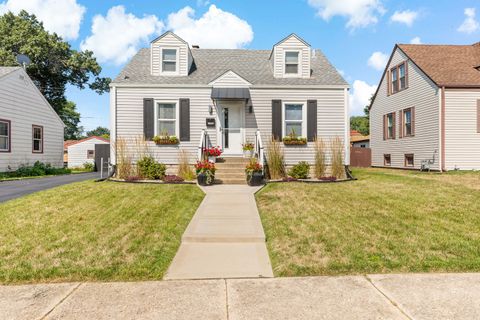
$73,000
2
bds
|
1
ba
|
950
sqft
|
built
1977
3026 Bernice Rd, Lansing, IL 60438
$619
Cash flow
9.9%
Cash-on-Cash Return
10.2%
Cap rate
1.9%
Rent to Value Ratio
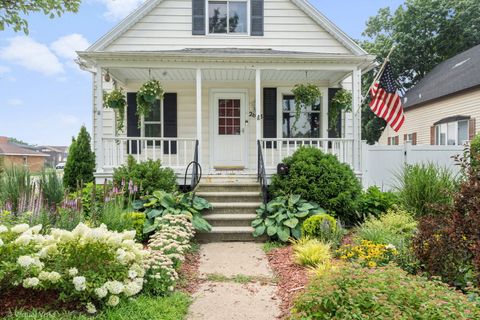
Active
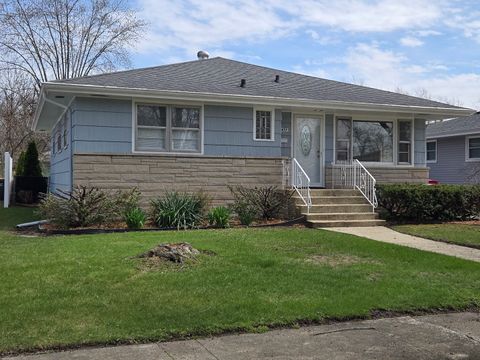
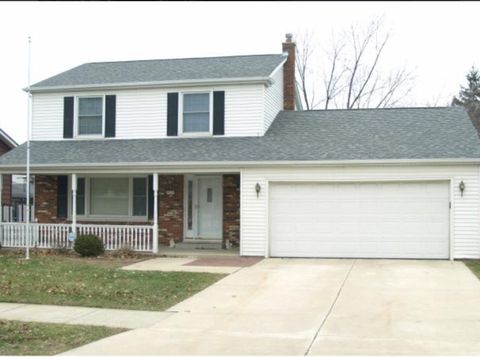
$95,900
2
bds
|
1
ba
|
858
sqft
|
built
1975
2304 Holiday Ter, Lansing, IL 60438
$450
Cash flow
24.5%
Cash-on-Cash Return
11.3%
Cap rate
1.8%
Rent to Value Ratio
74 out of 75 properties for sale in 60438
Limited Results Shown
Create a free account, or log in to reveal all property listings and enjoy the complete experience.
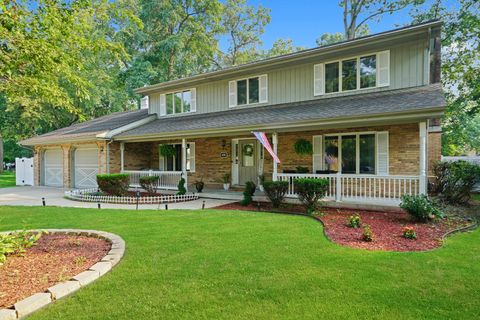
Active
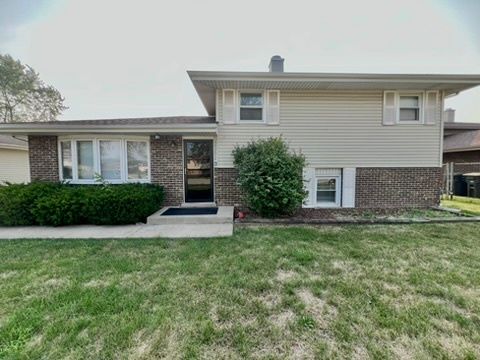
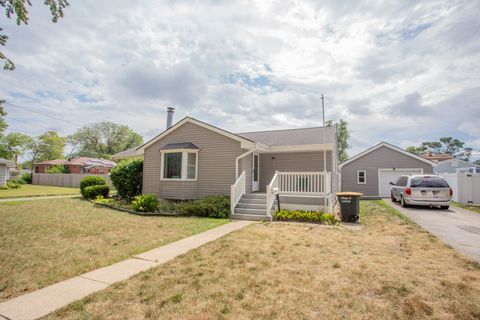
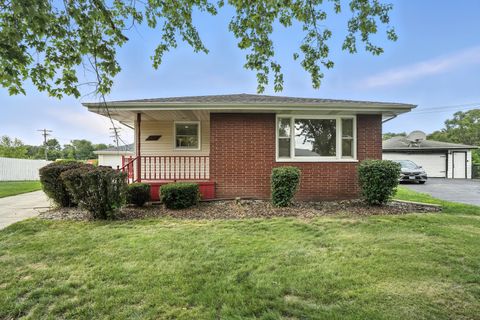
$280,000
3
bds
|
2
ba
|
1,350
sqft
|
built
1961
18429 Arcadia Ave, Lansing, IL 60438
$-439
Cash flow
-8.2%
Cash-on-Cash Return
3.8%
Cap rate
0.8%
Rent to Value Ratio
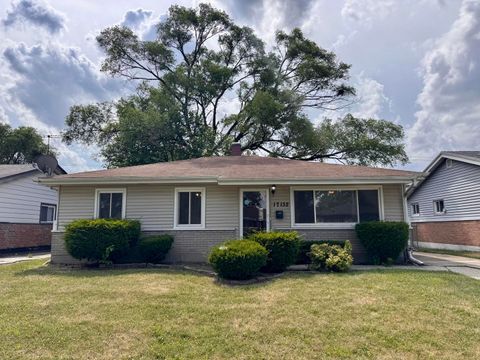
Active
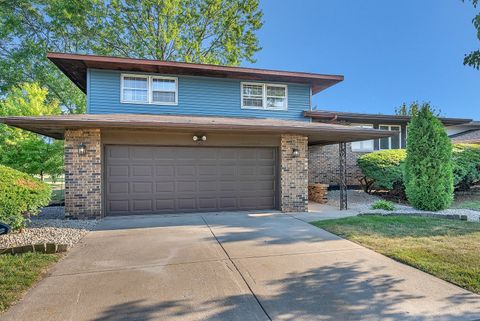
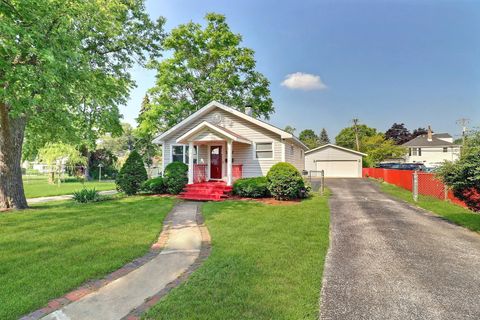
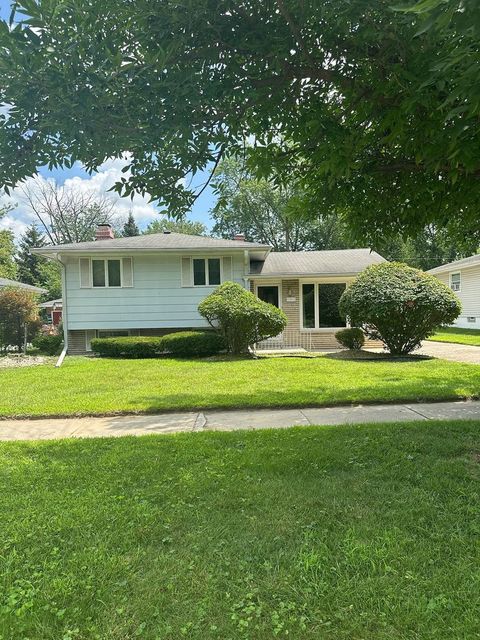
$199,909
3
bds
|
1
ba
|
1,008
sqft
|
built
1951
17557 Burnham Ave, Lansing, IL 60438
$220
Cash flow
5.7%
Cash-on-Cash Return
7.0%
Cap rate
0.9%
Rent to Value Ratio
Active
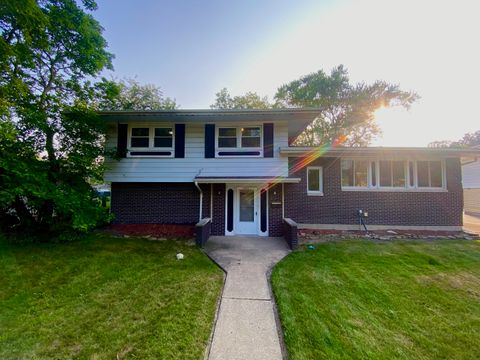
$324,900
3
bds
|
3
ba
|
2,600
sqft
|
built
1922
1890 182nd Pl, Lansing, IL 60438
$-958
Cash flow
-15.4%
Cash-on-Cash Return
2.1%
Cap rate
0.5%
Rent to Value Ratio
Active
$275,000
3
bds
|
3
ba
|
1,537
sqft
|
built
1973
18309 Bock Rd, Lansing, IL 60438
$-710
Cash flow
-13.5%
Cash-on-Cash Return
2.6%
Cap rate
0.8%
Rent to Value Ratio
Active
$374,000
5
bds
|
3
ba
|
2,300
sqft
|
built
1953
17803 Escanaba Ave, Lansing, IL 60438
$-537
Cash flow
-7.5%
Cash-on-Cash Return
4.0%
Cap rate
0.5%
Rent to Value Ratio
Active
$419,500
4
bds
|
3
ba
|
2,479
sqft
|
built
2001
18020 Charlotte Dr, Lansing, IL 60438
$-1,061
Cash flow
-13.2%
Cash-on-Cash Return
2.6%
Cap rate
0.7%
Rent to Value Ratio
Active
$204,000
3
bds
|
2
ba
|
1,600
sqft
|
built
1954
17925 Walter St, Lansing, IL 60438
$69
Cash flow
1.8%
Cash-on-Cash Return
6.1%
Cap rate
1.1%
Rent to Value Ratio
Active
$251,000
3
bds
|
2
ba
|
1,082
sqft
|
built
1976
19202 Sherman St, Lansing, IL 60438
$-348
Cash flow
-7.2%
Cash-on-Cash Return
4.0%
Cap rate
0.9%
Rent to Value Ratio
Active
$325,000
3
bds
|
2
ba
|
2,144
sqft
|
built
1970
2957 192nd Pl, Lansing, IL 60438
$-97
Cash flow
-1.6%
Cash-on-Cash Return
5.3%
Cap rate
0.7%
Rent to Value Ratio
Active
$310,000
4
bds
|
2
ba
|
1,546
sqft
|
built
1967
18964 Wildwood Ave, Lansing, IL 60438
$-734
Cash flow
-12.4%
Cash-on-Cash Return
2.8%
Cap rate
0.7%
Rent to Value Ratio
Active
$251,000
3
bds
|
2
ba
|
1,272
sqft
|
built
1971
3454 E 170th St, Lansing, IL 60438
$-418
Cash flow
-8.7%
Cash-on-Cash Return
3.7%
Cap rate
0.8%
Rent to Value Ratio
Active
$259,000
3
bds
|
3
ba
|
2,028
sqft
|
built
1960
18433 Arcadia Ave, Lansing, IL 60438
$-381
Cash flow
-7.7%
Cash-on-Cash Return
3.9%
Cap rate
0.8%
Rent to Value Ratio
Active
$285,000
3
bds
|
2
ba
|
1,375
sqft
|
built
1953
3541 Washington St, Lansing, IL 60438
$-574
Cash flow
-10.5%
Cash-on-Cash Return
3.3%
Cap rate
0.7%
Rent to Value Ratio
Active
$170,000
2
bds
|
1
ba
|
1,188
sqft
|
built
1925
18226 Chicago Ave, Lansing, IL 60438
$27
Cash flow
0.8%
Cash-on-Cash Return
5.9%
Cap rate
1.1%
Rent to Value Ratio
Active
$280,000
3
bds
|
2
ba
|
1,400
sqft
|
built
1941
18240 Wildwood Ave, Lansing, IL 60438
$-433
Cash flow
-8.1%
Cash-on-Cash Return
3.8%
Cap rate
0.6%
Rent to Value Ratio
Active
$270,000
3
bds
|
2
ba
|
1,664
sqft
|
built
1968
18214 Locust St, Lansing, IL 60438
$-457
Cash flow
-8.8%
Cash-on-Cash Return
3.6%
Cap rate
0.8%
Rent to Value Ratio
Active
$224,900
3
bds
|
2
ba
|
2,100
sqft
|
built
1968
3312 E 170th St, Lansing, IL 60438
$-329
Cash flow
-7.6%
Cash-on-Cash Return
3.9%
Cap rate
0.9%
Rent to Value Ratio
Active
$170,000
3
bds
|
2
ba
|
930
sqft
|
built
1972
17871 Locust St, Lansing, IL 60438
$434
Cash flow
13.3%
Cash-on-Cash Return
8.7%
Cap rate
1.2%
Rent to Value Ratio
Active
$228,000
3
bds
|
2
ba
|
1,580
sqft
|
built
1956
18034 Lorenz Ave, Lansing, IL 60438
$211
Cash flow
4.8%
Cash-on-Cash Return
6.8%
Cap rate
1.0%
Rent to Value Ratio
Active
$324,900
4
bds
|
2
ba
|
2,400
sqft
|
built
1988
19139 Roy St, Lansing, IL 60438
$-28
Cash flow
-0.4%
Cash-on-Cash Return
5.6%
Cap rate
0.8%
Rent to Value Ratio
Active
$258,900
3
bds
|
2
ba
|
1,952
sqft
|
built
1941
3666 176th Pl, Lansing, IL 60438
$-146
Cash flow
-2.9%
Cash-on-Cash Return
5.0%
Cap rate
0.8%
Rent to Value Ratio
Active
$169,900
2
bds
|
1
ba
|
1,040
sqft
|
built
1947
18246 Wildwood Ave, Lansing, IL 60438
$185
Cash flow
5.7%
Cash-on-Cash Return
7.0%
Cap rate
1.2%
Rent to Value Ratio
Active
$115,000
2
bds
|
1
ba
|
900
sqft
|
built
1974
3010 Bernice Rd, Lansing, IL 60438
$213
Cash flow
9.7%
Cash-on-Cash Return
7.9%
Cap rate
1.4%
Rent to Value Ratio
Active
$270,000
3
bds
|
2
ba
|
840
sqft
|
built
1920
2643 Ridge Rd, Lansing, IL 60438
$-110
Cash flow
-2.1%
Cash-on-Cash Return
5.2%
Cap rate
0.8%
Rent to Value Ratio
Active
$449,900
5
bds
|
3
ba
|
3,301
sqft
|
built
1985
18118 Whitman Ln, Lansing, IL 60438
$-1,227
Cash flow
-14.2%
Cash-on-Cash Return
2.4%
Cap rate
0.7%
Rent to Value Ratio
Active
$198,000
3
bds
|
1
ba
|
1,147
sqft
|
built
1958
17132 Walter St, Lansing, IL 60438
$-98
Cash flow
-2.6%
Cash-on-Cash Return
5.1%
Cap rate
0.9%
Rent to Value Ratio
Active
$121,500
2
bds
|
2
ba
|
1,200
sqft
|
built
1969
18855 Burnham Ave, Lansing, IL 60438
$84
Cash flow
3.6%
Cash-on-Cash Return
6.5%
Cap rate
1.5%
Rent to Value Ratio
Active
$298,900
3
bds
|
2
ba
|
1,234
sqft
|
built
1958
17750 Clyde Ave, Lansing, IL 60438
$128
Cash flow
2.2%
Cash-on-Cash Return
6.2%
Cap rate
0.9%
Rent to Value Ratio
Active
$249,500
3
bds
|
3
ba
|
1,910
sqft
|
built
1951
18005 Arcadia Ave, Lansing, IL 60438
$-341
Cash flow
-7.1%
Cash-on-Cash Return
4.0%
Cap rate
0.8%
Rent to Value Ratio
Active
$250,000
3
bds
|
2
ba
|
1,800
sqft
|
built
1947
3445 N Schultz Dr, Lansing, IL 60438
$-224
Cash flow
-4.7%
Cash-on-Cash Return
4.6%
Cap rate
1.0%
Rent to Value Ratio
Active
$259,900
3
bds
|
2
ba
|
1,210
sqft
|
built
1970
17608 Community St, Lansing, IL 60438
$-361
Cash flow
-7.2%
Cash-on-Cash Return
4.0%
Cap rate
0.8%
Rent to Value Ratio
Active
$180,000
3
bds
|
1
ba
|
1,166
sqft
|
built
1953
3636 172nd St, Lansing, IL 60438
$-265
Cash flow
-7.7%
Cash-on-Cash Return
3.9%
Cap rate
0.9%
Rent to Value Ratio
Active
$183,000
3
bds
|
1
ba
|
1,102
sqft
|
built
1956
18747 Sherman St, Lansing, IL 60438
$36
Cash flow
1.0%
Cash-on-Cash Return
5.9%
Cap rate
1.1%
Rent to Value Ratio
Active
$209,000
3
bds
|
3
ba
|
1,200
sqft
|
built
1944
2745 179th St, Lansing, IL 60438
$-44
Cash flow
-1.1%
Cash-on-Cash Return
5.4%
Cap rate
0.9%
Rent to Value Ratio
Active
$399,909
4
bds
|
4
ba
|
2,454
sqft
|
built
1990
1614 185th St, Lansing, IL 60438
$-1,098
Cash flow
-14.3%
Cash-on-Cash Return
2.4%
Cap rate
0.7%
Rent to Value Ratio
Active
$191,000
3
bds
|
2
ba
|
1,560
sqft
|
built
1957
17303 Roy St, Lansing, IL 60438
$-1
Cash flow
0.0%
Cash-on-Cash Return
5.7%
Cap rate
1.0%
Rent to Value Ratio
Active
$350,000
3
bds
|
3
ba
|
1,460
sqft
|
built
1963
2606 Ridge Rd, Lansing, IL 60438
$-878
Cash flow
-13.1%
Cash-on-Cash Return
2.7%
Cap rate
0.7%
Rent to Value Ratio
Active
$319,999
4
bds
|
3
ba
|
2,523
sqft
|
built
1995
18133 Brittany Ln, Lansing, IL 60438
$-178
Cash flow
-2.9%
Cash-on-Cash Return
5.0%
Cap rate
0.8%
Rent to Value Ratio