60443 Investment Properties for Sale
Browse homes for sale and investment properties in 60443. Refine your search by price, property type, or more.
Best cash flowing properties in 60443
Active
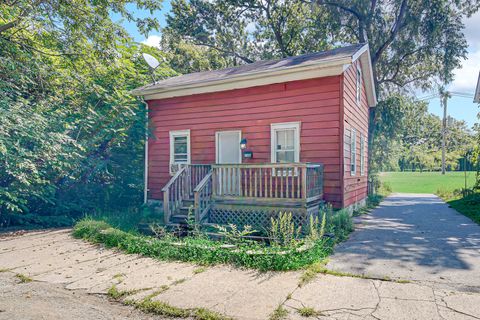
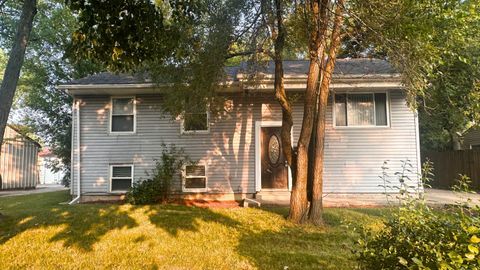
$149,000
3
bds
|
1
ba
|
800
sqft
|
built
1879
21607 Main St, Matteson, IL 60443
$693
Cash flow
24.3%
Cash-on-Cash Return
11.3%
Cap rate
1.7%
Rent to Value Ratio
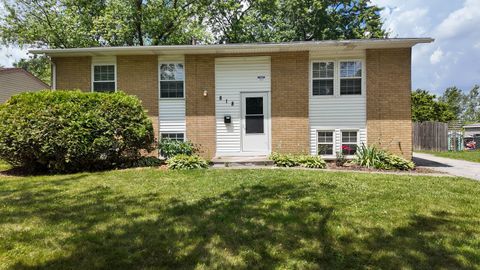
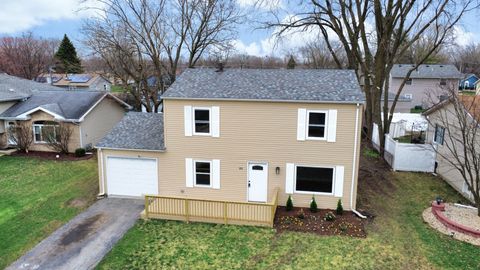
Active
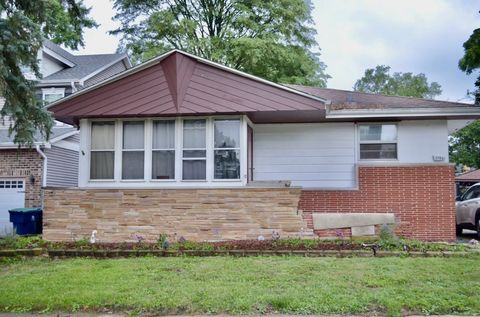
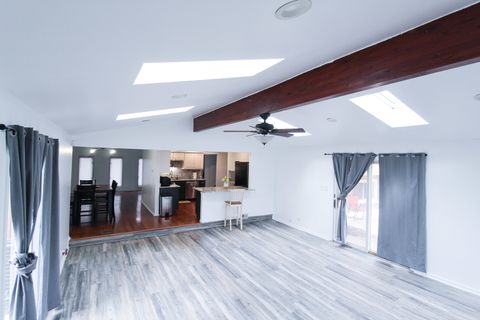
$180,000
3
bds
|
2
ba
|
1,263
sqft
|
built
1963
3762 216th Pl, Matteson, IL 60443
$298
Cash flow
8.6%
Cash-on-Cash Return
7.7%
Cap rate
1.2%
Rent to Value Ratio
41 out of 43 properties for sale in 60443
Limited Results Shown
Create a free account, or log in to reveal all property listings and enjoy the complete experience.
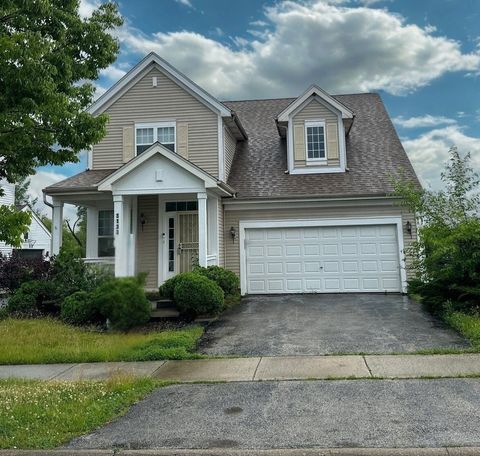
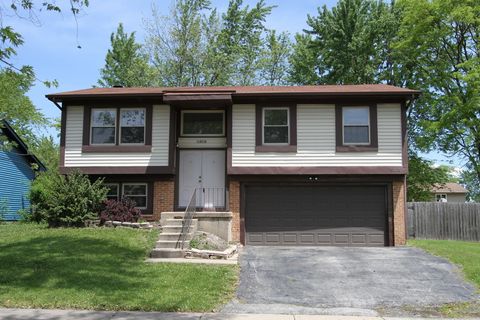
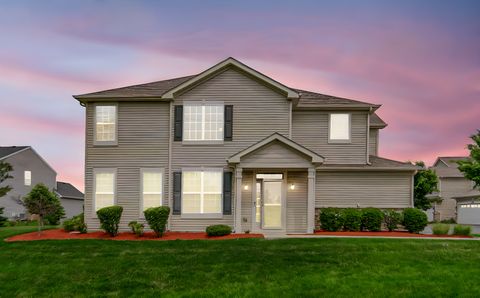
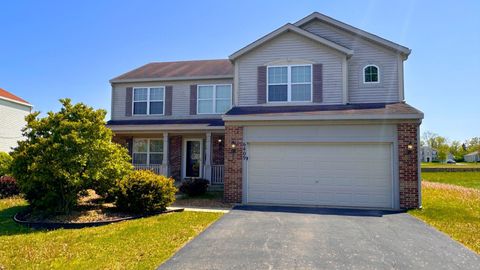
Active
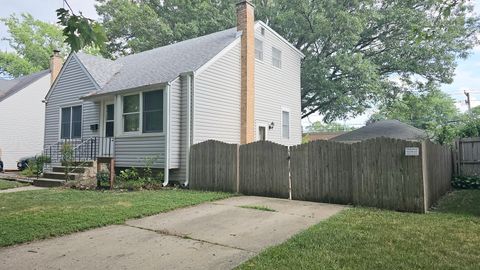
$299,999
4
bds
|
3
ba
|
2,122
sqft
|
built
2001
3133 Heritage Blvd, Matteson, IL 60443
$-375
Cash flow
-6.5%
Cash-on-Cash Return
4.2%
Cap rate
0.9%
Rent to Value Ratio
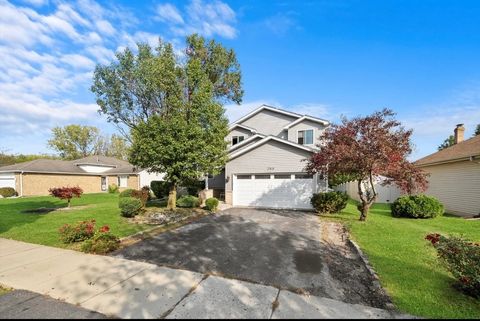
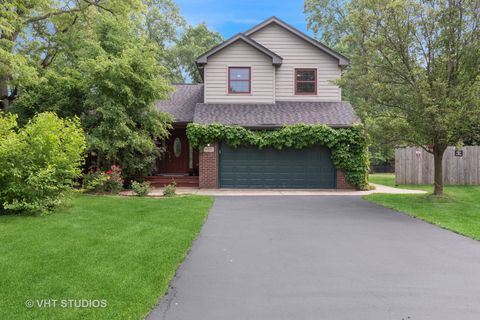
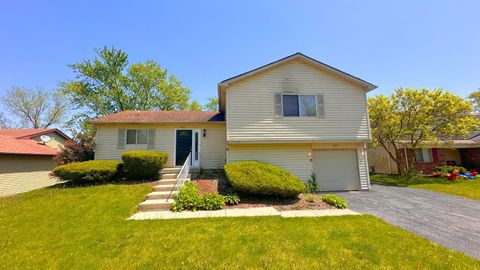
Active
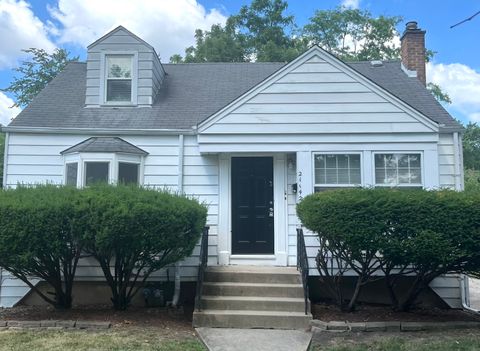
$319,000
3
bds
|
4
ba
|
1,700
sqft
|
built
2005
255 Central Ave, Matteson, IL 60443
$-17
Cash flow
-0.3%
Cash-on-Cash Return
5.6%
Cap rate
1.0%
Rent to Value Ratio
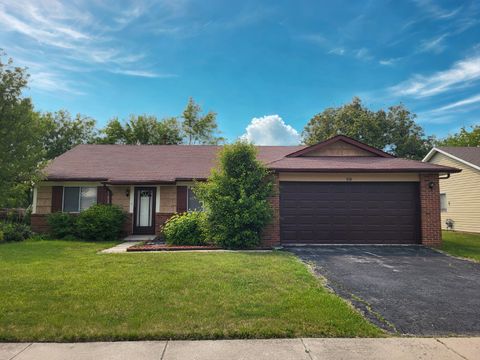
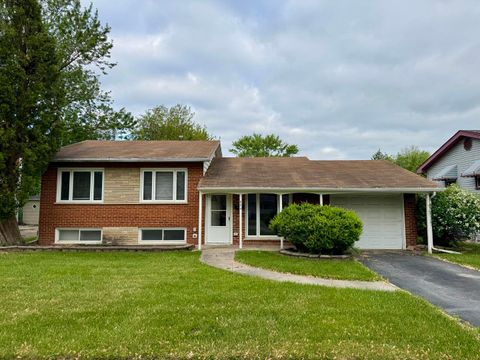
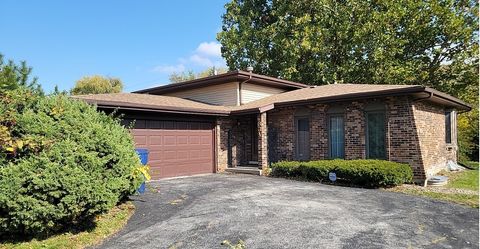
Active
$274,900
4
bds
|
2
ba
|
1,611
sqft
|
built
1981
5838 Woodgate Dr, Matteson, IL 60443
$-163
Cash flow
-3.1%
Cash-on-Cash Return
5.0%
Cap rate
1.0%
Rent to Value Ratio
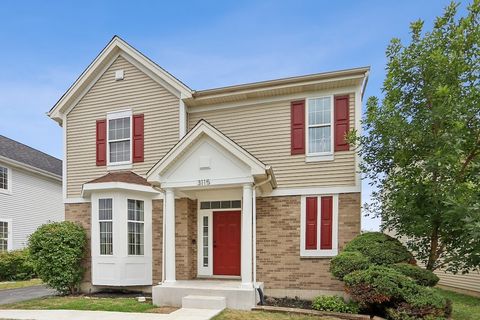
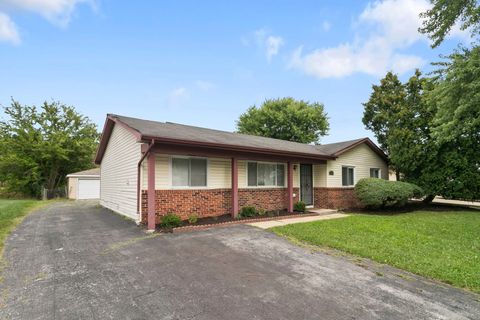
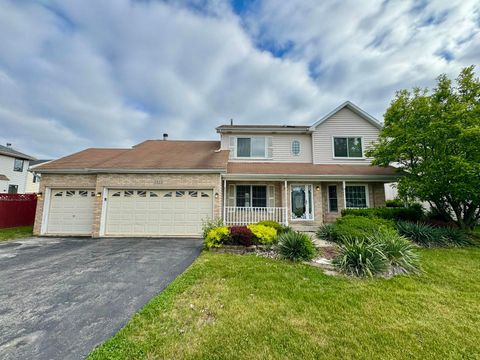
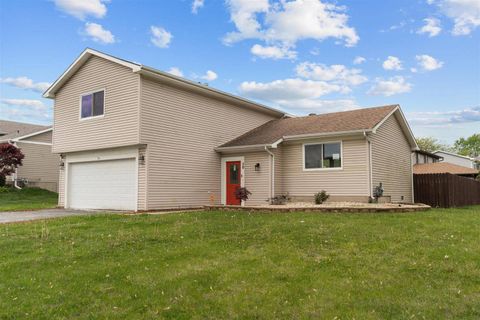
Active
$295,000
3
bds
|
4
ba
|
2,158
sqft
|
built
2001
3115 Holden Cir, Matteson, IL 60443
$-237
Cash flow
-4.2%
Cash-on-Cash Return
4.7%
Cap rate
0.9%
Rent to Value Ratio
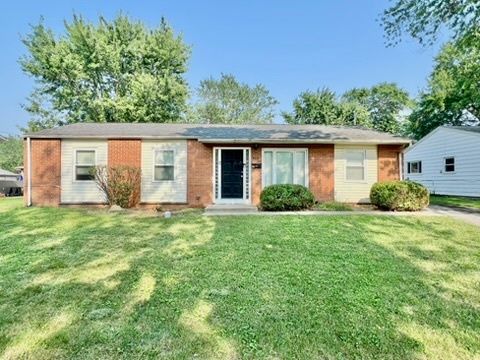
Active
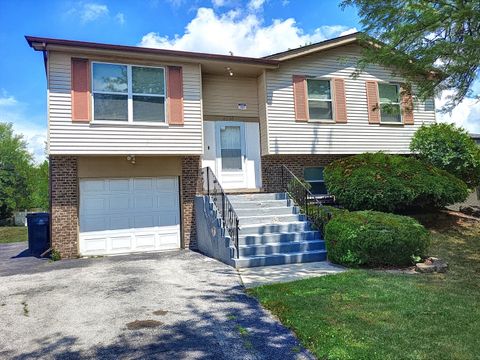
$224,000
3
bds
|
2
ba
|
1,225
sqft
|
built
1962
829 Princeton Ave, Matteson, IL 60443
$43
Cash flow
1.0%
Cash-on-Cash Return
5.9%
Cap rate
1.0%
Rent to Value Ratio
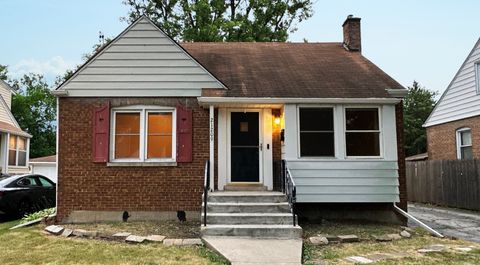
Active
$214,000
3
bds
|
2
ba
|
1,500
sqft
|
built
1953
21209 Oak St, Matteson, IL 60443
$19
Cash flow
0.5%
Cash-on-Cash Return
5.8%
Cap rate
1.0%
Rent to Value Ratio
Active
$270,000
4
bds
|
2
ba
|
1,200
sqft
|
built
1975
6230 Streamwood Ln, Matteson, IL 60443
$-244
Cash flow
-4.7%
Cash-on-Cash Return
4.6%
Cap rate
0.9%
Rent to Value Ratio
Active
$515,000
4
bds
|
3
ba
|
3,200
sqft
|
built
1999
6201 Old Plank Blvd, Matteson, IL 60443
$-1,101
Cash flow
-11.2%
Cash-on-Cash Return
3.1%
Cap rate
0.7%
Rent to Value Ratio
Active
$157,500
2
bds
|
2
ba
|
1,224
sqft
|
built
1972
3704 215th St, Matteson, IL 60443
$-40
Cash flow
-1.3%
Cash-on-Cash Return
5.4%
Cap rate
1.1%
Rent to Value Ratio
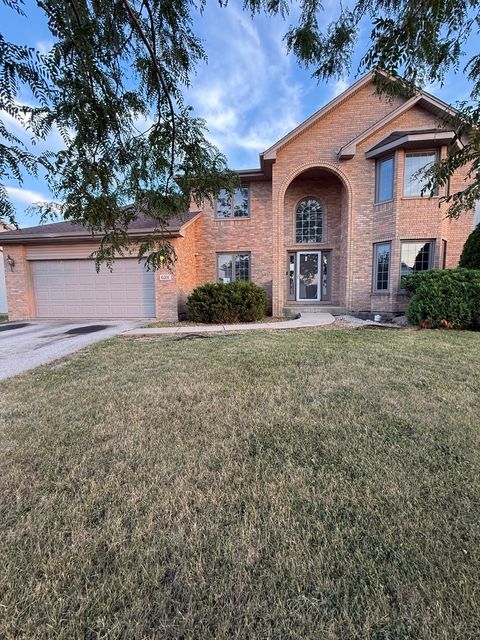
Active
$305,000
3
bds
|
3
ba
|
0
sqft
|
built
2005
921 Fieldside Dr, Matteson, IL 60443
$-910
Cash flow
-15.6%
Cash-on-Cash Return
2.1%
Cap rate
0.7%
Rent to Value Ratio
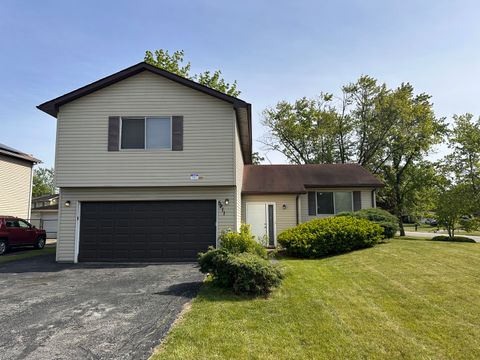
Active
$210,000
3
bds
|
2
ba
|
980
sqft
|
built
1964
948 Dartmouth Ave, Matteson, IL 60443
$35
Cash flow
0.9%
Cash-on-Cash Return
5.9%
Cap rate
1.0%
Rent to Value Ratio
Active
$320,000
3
bds
|
2
ba
|
2,600
sqft
|
built
1977
4329 Applewood Ln, Matteson, IL 60443
$-191
Cash flow
-3.1%
Cash-on-Cash Return
5.0%
Cap rate
0.9%
Rent to Value Ratio
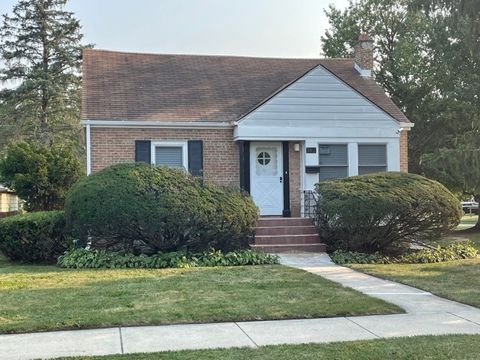
Active
$199,000
4
bds
|
3
ba
|
1,125
sqft
|
built
1952
3533 212th Pl, Matteson, IL 60443
$208
Cash flow
5.5%
Cash-on-Cash Return
6.9%
Cap rate
1.1%
Rent to Value Ratio
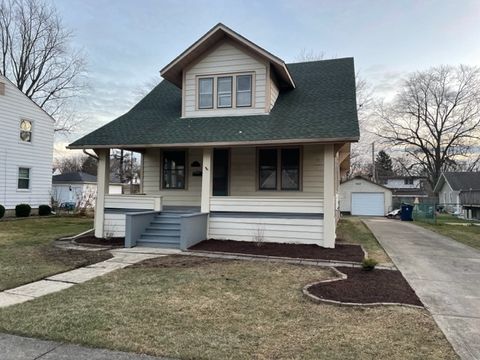
Active
$197,000
3
bds
|
4
ba
|
1,350
sqft
|
built
1950
21142 Locust St, Matteson, IL 60443
$262
Cash flow
6.9%
Cash-on-Cash Return
7.3%
Cap rate
1.3%
Rent to Value Ratio
Active
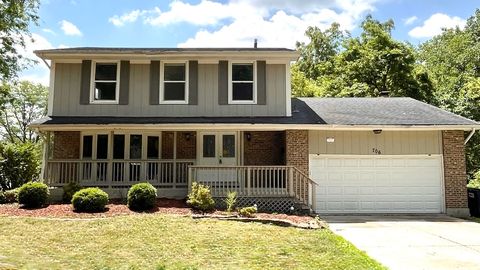
$304,000
3
bds
|
3
ba
|
2,045
sqft
|
built
1980
706 Carnation Ln, Matteson, IL 60443
$-403
Cash flow
-6.9%
Cash-on-Cash Return
4.1%
Cap rate
0.9%
Rent to Value Ratio
Active
$264,990
3
bds
|
3
ba
|
1,900
sqft
|
built
2007
6423 Gray Hawk Dr, Matteson, IL 60443
$-331
Cash flow
-6.5%
Cash-on-Cash Return
4.2%
Cap rate
0.9%
Rent to Value Ratio
Active
$360,000
4
bds
|
4
ba
|
2,100
sqft
|
built
2005
6520 Bridle Path Dr, Matteson, IL 60443
$-484
Cash flow
-7.0%
Cash-on-Cash Return
4.1%
Cap rate
0.9%
Rent to Value Ratio
Active
$460,000
4
bds
|
4
ba
|
3,400
sqft
|
built
1993
4550 Columbine Ln, Matteson, IL 60443
$-1,026
Cash flow
-11.6%
Cash-on-Cash Return
3.0%
Cap rate
0.7%
Rent to Value Ratio
Active
$249,000
3
bds
|
2
ba
|
1,730
sqft
|
built
1977
42 Pheasant Rd, Matteson, IL 60443
$98
Cash flow
2.1%
Cash-on-Cash Return
6.1%
Cap rate
1.1%
Rent to Value Ratio
Active
$515,000
4
bds
|
3
ba
|
2,778
sqft
|
built
2001
21206 Sophia Dr, Matteson, IL 60443
$-517
Cash flow
-5.2%
Cash-on-Cash Return
4.5%
Cap rate
0.9%
Rent to Value Ratio
Active
$250,000
3
bds
|
2
ba
|
1,354
sqft
|
built
1975
6037 Spring Ln, Matteson, IL 60443
$-149
Cash flow
-3.1%
Cash-on-Cash Return
5.0%
Cap rate
1.0%
Rent to Value Ratio
Active
$1,629,808
6
bds
|
2
ba
|
1,725
sqft
|
built
1878
22132 Ridgeland Ave, Matteson, IL 60443
$-6,061
Cash flow
-19.4%
Cash-on-Cash Return
1.2%
Cap rate
0.2%
Rent to Value Ratio
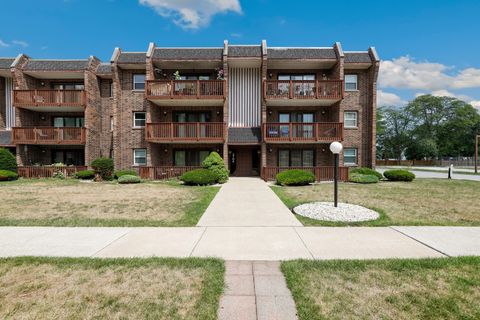
Active
$209,000
2
bds
|
2
ba
|
1,025
sqft
|
built
1962
818 Princeton Ave, Matteson, IL 60443
$122
Cash flow
3.0%
Cash-on-Cash Return
6.4%
Cap rate
1.1%
Rent to Value Ratio
Active
$249,900
3
bds
|
2
ba
|
1,212
sqft
|
built
1972
5808 Allemong Dr, Matteson, IL 60443
$-80
Cash flow
-1.7%
Cash-on-Cash Return
5.3%
Cap rate
1.0%
Rent to Value Ratio
Active
$495,000
3
bds
|
4
ba
|
1,739
sqft
|
built
2005
4335 Dewey Ave, Matteson, IL 60443
$-1,239
Cash flow
-13.1%
Cash-on-Cash Return
2.7%
Cap rate
0.5%
Rent to Value Ratio
Active
$233,000
3
bds
|
2
ba
|
1,356
sqft
|
built
1976
50 Oakhurst Rd, Matteson, IL 60443
$172
Cash flow
3.9%
Cash-on-Cash Return
6.6%
Cap rate
1.1%
Rent to Value Ratio
Active
$299,500
2
bds
|
3
ba
|
1,690
sqft
|
built
2016
192 Owen St, Matteson, IL 60443
$-365
Cash flow
-6.4%
Cash-on-Cash Return
4.2%
Cap rate
0.9%
Rent to Value Ratio
Active
$269,000
4
bds
|
3
ba
|
1,776
sqft
|
built
1977
5911 Timberlane Rd, Matteson, IL 60443
$5
Cash flow
0.1%
Cash-on-Cash Return
5.7%
Cap rate
1.0%
Rent to Value Ratio
Active
$318,000
3
bds
|
3
ba
|
1,972
sqft
|
built
1994
5522 Mallard Dr, Matteson, IL 60443
$-506
Cash flow
-8.3%
Cash-on-Cash Return
3.8%
Cap rate
0.9%
Rent to Value Ratio
Active
$211,000
3
bds
|
3
ba
|
1,044
sqft
|
built
1961
824 Dartmouth Ave, Matteson, IL 60443
$150
Cash flow
3.7%
Cash-on-Cash Return
6.5%
Cap rate
1.1%
Rent to Value Ratio
Active
$356,000
4
bds
|
3
ba
|
2,287
sqft
|
built
2006
6409 Old Plank Blvd, Matteson, IL 60443
$-617
Cash flow
-9.0%
Cash-on-Cash Return
3.6%
Cap rate
0.9%
Rent to Value Ratio
Active
$230,000
3
bds
|
2
ba
|
1,730
sqft
|
built
1977
123 Oriole Rd, Matteson, IL 60443
$119
Cash flow
2.7%
Cash-on-Cash Return
6.3%
Cap rate
1.2%
Rent to Value Ratio
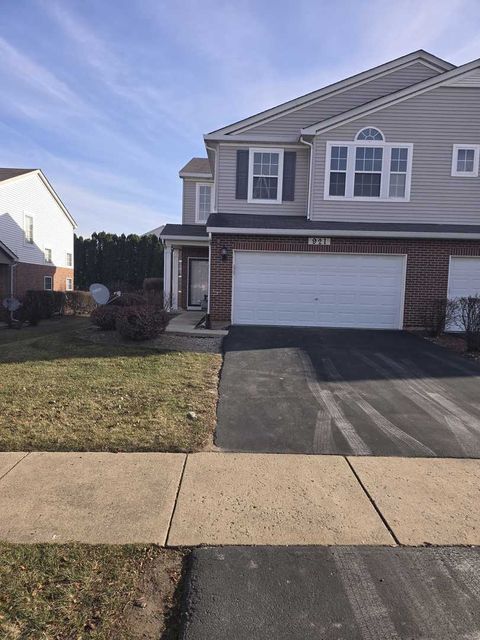
Active
$329,900
3
bds
|
2
ba
|
1,180
sqft
|
built
1976
831 Violet Ln, Matteson, IL 60443
$-571
Cash flow
-9.0%
Cash-on-Cash Return
3.6%
Cap rate
0.7%
Rent to Value Ratio
Active
$279,900
4
bds
|
3
ba
|
1,868
sqft
|
built
1980
50 Wedgewood Rd, Matteson, IL 60443
$88
Cash flow
1.6%
Cash-on-Cash Return
6.1%
Cap rate
1.1%
Rent to Value Ratio
Active
$252,500
4
bds
|
2
ba
|
1,700
sqft
|
built
1962
919 Dartmouth Ave, Matteson, IL 60443
$81
Cash flow
1.7%
Cash-on-Cash Return
6.1%
Cap rate
1.0%
Rent to Value Ratio
Active
$219,500
4
bds
|
2
ba
|
1,285
sqft
|
built
1923
3817 216th Pl, Matteson, IL 60443
$169
Cash flow
4.0%
Cash-on-Cash Return
6.6%
Cap rate
1.0%
Rent to Value Ratio
Active
$249,000
4
bds
|
2
ba
|
950
sqft
|
built
1955
20520 Crawford Ave, Matteson, IL 60443
$-128
Cash flow
-2.7%
Cash-on-Cash Return
5.1%
Cap rate
0.8%
Rent to Value Ratio
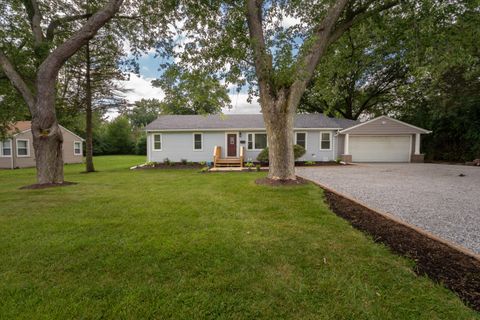
Active
$225,000
3
bds
|
2
ba
|
1,222
sqft
|
built
1949
3865 216th St, Matteson, IL 60443
$234
Cash flow
5.4%
Cash-on-Cash Return
6.9%
Cap rate
1.0%
Rent to Value Ratio