60477 Investment Properties for Sale
Browse homes for sale and investment properties in 60477. Refine your search by price, property type, or more.
Best cash flowing properties in 60477
Active
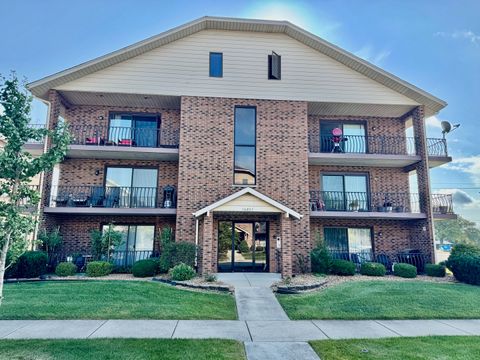
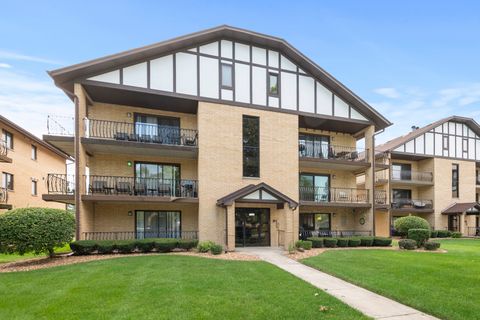
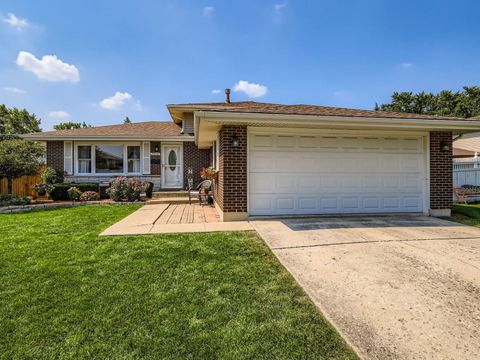
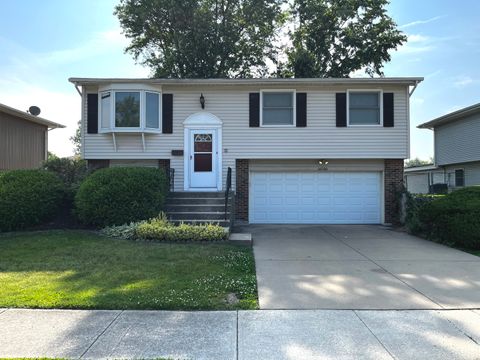
$189,900
2
bds
|
1
ba
|
925
sqft
|
built
1986
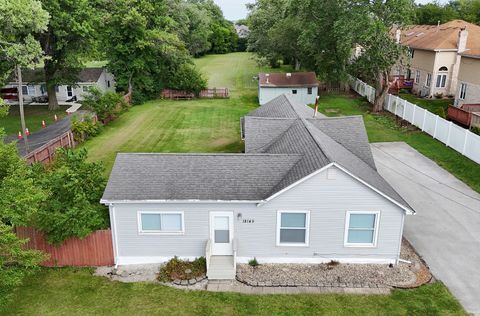
16837 81st Ave, Tinley Park, IL 60477
$113
Cash flow
3.1%
Cash-on-Cash Return
6.4%
Cap rate
1.2%
Rent to Value Ratio
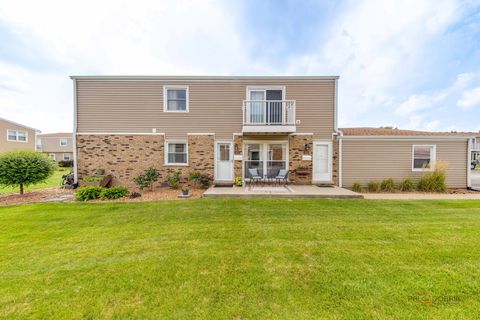
Active
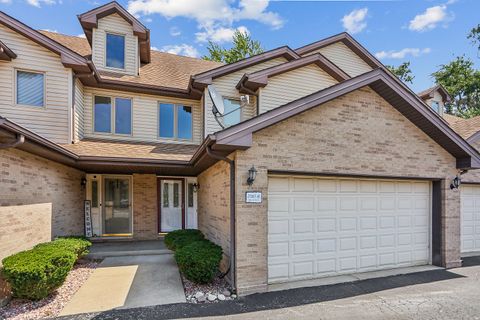
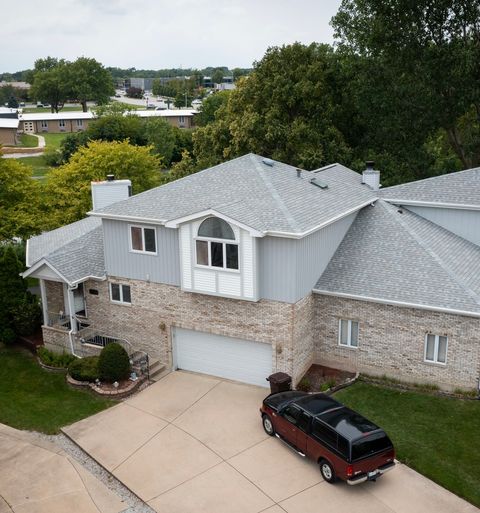
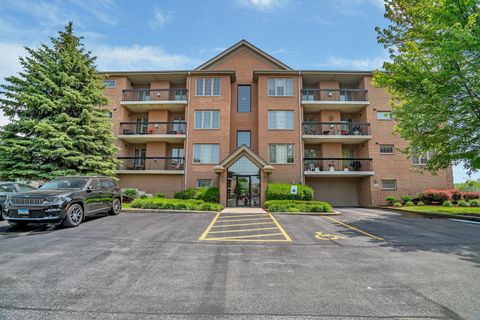
$270,000
2
bds
|
3
ba
|
1,684
sqft
|
built
2001
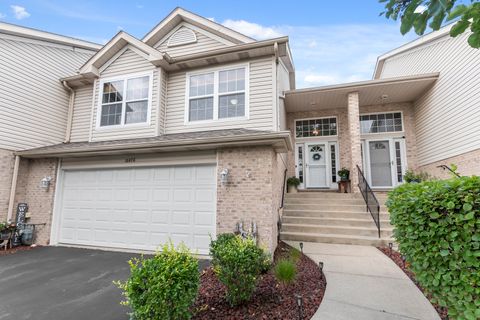
7025 167th St, Tinley Park, IL 60477
$77
Cash flow
1.5%
Cash-on-Cash Return
6.0%
Cap rate
1.0%
Rent to Value Ratio
39 out of 47 properties for sale in 60477
Limited Results Shown
Create a free account, or log in to reveal all property listings and enjoy the complete experience.
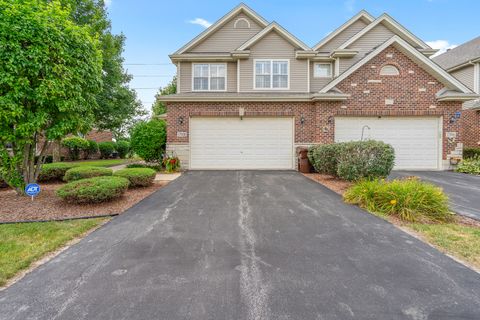
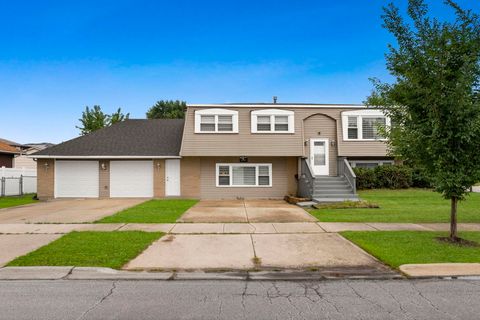
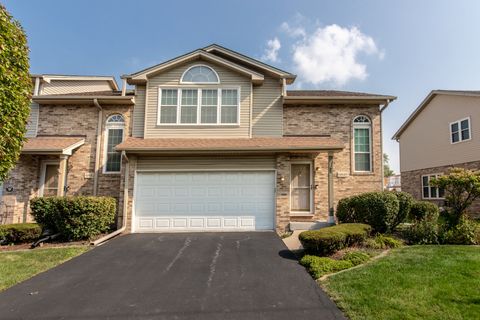
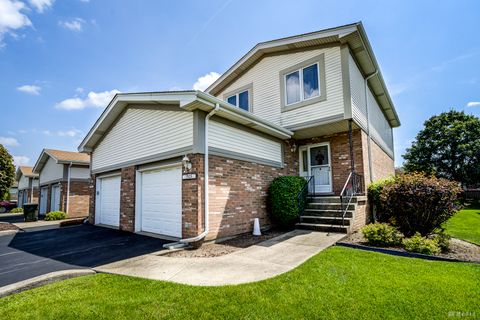
Active
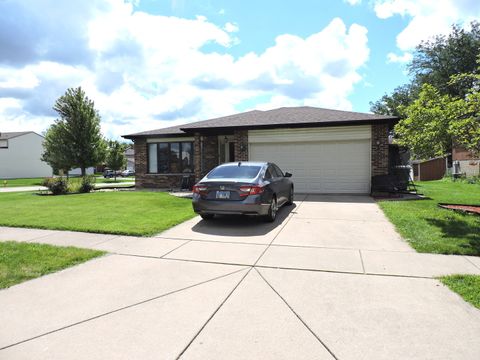
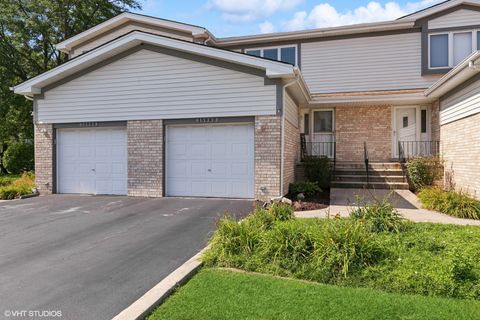
$389,900
3
bds
|
2
ba
|
1,600
sqft
|
built
1989
6931 Coachwood Trl, Tinley Park, IL 60477
$-848
Cash flow
-11.3%
Cash-on-Cash Return
3.1%
Cap rate
0.7%
Rent to Value Ratio
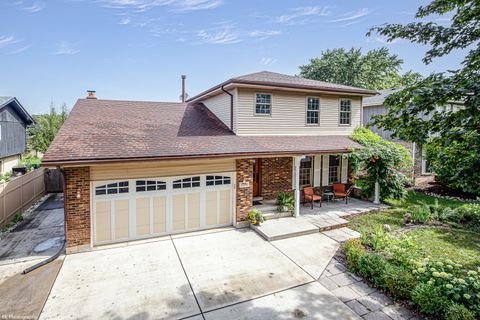
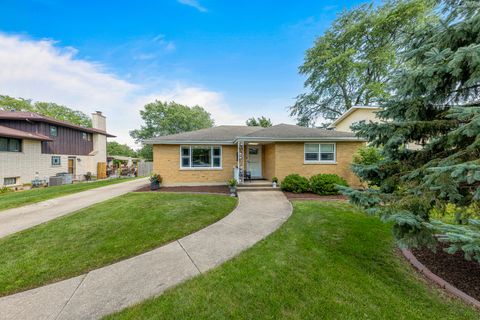
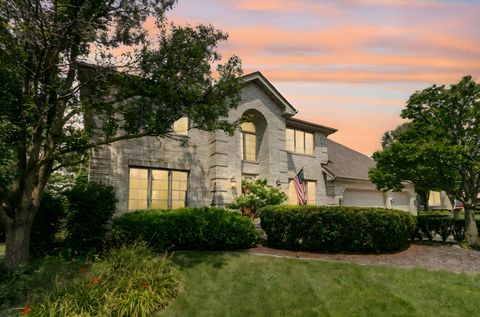
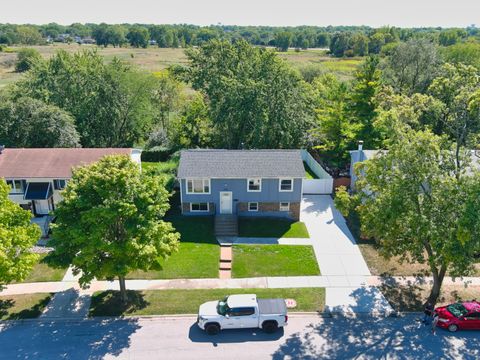
Active
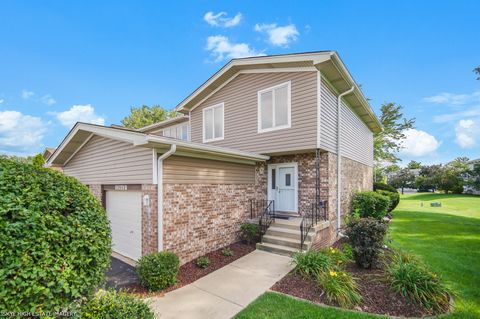
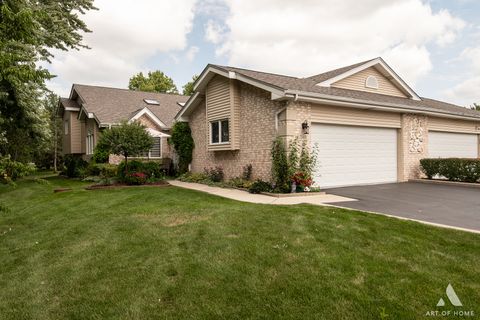
$279,900
3
bds
|
3
ba
|
2,200
sqft
|
built
1989
15962 78th Ave, Tinley Park, IL 60477
$-88
Cash flow
-1.6%
Cash-on-Cash Return
5.3%
Cap rate
1.0%
Rent to Value Ratio
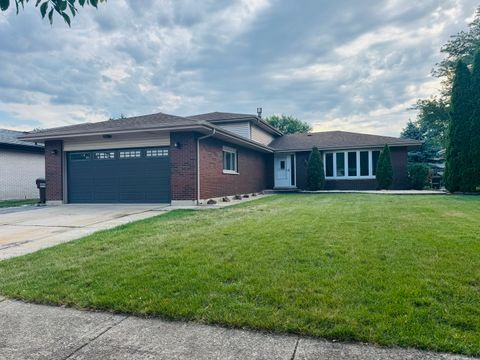
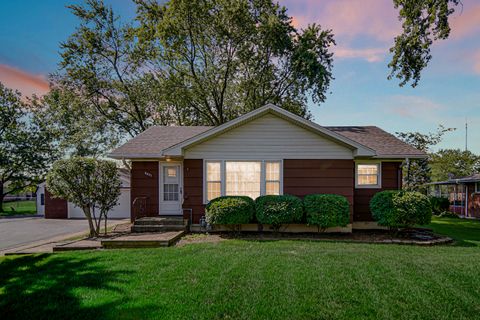
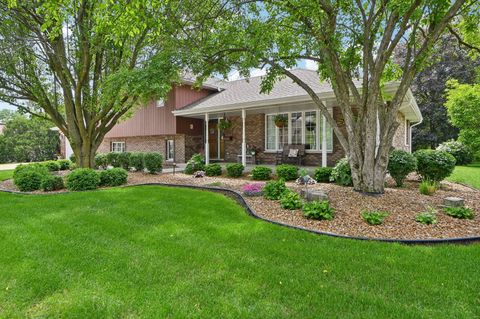
Active
$280,000
2
bds
|
2
ba
|
1,400
sqft
|
built
1992
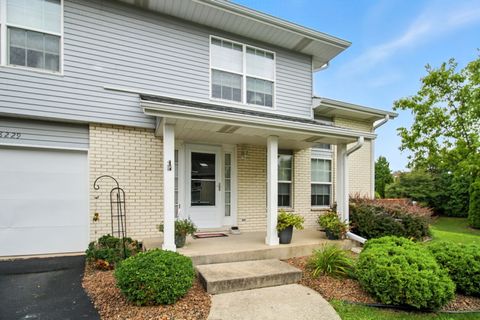
8229 170th St, Tinley Park, IL 60477
$-324
Cash flow
-6.0%
Cash-on-Cash Return
4.3%
Cap rate
0.8%
Rent to Value Ratio
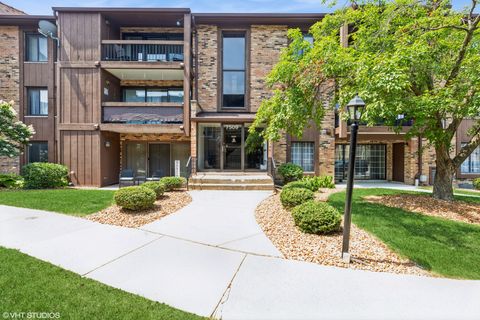
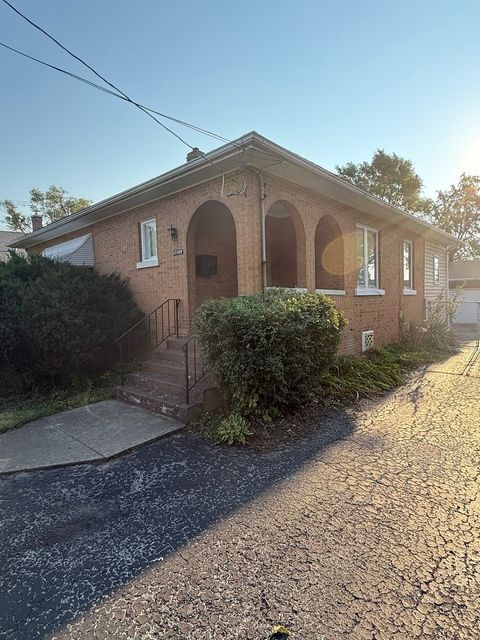
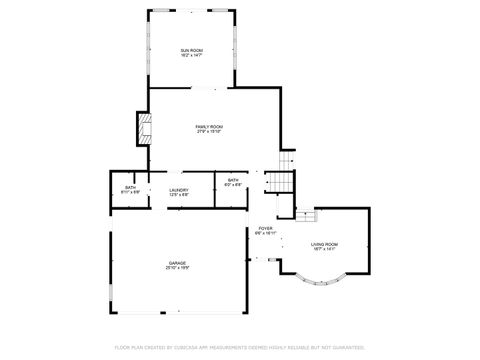
Active
$499,000
3
bds
|
2
ba
|
1,488
sqft
|
built
1936
18145 Harlem Ave, Tinley Park, IL 60477
$-886
Cash flow
-9.3%
Cash-on-Cash Return
3.5%
Cap rate
0.6%
Rent to Value Ratio
Active
$340,000
3
bds
|
2
ba
|
1,308
sqft
|
built
1986
6402 Jeanette Ct, Tinley Park, IL 60477
$-245
Cash flow
-3.8%
Cash-on-Cash Return
4.8%
Cap rate
0.8%
Rent to Value Ratio
Active
$309,000
3
bds
|
2
ba
|
2,100
sqft
|
built
2003
18478 Bellagio Cir, Tinley Park, IL 60477
$-534
Cash flow
-9.0%
Cash-on-Cash Return
3.6%
Cap rate
1.0%
Rent to Value Ratio
Active
$229,900
2
bds
|
2
ba
|
1,100
sqft
|
built
1990
17960 Royal Oak Ct, Tinley Park, IL 60477
$-251
Cash flow
-5.7%
Cash-on-Cash Return
4.4%
Cap rate
0.9%
Rent to Value Ratio
Active
$349,000
3
bds
|
4
ba
|
2,462
sqft
|
built
1993
6954 Kingston Ct, Tinley Park, IL 60477
$-618
Cash flow
-9.2%
Cash-on-Cash Return
3.6%
Cap rate
0.9%
Rent to Value Ratio
Active
$260,000
2
bds
|
3
ba
|
1,450
sqft
|
built
1994
15960 Ashford Ct, Tinley Park, IL 60477
$-257
Cash flow
-5.2%
Cash-on-Cash Return
4.5%
Cap rate
1.0%
Rent to Value Ratio
Active
$344,900
3
bds
|
3
ba
|
1,394
sqft
|
built
1993
7348 163rd St, Tinley Park, IL 60477
$-372
Cash flow
-5.6%
Cash-on-Cash Return
4.4%
Cap rate
0.8%
Rent to Value Ratio
Active
$384,900
3
bds
|
3
ba
|
2,040
sqft
|
built
2009
17908 Iroquois Trce, Tinley Park, IL 60477
$-674
Cash flow
-9.1%
Cash-on-Cash Return
3.6%
Cap rate
0.8%
Rent to Value Ratio
Active
$474,900
3
bds
|
3
ba
|
1,772
sqft
|
built
1978
7218 Sandy Ln, Tinley Park, IL 60477
$-818
Cash flow
-9.0%
Cash-on-Cash Return
3.6%
Cap rate
0.7%
Rent to Value Ratio
Active
$335,000
3
bds
|
2
ba
|
1,350
sqft
|
built
1975
17748 64th Ct, Tinley Park, IL 60477
$-181
Cash flow
-2.8%
Cash-on-Cash Return
5.0%
Cap rate
0.9%
Rent to Value Ratio
Active
$199,999
2
bds
|
2
ba
|
1,000
sqft
|
built
1981
7509 175th St, Tinley Park, IL 60477
$-302
Cash flow
-7.9%
Cash-on-Cash Return
3.9%
Cap rate
0.9%
Rent to Value Ratio
Active
$369,000
3
bds
|
2
ba
|
18,396
sqft
|
built
1974
16447 76th Ave, Tinley Park, IL 60477
$-366
Cash flow
-5.2%
Cash-on-Cash Return
4.5%
Cap rate
0.8%
Rent to Value Ratio
Active
$349,900
3
bds
|
2
ba
|
1,264
sqft
|
built
1957
17209 70th Ave, Tinley Park, IL 60477
$-454
Cash flow
-6.8%
Cash-on-Cash Return
4.1%
Cap rate
0.7%
Rent to Value Ratio
Active
$284,900
3
bds
|
2
ba
|
1,500
sqft
|
built
1955
6621 183rd St, Tinley Park, IL 60477
$-130
Cash flow
-2.4%
Cash-on-Cash Return
5.1%
Cap rate
1.0%
Rent to Value Ratio
Active
$225,000
1
bds
|
1
ba
|
990
sqft
|
built
1928
17109 67th Ct, Tinley Park, IL 60477
$-102
Cash flow
-2.4%
Cash-on-Cash Return
5.1%
Cap rate
1.0%
Rent to Value Ratio
Active
$384,900
3
bds
|
2
ba
|
1,095
sqft
|
built
1972
7513 Dorothy Ln, Tinley Park, IL 60477
$-437
Cash flow
-5.9%
Cash-on-Cash Return
4.3%
Cap rate
0.7%
Rent to Value Ratio
Active
$220,000
2
bds
|
1
ba
|
1,000
sqft
|
built
1969
7957 163rd Pl, Tinley Park, IL 60477
$-324
Cash flow
-7.7%
Cash-on-Cash Return
3.9%
Cap rate
0.8%
Rent to Value Ratio
Active
$325,000
2
bds
|
4
ba
|
1,800
sqft
|
built
1996
6840 179th St, Tinley Park, IL 60477
$-374
Cash flow
-6.0%
Cash-on-Cash Return
4.3%
Cap rate
0.9%
Rent to Value Ratio
Active
$549,500
4
bds
|
3
ba
|
3,533
sqft
|
built
2000
17116 Dooneen Ave, Tinley Park, IL 60477
$-874
Cash flow
-8.3%
Cash-on-Cash Return
3.8%
Cap rate
0.7%
Rent to Value Ratio
Active
$289,000
3
bds
|
3
ba
|
1,557
sqft
|
built
1995
7925 160th St, Tinley Park, IL 60477
$-130
Cash flow
-2.3%
Cash-on-Cash Return
5.1%
Cap rate
1.0%
Rent to Value Ratio
Active
$399,000
5
bds
|
2
ba
|
1,934
sqft
|
built
1971
7505 165th St, Tinley Park, IL 60477
$-75
Cash flow
-1.0%
Cash-on-Cash Return
5.5%
Cap rate
0.9%
Rent to Value Ratio
Active
$449,000
3
bds
|
3
ba
|
2,185
sqft
|
built
1995
6815 169th St, Tinley Park, IL 60477
$-862
Cash flow
-10.0%
Cash-on-Cash Return
3.4%
Cap rate
0.6%
Rent to Value Ratio
Active
$545,000
3
bds
|
4
ba
|
3,179
sqft
|
built
1989
16212 Hamilton Ave, Tinley Park, IL 60477
$-905
Cash flow
-8.7%
Cash-on-Cash Return
3.7%
Cap rate
0.6%
Rent to Value Ratio
Active
$228,500
2
bds
|
2
ba
|
1,100
sqft
|
built
1987
8300 160th Pl, Tinley Park, IL 60477
$-21
Cash flow
-0.5%
Cash-on-Cash Return
5.6%
Cap rate
1.0%
Rent to Value Ratio
Active
$254,900
2
bds
|
2
ba
|
1,480
sqft
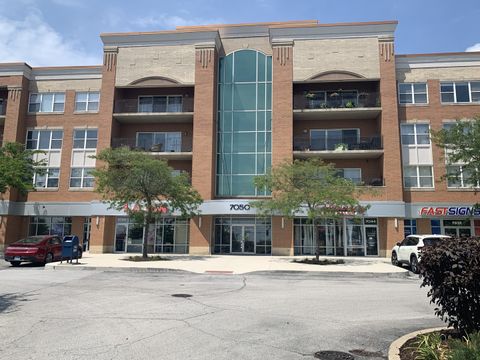
|
built
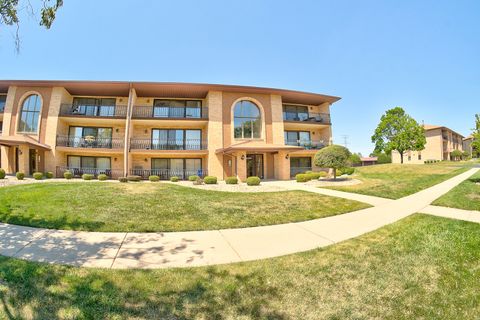
2005
7050 183rd St, Tinley Park, IL 60477
$-492
Cash flow
-10.1%
Cash-on-Cash Return
3.4%
Cap rate
0.9%
Rent to Value Ratio
Active
$268,500
2
bds
|
3
ba
|
1,456
sqft
|
built
1988
15957 78th Ave, Tinley Park, IL 60477
$-210
Cash flow
-4.1%
Cash-on-Cash Return
4.7%
Cap rate
1.0%
Rent to Value Ratio
Active
$334,900
2
bds
|
2
ba
|
1,855
sqft
|
built
1998
56 Iliad Dr, Tinley Park, IL 60477
$-818
Cash flow
-12.7%
Cash-on-Cash Return
2.7%
Cap rate
0.9%
Rent to Value Ratio

Active
$325,000
3
bds
|
2
ba
|
1,652
sqft
|
built
1971
16531 76th Ave, Tinley Park, IL 60477
$-116
Cash flow
-1.9%
Cash-on-Cash Return
5.3%
Cap rate
0.9%
Rent to Value Ratio
Active
$337,000
3
bds
|
2
ba
|
1,400
sqft
|
built
1973
16500 76th Ave, Tinley Park, IL 60477
$-323
Cash flow
-5.0%
Cash-on-Cash Return
4.5%
Cap rate
0.8%
Rent to Value Ratio
Active
$355,500
2
bds
|
4
ba
|
1,801
sqft
|
built
1996
18324 Pond View Ct, Tinley Park, IL 60477
$-367
Cash flow
-5.4%
Cash-on-Cash Return
4.4%
Cap rate
0.9%
Rent to Value Ratio
Active
$262,000
2
bds
|
2
ba
|
1,650
sqft
|
built
2003
6743 S Pointe Dr, Tinley Park, IL 60477
$-422
Cash flow
-8.4%
Cash-on-Cash Return
3.7%
Cap rate
1.0%
Rent to Value Ratio
Active
$220,000
3
bds
|
2
ba
|
0
sqft
|
built
1984
18040 Royal Oak Ct, Tinley Park, IL 60477
$-226
Cash flow
-5.4%
Cash-on-Cash Return
4.4%
Cap rate
1.0%
Rent to Value Ratio
Active
$309,900
2
bds
|
3
ba
|
1,960
sqft
|
built
1998
18225 Eagle Dr, Tinley Park, IL 60477
$-472
Cash flow
-7.9%
Cash-on-Cash Return
3.9%
Cap rate
0.9%
Rent to Value Ratio
Active
$434,900
4
bds
|
3
ba
|
2,500
sqft
|
built
1993
7942 161st St, Tinley Park, IL 60477
$-560
Cash flow
-6.7%
Cash-on-Cash Return
4.1%
Cap rate
0.7%
Rent to Value Ratio