60615 Investment Properties for Sale
Browse homes for sale and investment properties in 60615. Refine your search by price, property type, or more.
Best cash flowing properties in 60615
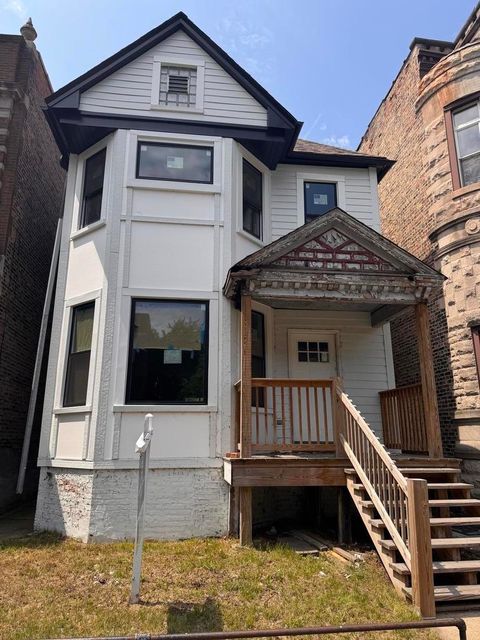
Active
$132,800
1
bds
|
1
ba
|
900
sqft
|
built
1908
5107 S Ingleside Ave, Chicago, IL 60615
$189
Cash flow
7.4%
Cash-on-Cash Return
7.4%
Cap rate
1.5%
Rent to Value Ratio
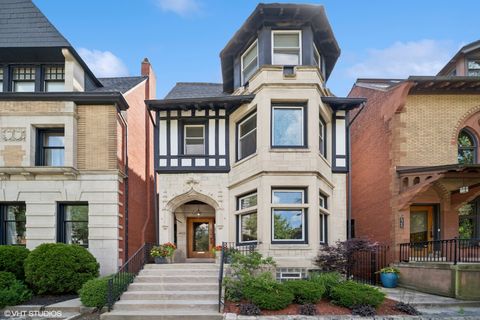
Active
$265,000
4
bds
|
3
ba
|
1,814
sqft
|
built
1898
4846 S Evans Ave, Chicago, IL 60615
$83
Cash flow
1.6%
Cash-on-Cash Return
6.1%
Cap rate
0.9%
Rent to Value Ratio
28 out of 41 properties for sale in 60615
Limited Results Shown
Create a free account, or log in to reveal all property listings and enjoy the complete experience.
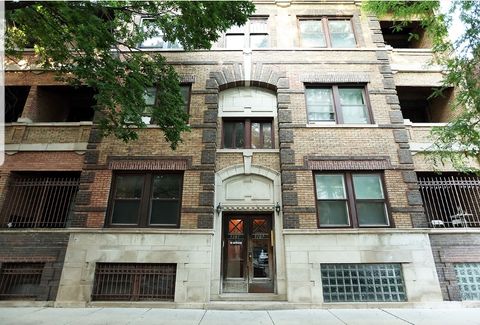
Active
$250,000
3
bds
|
2
ba
|
1,580
sqft
|
built
1916
5202 S Ingleside Ave, Chicago, IL 60615
$-195
Cash flow
-4.1%
Cash-on-Cash Return
4.7%
Cap rate
1.0%
Rent to Value Ratio
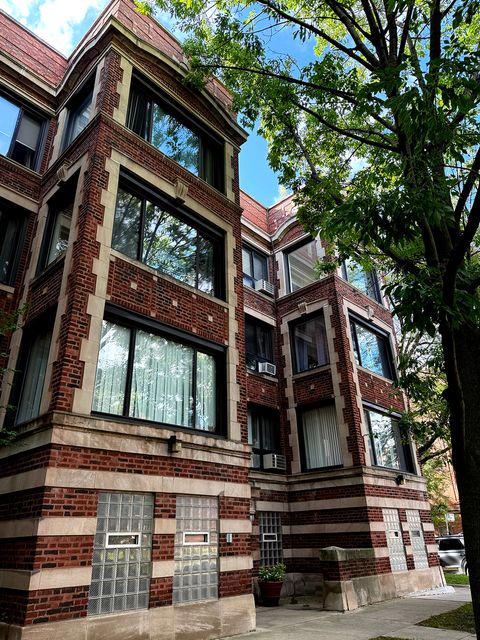
Active
$230,000
2
bds
|
1
ba
|
0
sqft
|
built
1923
5110 S Woodlawn Ave, Chicago, IL 60615
$-88
Cash flow
-2.0%
Cash-on-Cash Return
5.2%
Cap rate
1.0%
Rent to Value Ratio
Active
$128,900
2
bds
|
1
ba
|
0
sqft
|
built
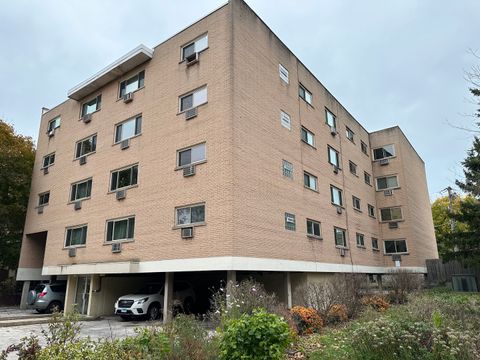
1973
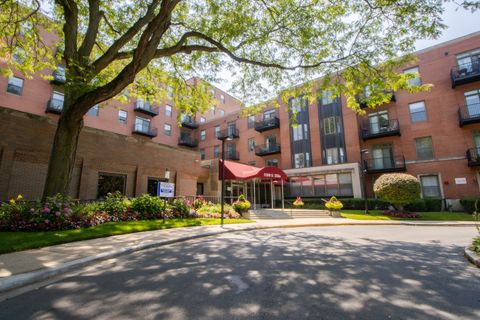
1000 E 53rd St, Chicago, IL 60615
$-630
Cash flow
-25.5%
Cash-on-Cash Return
-0.2%
Cap rate
1.2%
Rent to Value Ratio
Active
$369,000
3
bds
|
2
ba
|
1,568
sqft
|
built
1906
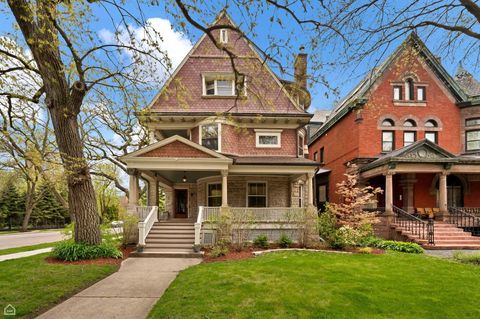
4721 S Greenwood Ave, Chicago, IL 60615
$-681
Cash flow
-9.6%
Cash-on-Cash Return
3.5%
Cap rate
0.8%
Rent to Value Ratio
Active
$179,900
1
bds
|
1
ba
|
0
sqft
|
built
1920
5400 S Harper Ave, Chicago, IL 60615
$-382
Cash flow
-11.1%
Cash-on-Cash Return
3.1%
Cap rate
0.9%
Rent to Value Ratio
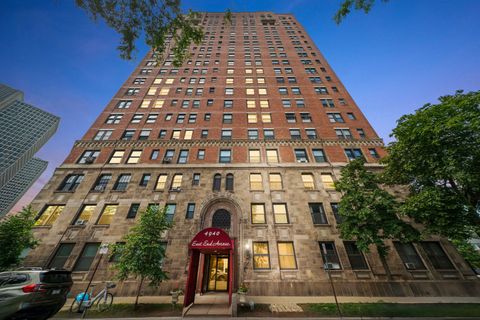
Active
$275,000
2
bds
|
2
ba
|
1,500
sqft
|
built
1929
4940 S East End Ave, Chicago, IL 60615
$-856
Cash flow
-16.2%
Cash-on-Cash Return
1.9%
Cap rate
1.0%
Rent to Value Ratio
Active
$137,900
0
bds
|
1
ba
|
0
sqft
|
built
1961
1401 E 55th St, Chicago, IL 60615
$16
Cash flow
0.6%
Cash-on-Cash Return
5.8%
Cap rate
1.3%
Rent to Value Ratio
Active
$219,000
2
bds
|
2
ba
|
750
sqft
|
built
1921
5258 S Drexel Ave, Chicago, IL 60615
$-253
Cash flow
-6.0%
Cash-on-Cash Return
4.3%
Cap rate
0.9%
Rent to Value Ratio
Active
$200,000
3
bds
|
3
ba
|
1,850
sqft
|
built
1923
5000 S Cornell Ave, Chicago, IL 60615
$-748
Cash flow
-19.5%
Cash-on-Cash Return
1.2%
Cap rate
1.3%
Rent to Value Ratio
Active
$275,000
3
bds
|
2
ba
|
1,550
sqft
|
built
1972
5201 S Cornell Ave, Chicago, IL 60615
$-1,354
Cash flow
-25.7%
Cash-on-Cash Return
-0.2%
Cap rate
0.8%
Rent to Value Ratio
Active
$369,000
4
bds
|
3
ba
|
2,600
sqft
|
built
1916
4759 S Forrestville Ave, Chicago, IL 60615
$-190
Cash flow
-2.7%
Cash-on-Cash Return
5.1%
Cap rate
1.1%
Rent to Value Ratio
Active
$334,900
3
bds
|
2
ba
|
1,584
sqft
|
built
2007
4931 S Prairie Ave, Chicago, IL 60615
$-192
Cash flow
-3.0%
Cash-on-Cash Return
5.0%
Cap rate
0.8%
Rent to Value Ratio
Active
$690,000
4
bds
|
4
ba
|
2,700
sqft
|
built
1893
4752 S Champlain Ave, Chicago, IL 60615
$-1,802
Cash flow
-13.6%
Cash-on-Cash Return
2.5%
Cap rate
0.4%
Rent to Value Ratio
Active
$149,900
1
bds
|
1
ba
|
800
sqft
|
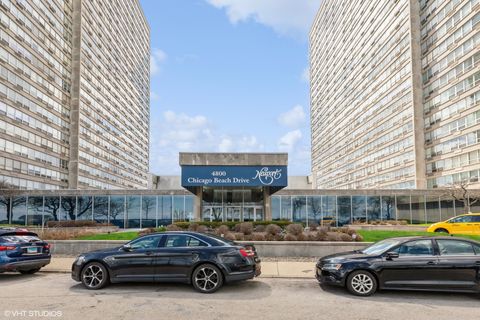
built
1962
4800 S Chicago Beach Dr, Chicago, IL 60615
$-269
Cash flow
-9.4%
Cash-on-Cash Return
3.5%
Cap rate
1.3%
Rent to Value Ratio
Active
$144,900
1
bds
|
1
ba
|
0
sqft
|
built
1971
5200 S Ellis Ave, Chicago, IL 60615
$-127
Cash flow
-4.6%
Cash-on-Cash Return
4.6%
Cap rate
1.4%
Rent to Value Ratio
Active
$1,130,000
5
bds
|
3
ba
|
3,300
sqft
|
built
1887
4923 S Blackstone Ave, Chicago, IL 60615
$-2,080
Cash flow
-9.6%
Cash-on-Cash Return
3.5%
Cap rate
0.6%
Rent to Value Ratio
Active
$580,000
4
bds
|
3
ba
|
2,500
sqft
|
built
1992
4721 S Woodlawn Ave, Chicago, IL 60615
$-1,184
Cash flow
-10.7%
Cash-on-Cash Return
3.2%
Cap rate
0.6%
Rent to Value Ratio
Active
$1,100,000
4
bds
|
4
ba
|
3,200
sqft
|
built
1894
1344 E Madison Park, Chicago, IL 60615
$-2,985
Cash flow
-14.2%
Cash-on-Cash Return
2.4%
Cap rate
0.5%
Rent to Value Ratio
Active
$1,950,000
6
bds
|
5
ba
|
4,700
sqft
|
built
1890
4801 S Kimbark Ave, Chicago, IL 60615
$-6,535
Cash flow
-17.5%
Cash-on-Cash Return
1.7%
Cap rate
0.3%
Rent to Value Ratio

Active
$975,000
6
bds
|
5
ba
|
0
sqft
|
built
1889
4836 S Dorchester Ave, Chicago, IL 60615
$-3,244
Cash flow
-17.4%
Cash-on-Cash Return
1.7%
Cap rate
0.4%
Rent to Value Ratio
Active
$200,000
3
bds
|
3
ba
|
1,900
sqft
|
built
1928
642 E 51st St, Chicago, IL 60615
$-135
Cash flow
-3.5%
Cash-on-Cash Return
4.9%
Cap rate
1.1%
Rent to Value Ratio
Active
$274,900
6
bds
|
3
ba
|
0
sqft
|
built
1898
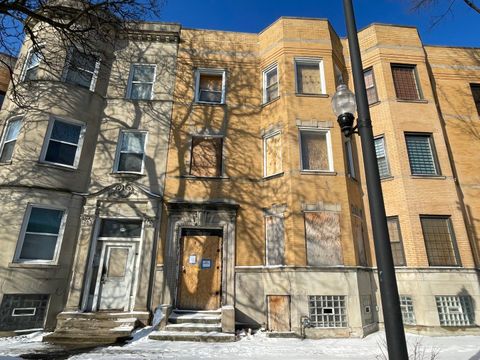
4908 S Indiana Ave, Chicago, IL 60615
$-620
Cash flow
-11.8%
Cash-on-Cash Return
3.0%
Cap rate
0.6%
Rent to Value Ratio
Active
$184,999
2
bds
|
1
ba
|
800
sqft
|
built
1968
4939 S Dorchester Ave, Chicago, IL 60615
$33
Cash flow
0.9%
Cash-on-Cash Return
5.9%
Cap rate
1.0%
Rent to Value Ratio
Active
$172,000
3
bds
|
2
ba
|
1,600
sqft
|
built
1962
4800 S Chicago Beach Dr, Chicago, IL 60615
$-682
Cash flow
-20.7%
Cash-on-Cash Return
0.9%
Cap rate
1.6%
Rent to Value Ratio
Active
$525,000
9
bds
|
3
ba
|
0
sqft
|
built
1893
663 E 50th St, Chicago, IL 60615
$-1,130
Cash flow
-11.2%
Cash-on-Cash Return
3.1%
Cap rate
0.4%
Rent to Value Ratio
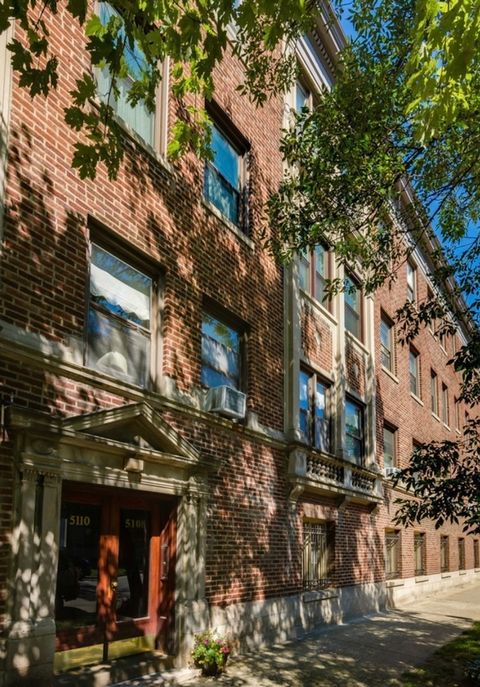
Active
$499,000
3
bds
|
3
ba
|
2,520
sqft
|
built
2002
4757 S Langley Ave, Chicago, IL 60615
$-399
Cash flow
-4.2%
Cash-on-Cash Return
4.7%
Cap rate
0.7%
Rent to Value Ratio