60616 Investment Properties for Sale
Browse homes for sale and investment properties in 60616. Refine your search by price, property type, or more.
Best cash flowing properties in 60616
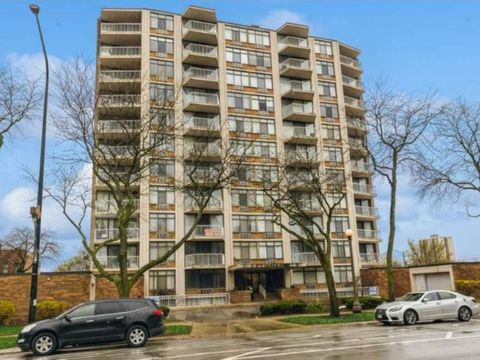
Active
$145,000
2
bds
|
2
ba
|
1,175
sqft
|
built
1978
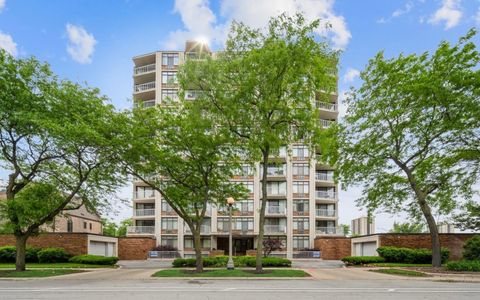
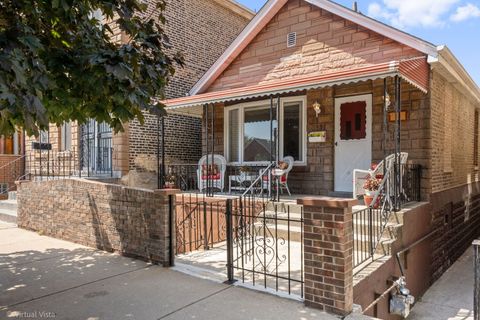
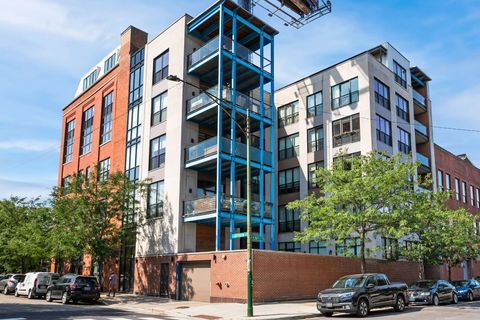
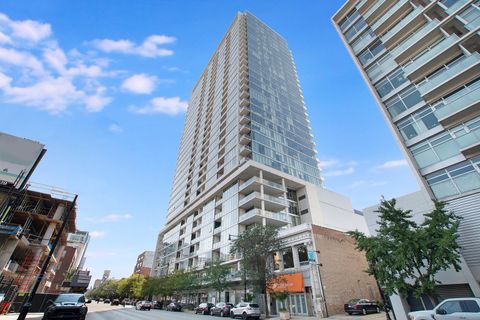
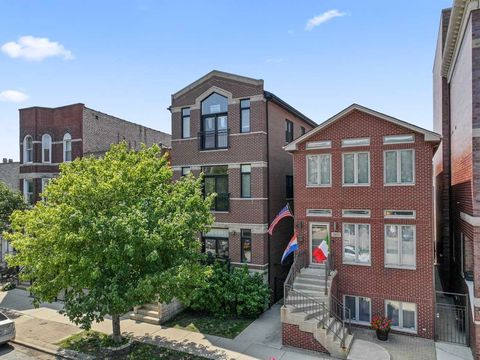
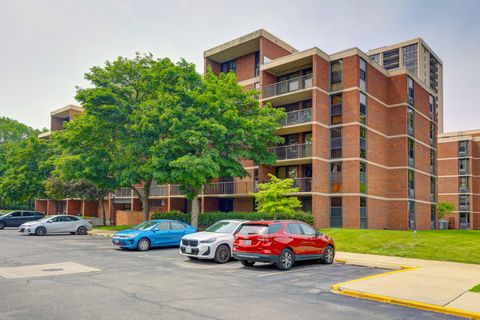
3100 S King Dr, Chicago, IL 60616
$-44
Cash flow
-1.6%
Cash-on-Cash Return
5.3%
Cap rate
1.7%
Rent to Value Ratio
Active
$99,900
0
bds
|
1
ba
|
500
sqft
|
built
1968
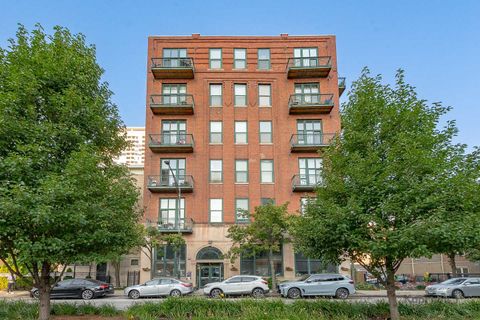
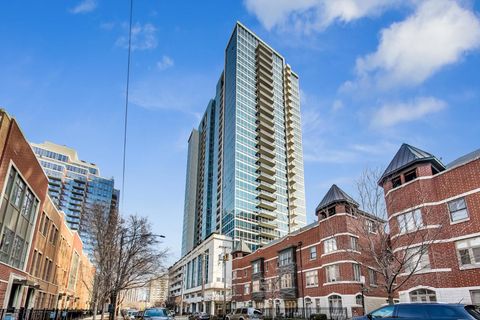
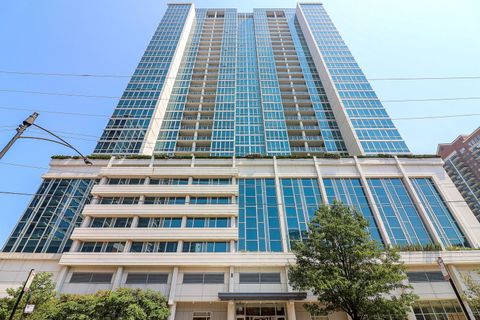
2941 S Michigan Ave, Chicago, IL 60616
$-55
Cash flow
-2.9%
Cash-on-Cash Return
5.0%
Cap rate
1.2%
Rent to Value Ratio
87 out of 105 properties for sale in 60616
Limited Results Shown
Create a free account, or log in to reveal all property listings and enjoy the complete experience.
Active
$329,995
1
bds
|
2
ba
|
1,100
sqft
|
built
1905
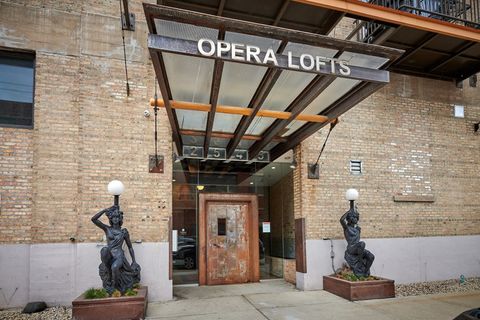
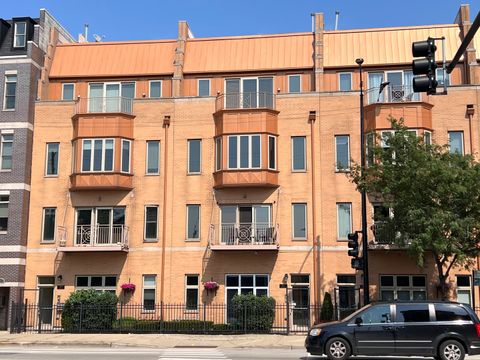
1632 S Indiana Ave, Chicago, IL 60616
$-700
Cash flow
-11.1%
Cash-on-Cash Return
3.1%
Cap rate
0.8%
Rent to Value Ratio
Active
$415,000
2
bds
|
2
ba
|
1,205
sqft
|
built
2006
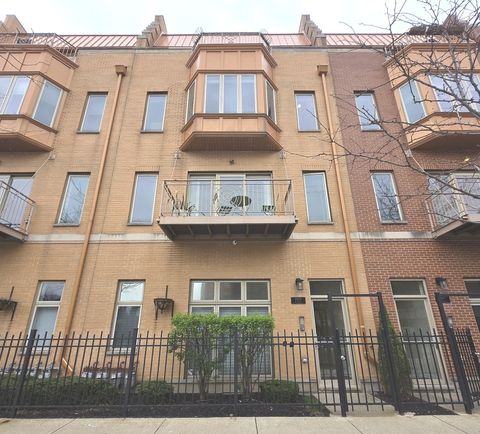
1841 S Calumet Ave, Chicago, IL 60616
$-1,918
Cash flow
-24.1%
Cash-on-Cash Return
0.1%
Cap rate
0.7%
Rent to Value Ratio
Active
$549,800
3
bds
|
2
ba
|
2,400
sqft
|
built
1883
3028 S Union Ave, Chicago, IL 60616
$-852
Cash flow
-8.1%
Cash-on-Cash Return
3.8%
Cap rate
0.5%
Rent to Value Ratio
Active
$850,000
3
bds
|
1
ba
|
0
sqft
|
built
1889
235 W 23rd St, Chicago, IL 60616
$-2,748
Cash flow
-16.9%
Cash-on-Cash Return
1.8%
Cap rate
0.3%
Rent to Value Ratio
Active
$799,999
3
bds
|
2
ba
|
0
sqft
|
built
2008
50 E 16th St, Chicago, IL 60616
$-1,570
Cash flow
-10.2%
Cash-on-Cash Return
3.3%
Cap rate
0.8%
Rent to Value Ratio
Active
$335,000
2
bds
|
2
ba
|
1,300
sqft
|
built
2003
31 E 26th St, Chicago, IL 60616
$-655
Cash flow
-10.2%
Cash-on-Cash Return
3.3%
Cap rate
0.7%
Rent to Value Ratio
Active
$269,900
2
bds
|
2
ba
|
1,107
sqft
|
built
2001
3115 S Michigan Ave, Chicago, IL 60616
$-328
Cash flow
-6.3%
Cash-on-Cash Return
4.2%
Cap rate
0.9%
Rent to Value Ratio
Active
$339,900
2
bds
|
2
ba
|
1,500
sqft
|
built
2005
21 E 26th St, Chicago, IL 60616
$-456
Cash flow
-7.0%
Cash-on-Cash Return
4.1%
Cap rate
0.8%
Rent to Value Ratio
Active
$425,000
2
bds
|
2
ba
|
1,400
sqft
|
built
1910
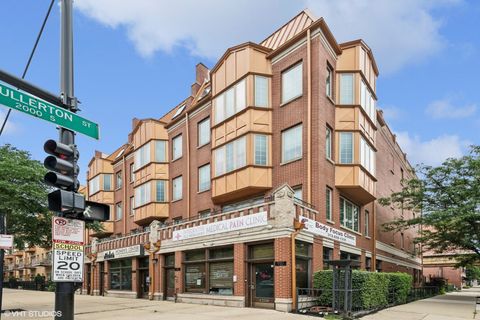
2000 S Michigan Ave, Chicago, IL 60616
$-950
Cash flow
-11.7%
Cash-on-Cash Return
3.0%
Cap rate
0.7%
Rent to Value Ratio
Active
$259,000
1
bds
|
1
ba
|
800
sqft
|
built
1905
1727 S Indiana Ave, Chicago, IL 60616
$-639
Cash flow
-12.9%
Cash-on-Cash Return
2.7%
Cap rate
0.8%
Rent to Value Ratio
Active
$149,000
2
bds
|
2
ba
|
900
sqft
|
built
1978
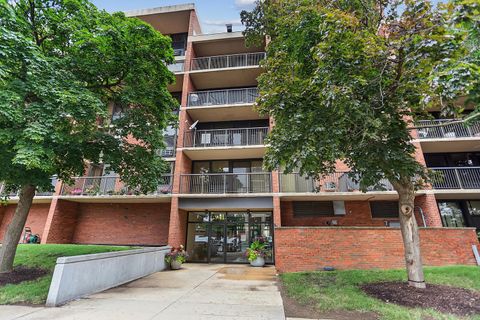
3100 S King Dr, Chicago, IL 60616
$-160
Cash flow
-5.6%
Cash-on-Cash Return
4.4%
Cap rate
1.7%
Rent to Value Ratio
Active
$239,999
1
bds
|
1
ba
|
705
sqft
|
built
2005
1720 S Michigan Ave, Chicago, IL 60616
$-726
Cash flow
-15.8%
Cash-on-Cash Return
2.1%
Cap rate
0.8%
Rent to Value Ratio
Active
$720,000
9
bds
|
4
ba
|
0
sqft
|
built
1889
2958 S Lowe Ave, Chicago, IL 60616
$-2,959
Cash flow
-21.4%
Cash-on-Cash Return
0.7%
Cap rate
0.3%
Rent to Value Ratio
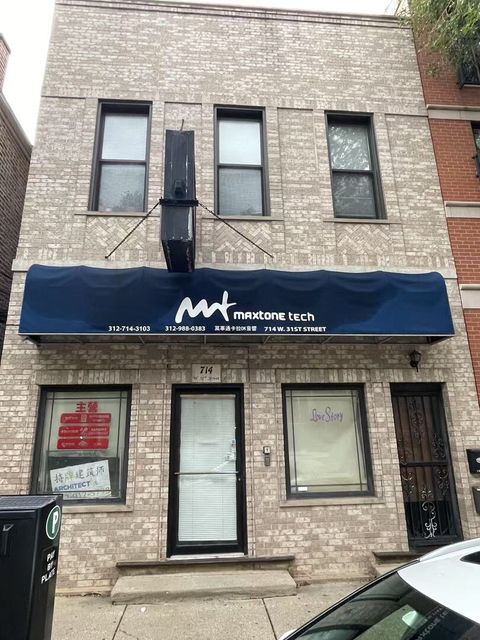
Active
$699,000
8
bds
|
4
ba
|
0
sqft
|
built
1896
714 W 31st St, Chicago, IL 60616
$-2,081
Cash flow
-15.5%
Cash-on-Cash Return
2.1%
Cap rate
0.4%
Rent to Value Ratio
Active
$320,000
1
bds
|
2
ba
|
1,000
sqft
|
built
1920
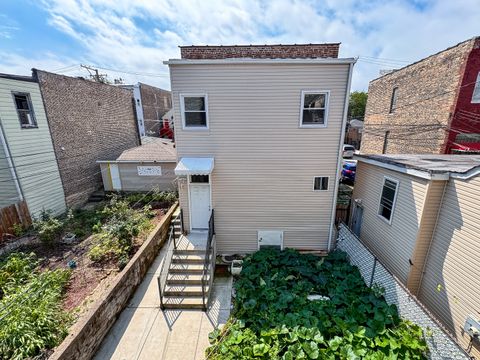
1600 S Jefferson St, Chicago, IL 60616
$-394
Cash flow
-6.4%
Cash-on-Cash Return
4.2%
Cap rate
0.9%
Rent to Value Ratio
Active
$359,900
1
bds
|
2
ba
|
1,100
sqft
|
built
2003
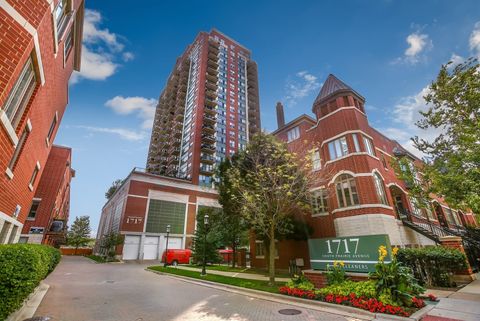
1717 S Prairie Ave, Chicago, IL 60616
$-990
Cash flow
-14.4%
Cash-on-Cash Return
2.4%
Cap rate
0.8%
Rent to Value Ratio
Active
$915,000
9
bds
|
5
ba
|
0
sqft
|
built
1973
339 W 23rd Pl, Chicago, IL 60616
$-2,365
Cash flow
-13.5%
Cash-on-Cash Return
2.6%
Cap rate
0.4%
Rent to Value Ratio
Active
$389,000
2
bds
|
2
ba
|
0
sqft
|
built
1909
2545 S Dearborn St, Chicago, IL 60616
$-1,172
Cash flow
-15.7%
Cash-on-Cash Return
2.1%
Cap rate
0.7%
Rent to Value Ratio
Active
$399,000
2
bds
|
2
ba
|
1,250
sqft
|
built
2007
1720 S Michigan Ave, Chicago, IL 60616
$-1,031
Cash flow
-13.5%
Cash-on-Cash Return
2.6%
Cap rate
0.8%
Rent to Value Ratio
Active
$349,000
1
bds
|
1
ba
|
915
sqft
|
built
2005
1629 S Prairie Ave, Chicago, IL 60616
$-709
Cash flow
-10.6%
Cash-on-Cash Return
3.2%
Cap rate
0.8%
Rent to Value Ratio
Active
$1,145,000
4
bds
|
4
ba
|
3,100
sqft
|
built
2002
1816 S Indiana Ave, Chicago, IL 60616
$-2,753
Cash flow
-12.5%
Cash-on-Cash Return
2.8%
Cap rate
0.5%
Rent to Value Ratio
Active
$399,999
2
bds
|
2
ba
|
1,200
sqft
|
built
1905
1632 S Indiana Ave, Chicago, IL 60616
$-1,140
Cash flow
-14.9%
Cash-on-Cash Return
2.3%
Cap rate
0.6%
Rent to Value Ratio
Active
$549,000
4
bds
|
3
ba
|
2,600
sqft
|
built
2012
3106 S Wells St, Chicago, IL 60616
$-1,253
Cash flow
-11.9%
Cash-on-Cash Return
2.9%
Cap rate
0.6%
Rent to Value Ratio
Active
$669,900
3
bds
|
2
ba
|
1,565
sqft
|
built
2009
1629 S Prairie Ave, Chicago, IL 60616
$-2,391
Cash flow
-18.6%
Cash-on-Cash Return
1.4%
Cap rate
0.7%
Rent to Value Ratio
Active
$339,900
2
bds
|
2
ba
|
1,143
sqft
|
built
1909
2545 S Dearborn St, Chicago, IL 60616
$-684
Cash flow
-10.5%
Cash-on-Cash Return
3.3%
Cap rate
0.8%
Rent to Value Ratio
Active
$389,999
2
bds
|
2
ba
|
1,220
sqft
|
built
2003
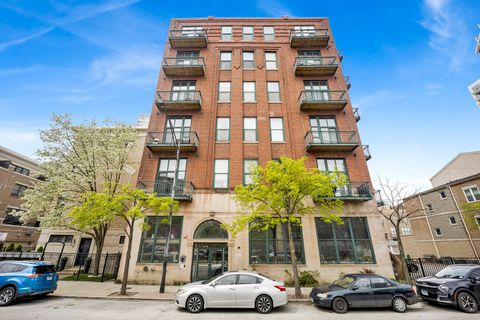
1915 S State St, Chicago, IL 60616
$-680
Cash flow
-9.1%
Cash-on-Cash Return
3.6%
Cap rate
0.7%
Rent to Value Ratio
Active
$149,500
1
bds
|
1
ba
|
700
sqft
|
built
1972
2941 S Michigan Ave, Chicago, IL 60616
$-326
Cash flow
-11.4%
Cash-on-Cash Return
3.1%
Cap rate
1.1%
Rent to Value Ratio
Active
$399,500
2
bds
|
2
ba
|
1,400
sqft
|
built
2005
1911 S State St, Chicago, IL 60616
$-646
Cash flow
-8.4%
Cash-on-Cash Return
3.7%
Cap rate
0.8%
Rent to Value Ratio
Active
$395,000
2
bds
|
2
ba
|
1,375
sqft
|
built
2003
1935 S State St, Chicago, IL 60616
$-804
Cash flow
-10.6%
Cash-on-Cash Return
3.2%
Cap rate
0.7%
Rent to Value Ratio
Active
$599,995
3
bds
|
4
ba
|
2,146
sqft
|
built
1998
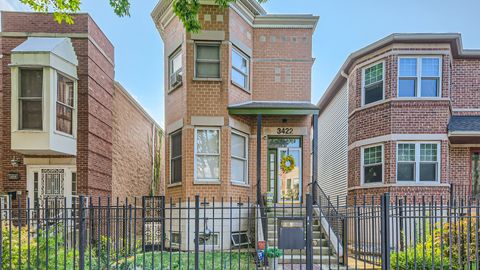
3422 S Prairie Ave, Chicago, IL 60616
$-716
Cash flow
-6.2%
Cash-on-Cash Return
4.2%
Cap rate
0.7%
Rent to Value Ratio
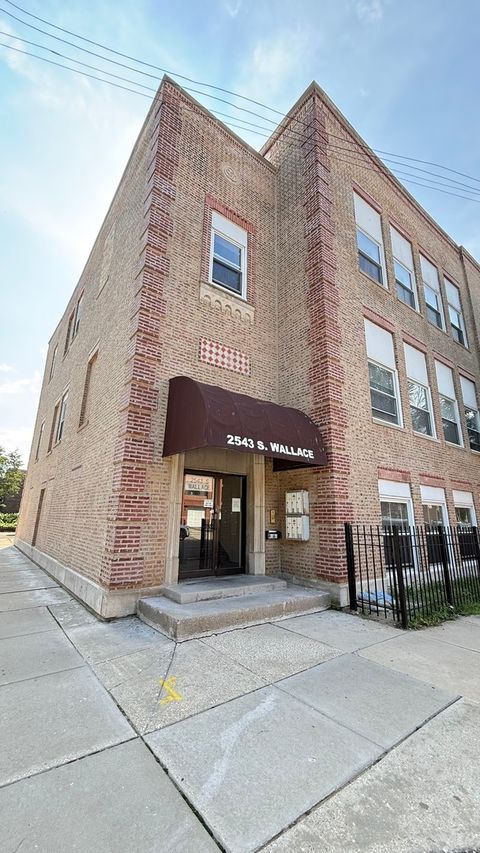
Active
$260,000
2
bds
|
1
ba
|
820
sqft
|
built
1928
2543 S Wallace St, Chicago, IL 60616
$-205
Cash flow
-4.1%
Cash-on-Cash Return
4.7%
Cap rate
0.9%
Rent to Value Ratio
Active
$475,000
2
bds
|
2
ba
|
0
sqft
|
built
2007
2517 S Calumet Ave, Chicago, IL 60616
$-867
Cash flow
-9.5%
Cash-on-Cash Return
3.5%
Cap rate
0.7%
Rent to Value Ratio
Active
$274,999
1
bds
|
1
ba
|
766
sqft
|
built
2004
1717 S Prairie Ave, Chicago, IL 60616
$-747
Cash flow
-14.2%
Cash-on-Cash Return
2.4%
Cap rate
0.8%
Rent to Value Ratio
Active
$314,500
3
bds
|
2
ba
|
1,700
sqft
|
built
1958
601 E 32nd St, Chicago, IL 60616
$-1,612
Cash flow
-26.7%
Cash-on-Cash Return
-0.5%
Cap rate
0.8%
Rent to Value Ratio
Active
$299,000
2
bds
|
1
ba
|
850
sqft
|
built
2007
1720 S Michigan Ave, Chicago, IL 60616
$-496
Cash flow
-8.7%
Cash-on-Cash Return
3.7%
Cap rate
0.8%
Rent to Value Ratio
Active
$250,000
1
bds
|
1
ba
|
722
sqft
|
built
2007
1720 S Michigan Ave, Chicago, IL 60616
$-379
Cash flow
-7.9%
Cash-on-Cash Return
3.9%
Cap rate
0.8%
Rent to Value Ratio
Active
$879,000
3
bds
|
4
ba
|
2,815
sqft
|
built
2005
324 E 17th St, Chicago, IL 60616
$-1,458
Cash flow
-8.7%
Cash-on-Cash Return
3.7%
Cap rate
0.7%
Rent to Value Ratio
Active
$479,950
2
bds
|
2
ba
|
1,384
sqft
|
built
2006
1600 S Prairie Ave, Chicago, IL 60616
$-2,316
Cash flow
-25.2%
Cash-on-Cash Return
-0.1%
Cap rate
0.6%
Rent to Value Ratio