60617 Investment Properties for Sale
Browse homes for sale and investment properties in 60617. Refine your search by price, property type, or more.
Best cash flowing properties in 60617
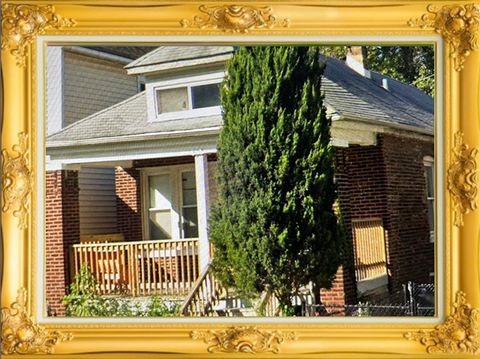
Active
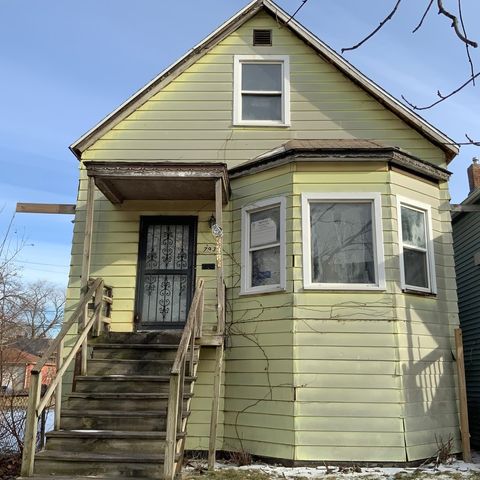
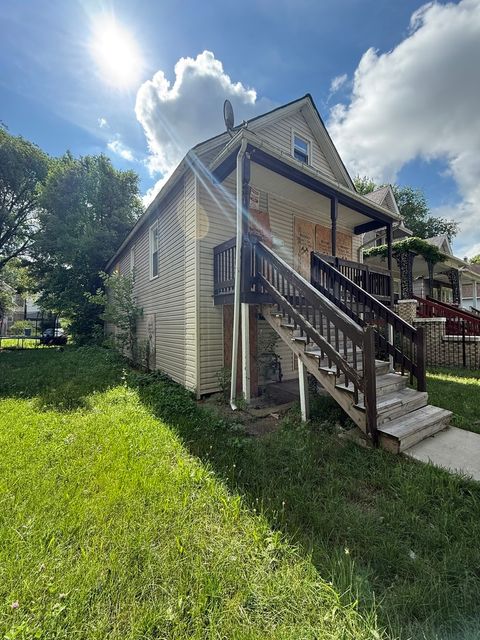
$50,000
4
bds
|
3
ba
|
2,000
sqft
|
built
1910
7935 S Coles Ave, Chicago, IL 60617
$1,300
Cash flow
30.3%
Cash-on-Cash Return
31.2%
Cap rate
4.0%
Rent to Value Ratio
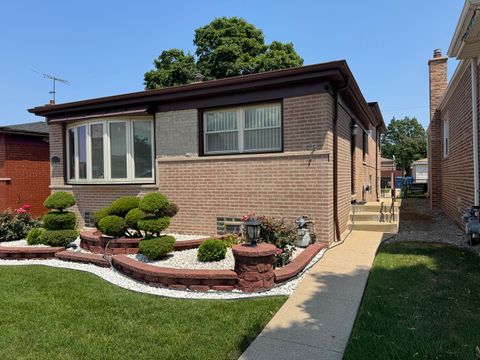
Active
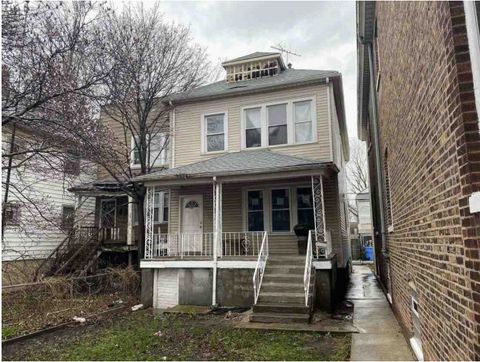
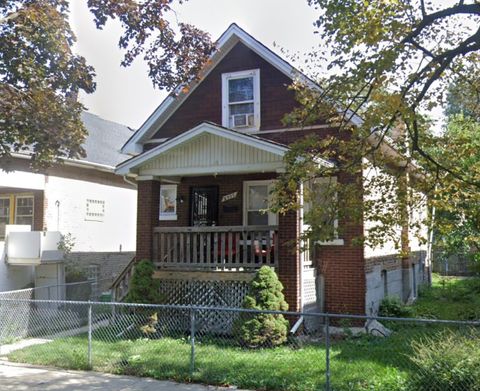
$99,000
4
bds
|
2
ba
|
1,400
sqft
|
built
1917
8613 S Houston Ave, Chicago, IL 60617
$556
Cash flow
29.3%
Cash-on-Cash Return
12.4%
Cap rate
1.6%
Rent to Value Ratio
134 out of 143 properties for sale in 60617
Limited Results Shown
Create a free account, or log in to reveal all property listings and enjoy the complete experience.
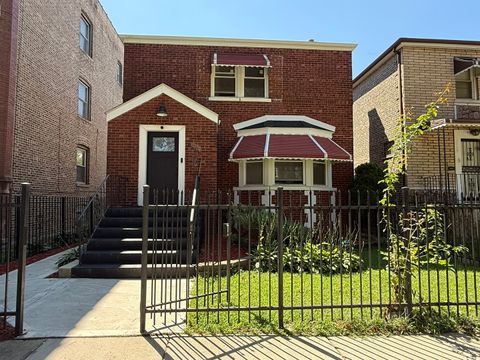
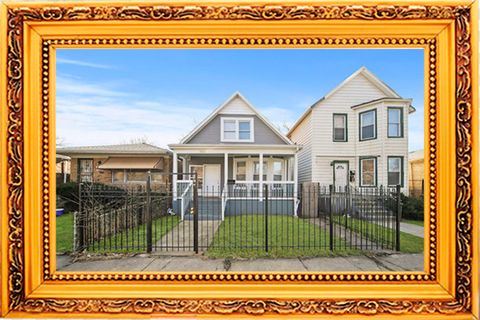
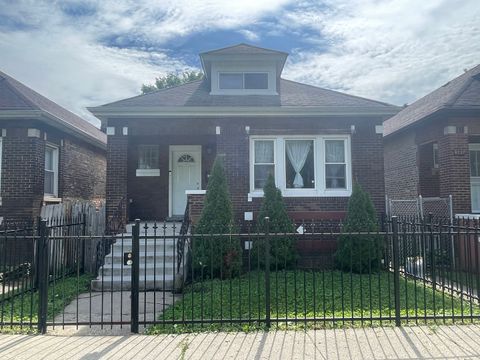
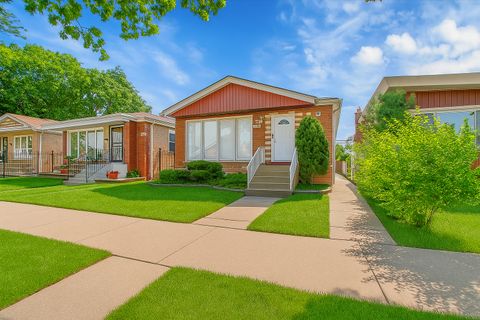
Active
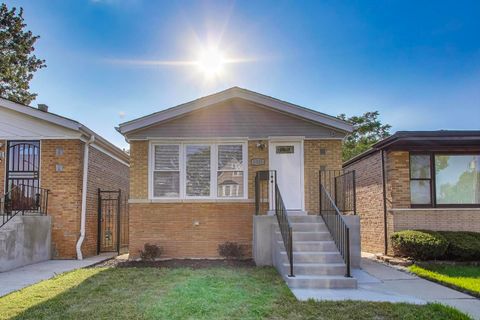
$295,000
2
bds
|
3
ba
|
2,005
sqft
|
built
1948
1719 E 86th St, Chicago, IL 60617
$176
Cash flow
3.1%
Cash-on-Cash Return
6.4%
Cap rate
0.8%
Rent to Value Ratio
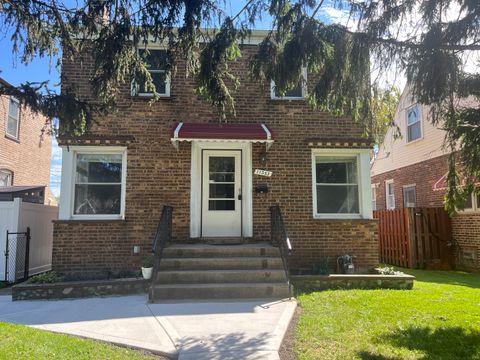
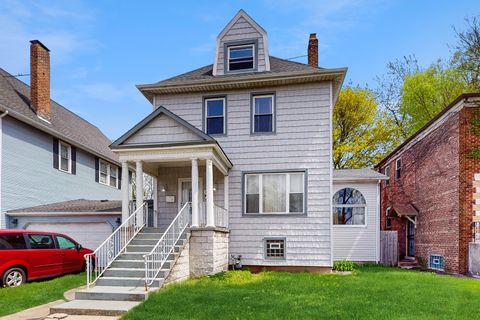
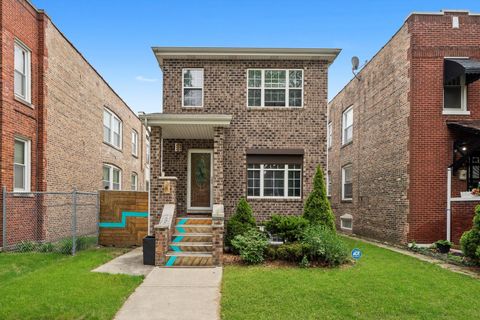
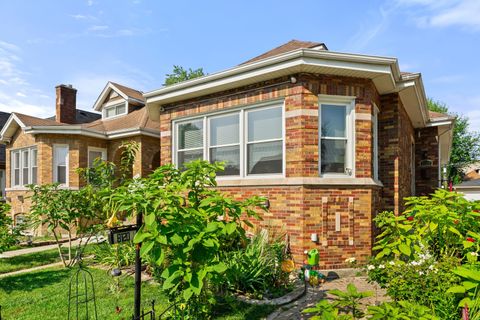
Active
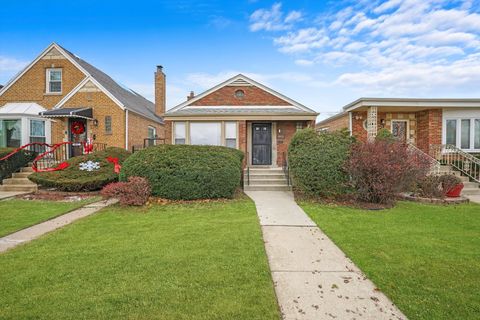
$255,900
2
bds
|
1
ba
|
972
sqft
|
built
1947
11353 S Ewing Ave, Chicago, IL 60617
$-145
Cash flow
-3.0%
Cash-on-Cash Return
5.0%
Cap rate
0.7%
Rent to Value Ratio
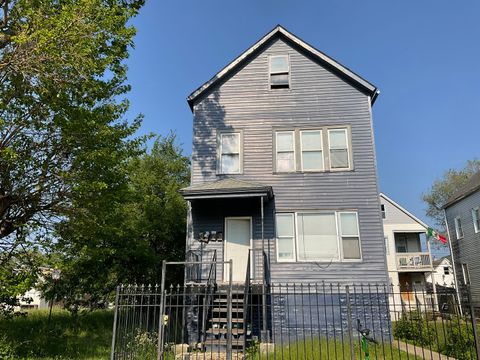
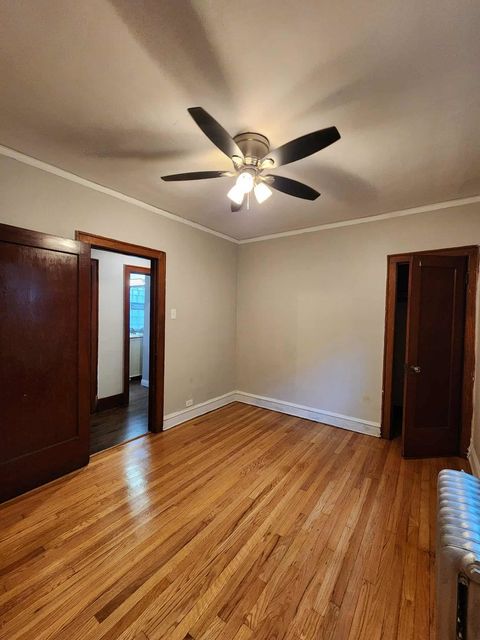
Active
$226,500
3
bds
|
2
ba
|
1,032
sqft
|
built
1971
11314 S Green Bay Ave, Chicago, IL 60617
$184
Cash flow
4.2%
Cash-on-Cash Return
6.7%
Cap rate
0.9%
Rent to Value Ratio
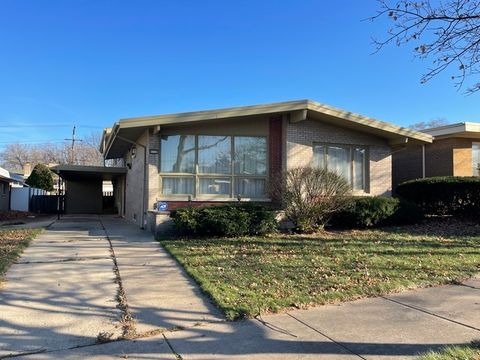
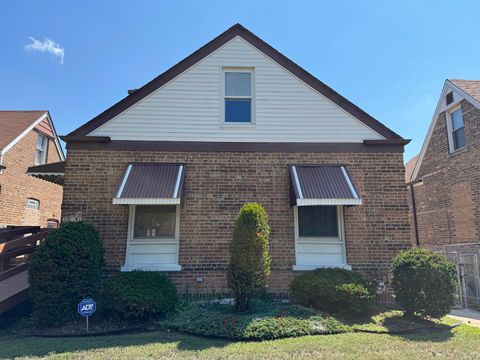
Active
$209,900
2
bds
|
2
ba
|
1,000
sqft
|
built
1957
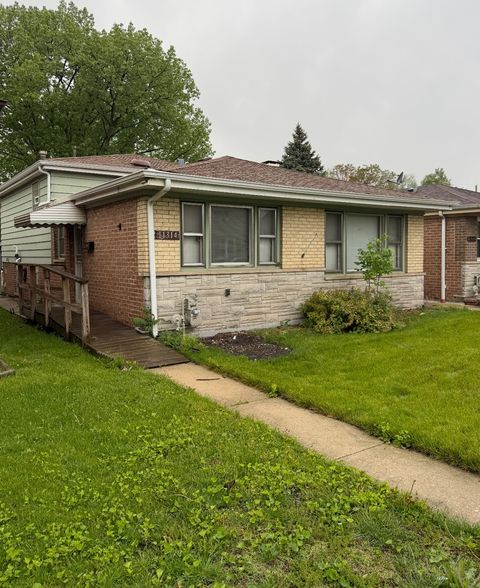
9206 S Yates Blvd, Chicago, IL 60617
$-4
Cash flow
-0.1%
Cash-on-Cash Return
5.7%
Cap rate
0.8%
Rent to Value Ratio
Active
$269,900
4
bds
|
2
ba
|
711
sqft
|
built
1890
10823 S Ewing Ave, Chicago, IL 60617
$-417
Cash flow
-8.1%
Cash-on-Cash Return
3.8%
Cap rate
0.5%
Rent to Value Ratio
Active
$199,995
3
bds
|
2
ba
|
947
sqft
|
built
1945
9733 S Merrill Ave, Chicago, IL 60617
$-86
Cash flow
-2.2%
Cash-on-Cash Return
5.2%
Cap rate
0.7%
Rent to Value Ratio
Active
$229,000
3
bds
|
1
ba
|
0
sqft
|
built
1919
9326 S Manistee Ave, Chicago, IL 60617
$176
Cash flow
4.0%
Cash-on-Cash Return
6.6%
Cap rate
0.9%
Rent to Value Ratio
Active
$309,900
3
bds
|
2
ba
|
1,250
sqft
|
built
1964
11117 S Avenue L, Chicago, IL 60617
$-137
Cash flow
-2.3%
Cash-on-Cash Return
5.2%
Cap rate
0.7%
Rent to Value Ratio
Active
$229,000
3
bds
|
1
ba
|
880
sqft
|
built
1900
7931 S East End Ave, Chicago, IL 60617
$125
Cash flow
2.8%
Cash-on-Cash Return
6.3%
Cap rate
0.9%
Rent to Value Ratio
Active
$299,900
4
bds
|
3
ba
|
2,654
sqft
|
built
1890
8211 S Cornell Ave, Chicago, IL 60617
$284
Cash flow
4.9%
Cash-on-Cash Return
6.8%
Cap rate
0.9%
Rent to Value Ratio
Active
$160,000
3
bds
|
2
ba
|
950
sqft
|
built
1952
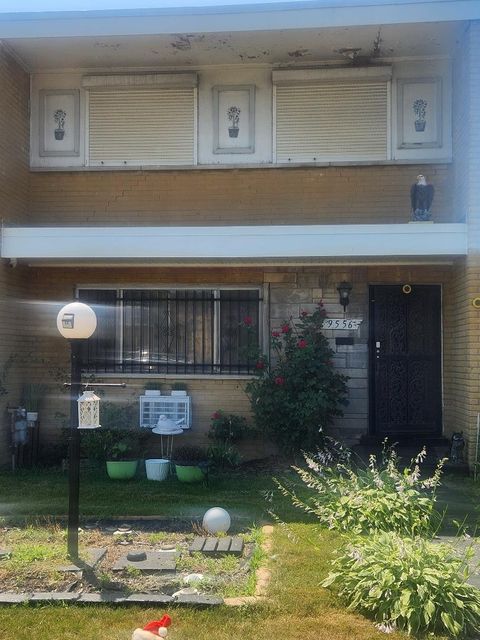
9556 S Colfax Ave, Chicago, IL 60617
$347
Cash flow
11.3%
Cash-on-Cash Return
8.3%
Cap rate
1.0%
Rent to Value Ratio
Active
$285,000
2
bds
|
2
ba
|
2,400
sqft
|
built
1924
8336 S Merrill Ave, Chicago, IL 60617
$-180
Cash flow
-3.3%
Cash-on-Cash Return
4.9%
Cap rate
0.7%
Rent to Value Ratio
Active
$350,000
5
bds
|
2
ba
|
0
sqft
|
built
1952
8647 S Kingston Ave, Chicago, IL 60617
$-678
Cash flow
-10.1%
Cash-on-Cash Return
3.4%
Cap rate
0.5%
Rent to Value Ratio
Active
$200,000
7
bds
|
3
ba
|
0
sqft
|
built
1890
9720 S Exchange Ave, Chicago, IL 60617
$328
Cash flow
8.6%
Cash-on-Cash Return
7.6%
Cap rate
1.0%
Rent to Value Ratio
Active
$280,000
3
bds
|
2
ba
|
1,800
sqft
|
built
1922
8233 S Manistee Ave, Chicago, IL 60617
$-224
Cash flow
-4.2%
Cash-on-Cash Return
4.7%
Cap rate
0.6%
Rent to Value Ratio
Active
$270,000
3
bds
|
3
ba
|
2,200
sqft
|
built
1999
7947 S Clyde Ave, Chicago, IL 60617
$130
Cash flow
2.5%
Cash-on-Cash Return
6.3%
Cap rate
0.9%
Rent to Value Ratio
Active
$320,000
6
bds
|
4
ba
|
0
sqft
|
built
1895
8205 S Houston Ave, Chicago, IL 60617
$-163
Cash flow
-2.7%
Cash-on-Cash Return
5.1%
Cap rate
0.7%
Rent to Value Ratio
Active
$324,900
3
bds
|
2
ba
|
1,792
sqft
|
built
1960
9113 S Constance Ave, Chicago, IL 60617
$213
Cash flow
3.4%
Cash-on-Cash Return
6.5%
Cap rate
1.0%
Rent to Value Ratio
Active
$99,000
4
bds
|
2
ba
|
0
sqft
|
built
1910
8417 S Escanaba Ave, Chicago, IL 60617
$427
Cash flow
22.5%
Cash-on-Cash Return
10.9%
Cap rate
1.4%
Rent to Value Ratio
Active
$99,000
4
bds
|
2
ba
|
0
sqft
|
built
1913
8527 S Colfax Ave, Chicago, IL 60617
$521
Cash flow
27.5%
Cash-on-Cash Return
12.0%
Cap rate
1.6%
Rent to Value Ratio
Active
$379,999
3
bds
|
3
ba
|
1,800
sqft
|
built
1961
9322 S Euclid Ave, Chicago, IL 60617
$-404
Cash flow
-5.5%
Cash-on-Cash Return
4.4%
Cap rate
0.6%
Rent to Value Ratio
Active
$300,000
3
bds
|
2
ba
|
0
sqft
|
built
1953
8941 S Luella Ave, Chicago, IL 60617
$93
Cash flow
1.6%
Cash-on-Cash Return
6.1%
Cap rate
0.8%
Rent to Value Ratio
Active
$230,000
3
bds
|
2
ba
|
1,700
sqft
|
built
1946
10127 S Paxton Ave, Chicago, IL 60617
$313
Cash flow
7.1%
Cash-on-Cash Return
7.3%
Cap rate
1.0%
Rent to Value Ratio
Active
$305,000
4
bds
|
3
ba
|
1,250
sqft
|
built
1918
10642 S Calhoun Ave, Chicago, IL 60617
$-539
Cash flow
-9.2%
Cash-on-Cash Return
3.6%
Cap rate
0.5%
Rent to Value Ratio
Active
$144,900
5
bds
|
2
ba
|
0
sqft
|
built
1898
10353 S Avenue G, Chicago, IL 60617
$212
Cash flow
7.6%
Cash-on-Cash Return
7.4%
Cap rate
1.1%
Rent to Value Ratio
Active
$415,000
4
bds
|
4
ba
|
2,222
sqft
|
built
1924
8623 S Colfax Ave, Chicago, IL 60617
$-657
Cash flow
-8.3%
Cash-on-Cash Return
3.8%
Cap rate
0.5%
Rent to Value Ratio
Active
$289,900
3
bds
|
2
ba
|
2,169
sqft
|
built
1951
9007 S Cregier Ave, Chicago, IL 60617
$0
Cash flow
0.0%
Cash-on-Cash Return
5.7%
Cap rate
0.9%
Rent to Value Ratio
Active
$395,000
3
bds
|
3
ba
|
0
sqft
|
built
1925
8120 S Luella Ave, Chicago, IL 60617
$-402
Cash flow
-5.3%
Cash-on-Cash Return
4.5%
Cap rate
0.6%
Rent to Value Ratio
Active
$164,900
5
bds
|
2
ba
|
1,232
sqft
|
built
1927
8448 S Essex Ave, Chicago, IL 60617
$511
Cash flow
16.2%
Cash-on-Cash Return
9.4%
Cap rate
1.2%
Rent to Value Ratio
Active
$205,000
4
bds
|
1
ba
|
1,140
sqft
|
built
1944
10941 S Avenue C, Chicago, IL 60617
$336
Cash flow
8.6%
Cash-on-Cash Return
7.6%
Cap rate
1.0%
Rent to Value Ratio
Active
$212,000
3
bds
|
1
ba
|
1,040
sqft
|
built
1963
3052 E 97th St, Chicago, IL 60617
$86
Cash flow
2.1%
Cash-on-Cash Return
6.2%
Cap rate
0.8%
Rent to Value Ratio
Active
$327,999
3
bds
|
3
ba
|
1,876
sqft
|
built
1950
8432 S Yates Blvd, Chicago, IL 60617
$-243
Cash flow
-3.9%
Cash-on-Cash Return
4.8%
Cap rate
0.6%
Rent to Value Ratio
Active
$199,000
8
bds
|
3
ba
|
0
sqft
|
built
1878
9039 S Brandon Ave, Chicago, IL 60617
$300
Cash flow
7.9%
Cash-on-Cash Return
7.5%
Cap rate
0.9%
Rent to Value Ratio
Active
$399,000
5
bds
|
3
ba
|
2,800
sqft
|
built
1895
10642 S Avenue O, Chicago, IL 60617
$-467
Cash flow
-6.1%
Cash-on-Cash Return
4.3%
Cap rate
0.6%
Rent to Value Ratio
Active
$244,900
3
bds
|
2
ba
|
1,236
sqft
|
built
1959
8410 S Jeffery Blvd, Chicago, IL 60617
$183
Cash flow
3.9%
Cash-on-Cash Return
6.6%
Cap rate
0.9%
Rent to Value Ratio
Active
$130,000
2
bds
|
1
ba
|
1,044
sqft
|
built
1949
8929 S Paxton Ave, Chicago, IL 60617
$433
Cash flow
17.4%
Cash-on-Cash Return
9.7%
Cap rate
1.4%
Rent to Value Ratio
Active
$499,000
4
bds
|
4
ba
|
2,200
sqft
|
built
2024
8811 S Euclid Ave, Chicago, IL 60617
$-1,536
Cash flow
-16.1%
Cash-on-Cash Return
2.0%
Cap rate
0.3%
Rent to Value Ratio
Active
$239,900
4
bds
|
1
ba
|
1,489
sqft
|
built
1957
9207 S Paxton Ave, Chicago, IL 60617
$241
Cash flow
5.2%
Cash-on-Cash Return
6.9%
Cap rate
0.9%
Rent to Value Ratio