60640 Investment Properties for Sale
Browse homes for sale and investment properties in 60640. Refine your search by price, property type, or more.
Best cash flowing properties in 60640
Active
$120,000
bds
|
1
ba
|
600
sqft
|
built
1974
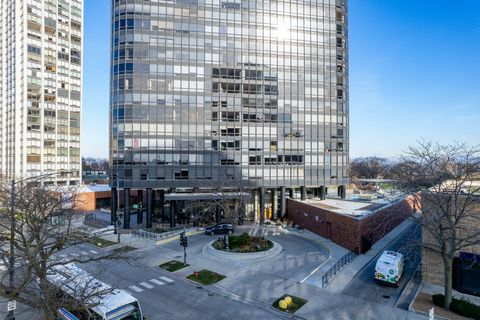
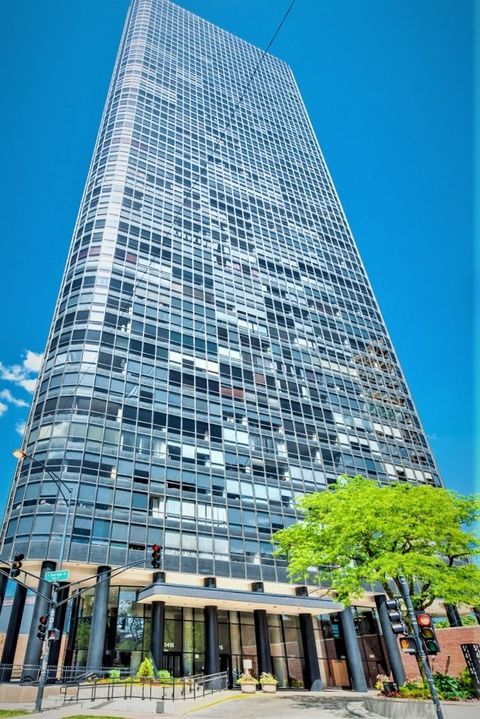
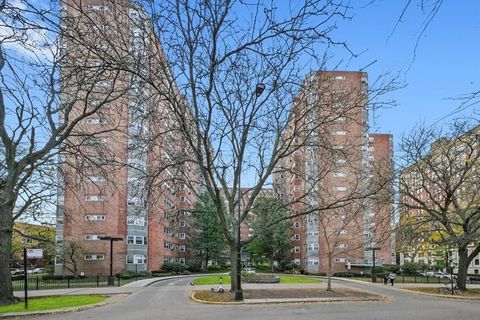
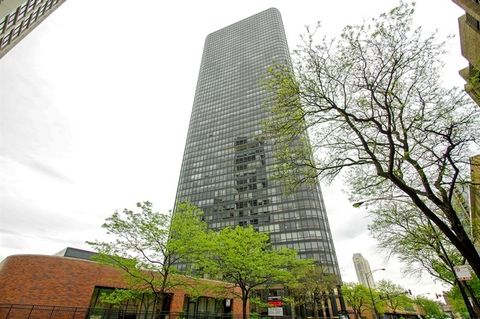
5415 N Sheridan Rd, Chicago, IL 60640
$7
Cash flow
0.3%
Cash-on-Cash Return
5.8%
Cap rate
1.5%
Rent to Value Ratio
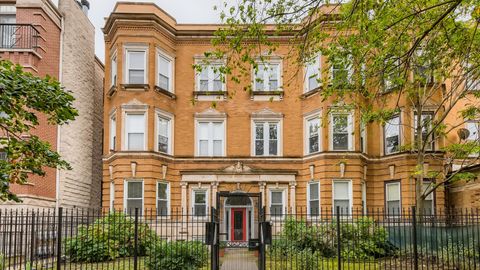
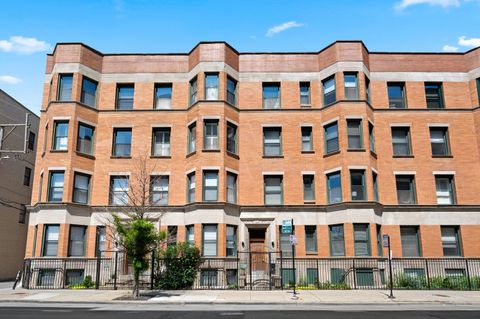
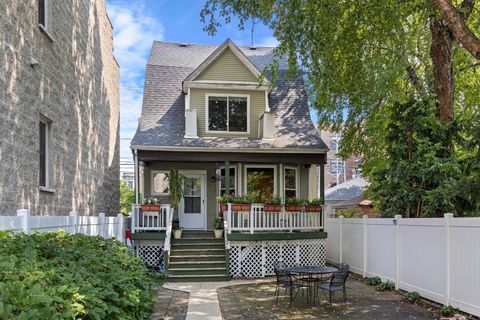
Active
$255,000
2
bds
|
2
ba
|
1,000
sqft
|
built
1903
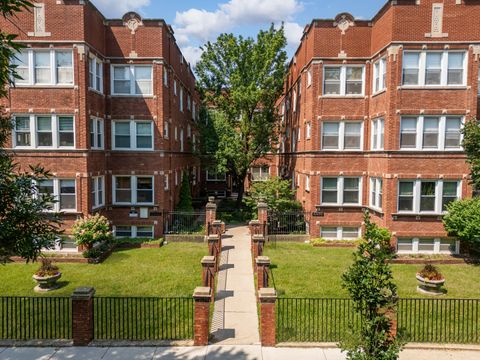
4707 N Kenmore Ave, Chicago, IL 60640
$-218
Cash flow
-4.5%
Cash-on-Cash Return
4.7%
Cap rate
1.0%
Rent to Value Ratio
27 out of 43 properties for sale in 60640
Limited Results Shown
Create a free account, or log in to reveal all property listings and enjoy the complete experience.
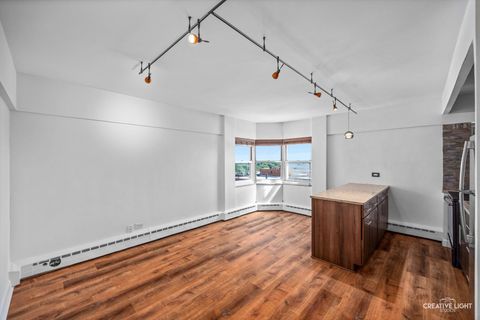
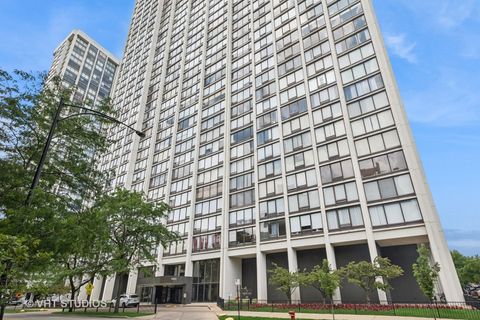
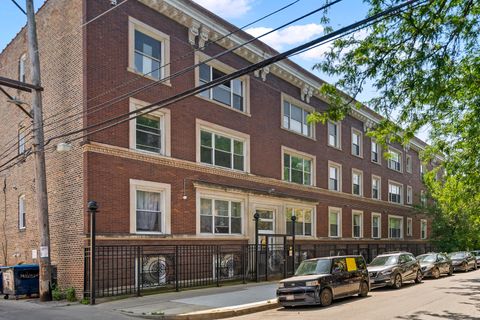
Active
$172,500
1
bds
|
1
ba
|
600
sqft
|
built
1950
4960 N Marine Dr, Chicago, IL 60640
$-519
Cash flow
-15.7%
Cash-on-Cash Return
2.1%
Cap rate
0.9%
Rent to Value Ratio
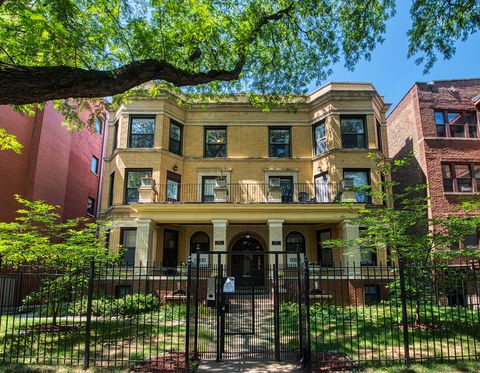
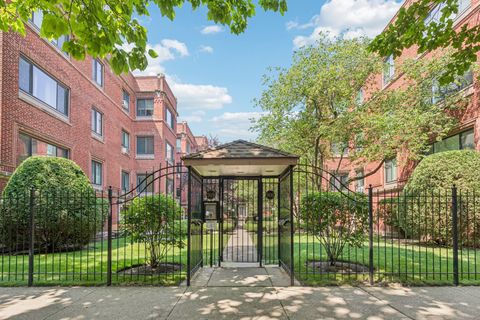
Active
$240,000
1
bds
|
1
ba
|
0
sqft
|
built
1907
5224 N Winthrop Ave, Chicago, IL 60640
$-439
Cash flow
-9.5%
Cash-on-Cash Return
3.5%
Cap rate
0.8%
Rent to Value Ratio
Active
$325,000
2
bds
|
1
ba
|
0
sqft
|
built
1890
1044 W Lawrence Ave, Chicago, IL 60640
$-692
Cash flow
-11.1%
Cash-on-Cash Return
3.1%
Cap rate
0.7%
Rent to Value Ratio
Active
$1,300,000
4
bds
|
2
ba
|
4,000
sqft
|
built
1934
1776 W Winnemac Ave, Chicago, IL 60640
$-3,102
Cash flow
-12.4%
Cash-on-Cash Return
2.8%
Cap rate
0.5%
Rent to Value Ratio
Active
$364,875
2
bds
|
2
ba
|
1,225
sqft
|
built
1972
5445 N Sheridan Rd, Chicago, IL 60640
$-965
Cash flow
-13.8%
Cash-on-Cash Return
2.5%
Cap rate
0.8%
Rent to Value Ratio
Active
$499,900
3
bds
|
2
ba
|
0
sqft
|
built
1996
4437 N Ashland Ave, Chicago, IL 60640
$-1,186
Cash flow
-12.4%
Cash-on-Cash Return
2.8%
Cap rate
0.6%
Rent to Value Ratio
Active
$485,000
2
bds
|
3
ba
|
1,210
sqft
|
built
2009
1313 W Carmen Ave, Chicago, IL 60640
$-637
Cash flow
-6.9%
Cash-on-Cash Return
4.1%
Cap rate
0.7%
Rent to Value Ratio
Active
$570,000
2
bds
|
2
ba
|
1,500
sqft
|
built
1917
4647 N Wolcott Ave, Chicago, IL 60640
$-1,307
Cash flow
-12.0%
Cash-on-Cash Return
2.9%
Cap rate
0.6%
Rent to Value Ratio
Active
$525,000
3
bds
|
2
ba
|
1,425
sqft
|
built
2005
5021 N Kenmore Ave, Chicago, IL 60640
$-1,049
Cash flow
-10.4%
Cash-on-Cash Return
3.3%
Cap rate
0.7%
Rent to Value Ratio
Active
$295,000
2
bds
|
1
ba
|
0
sqft
|
built
1924
4720 N Beacon St, Chicago, IL 60640
$-345
Cash flow
-6.1%
Cash-on-Cash Return
4.3%
Cap rate
0.7%
Rent to Value Ratio
Active
$299,900
2
bds
|
1
ba
|
0
sqft
|
built
1913
4442 N Beacon St, Chicago, IL 60640
$-314
Cash flow
-5.5%
Cash-on-Cash Return
4.4%
Cap rate
0.8%
Rent to Value Ratio
Active
$239,900
1
bds
|
1
ba
|
860
sqft
|
built
1974
5415 N Sheridan Rd, Chicago, IL 60640
$-564
Cash flow
-12.3%
Cash-on-Cash Return
2.9%
Cap rate
1.0%
Rent to Value Ratio
Active
$250,000
1
bds
|
1
ba
|
990
sqft
|
built
1969
5455 N Sheridan Rd, Chicago, IL 60640
$-1,007
Cash flow
-21.0%
Cash-on-Cash Return
0.8%
Cap rate
0.9%
Rent to Value Ratio
Active
$295,000
2
bds
|
2
ba
|
1,343
sqft
|
built
1973
5415 N Sheridan Rd, Chicago, IL 60640
$-1,057
Cash flow
-18.7%
Cash-on-Cash Return
1.4%
Cap rate
1.0%
Rent to Value Ratio
Active
$165,900
1
bds
|
1
ba
|
650
sqft
|
built
1942
4950 N Marine Dr, Chicago, IL 60640
$-508
Cash flow
-16.0%
Cash-on-Cash Return
2.0%
Cap rate
1.0%
Rent to Value Ratio
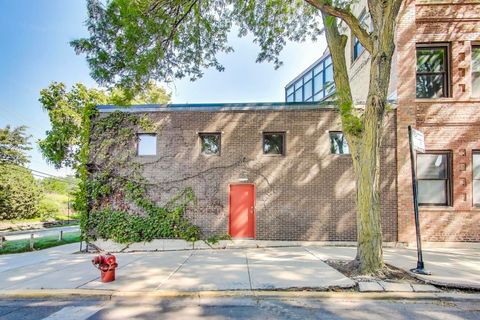
Active
$875,000
2
bds
|
3
ba
|
1,306
sqft
|
built
1903
4911 N Ashland Ave, Chicago, IL 60640
$-1,550
Cash flow
-9.2%
Cash-on-Cash Return
3.6%
Cap rate
0.6%
Rent to Value Ratio
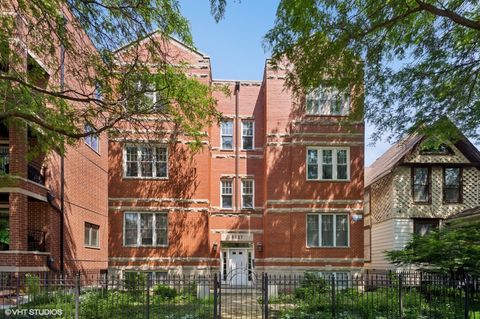
Active
$399,900
2
bds
|
2
ba
|
860
sqft
|
built
1915
1019 W Winona St, Chicago, IL 60640
$-872
Cash flow
-11.4%
Cash-on-Cash Return
3.1%
Cap rate
0.6%
Rent to Value Ratio
Active
$309,900
2
bds
|
1
ba
|
1,000
sqft
|
built
1925
906 W Sunnyside Ave, Chicago, IL 60640
$-579
Cash flow
-9.7%
Cash-on-Cash Return
3.4%
Cap rate
0.8%
Rent to Value Ratio
Active
$234,900
1
bds
|
1
ba
|
795
sqft
|
built
1973
5415 N Sheridan Rd, Chicago, IL 60640
$-792
Cash flow
-17.6%
Cash-on-Cash Return
1.6%
Cap rate
0.9%
Rent to Value Ratio
Active
$189,900
1
bds
|
1
ba
|
750
sqft
|
built
1984
5320 N Sheridan Rd, Chicago, IL 60640
$-331
Cash flow
-9.1%
Cash-on-Cash Return
3.6%
Cap rate
1.1%
Rent to Value Ratio
Active
$135,000
1
bds
|
1
ba
|
0
sqft
|
built
1947
4960 N Marine Dr, Chicago, IL 60640
$-292
Cash flow
-11.3%
Cash-on-Cash Return
3.1%
Cap rate
1.2%
Rent to Value Ratio
Active
$315,000
2
bds
|
2
ba
|
1,300
sqft
|
built
1974
5455 N Sheridan Rd, Chicago, IL 60640
$-1,254
Cash flow
-20.8%
Cash-on-Cash Return
0.9%
Cap rate
0.9%
Rent to Value Ratio
Active
$219,999
1
bds
|
1
ba
|
0
sqft
|
built
2007
1122 W Catalpa Ave, Chicago, IL 60640
$-808
Cash flow
-19.2%
Cash-on-Cash Return
1.3%
Cap rate
0.9%
Rent to Value Ratio
Active
$159,900
1
bds
|
1
ba
|
0
sqft
|
built
1973
5415 N Sheridan Rd, Chicago, IL 60640
$-433
Cash flow
-14.1%
Cash-on-Cash Return
2.4%
Cap rate
1.1%
Rent to Value Ratio

Active
$799,000
4
bds
|
4
ba
|
3,200
sqft
|
built
1922
844 W Agatite Ave, Chicago, IL 60640
$-1,915
Cash flow
-12.5%
Cash-on-Cash Return
2.8%
Cap rate
0.6%
Rent to Value Ratio