60654 Investment Properties for Sale
Browse homes for sale and investment properties in 60654. Refine your search by price, property type, or more.
Best cash flowing properties in 60654
Active
$165,000
bds
|
1
ba
|
500
sqft
|
built
1962
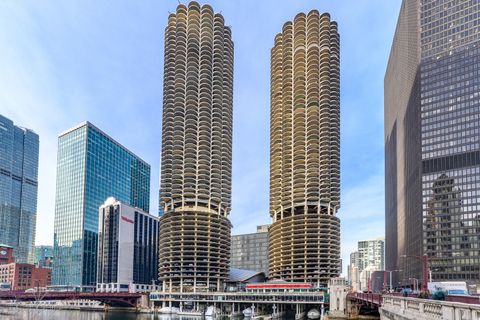
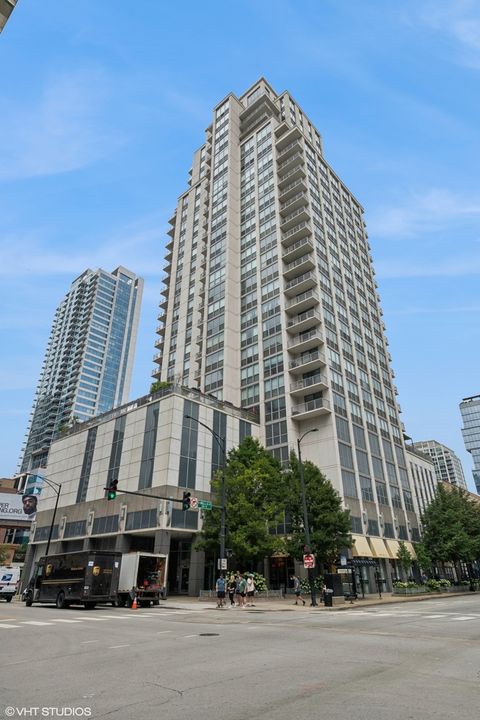
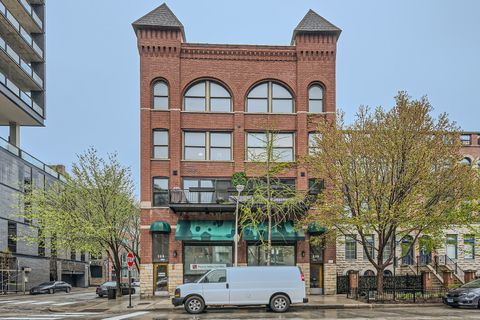
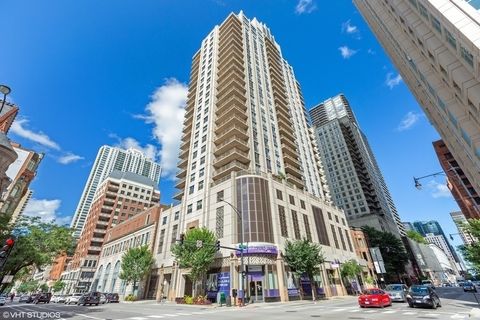
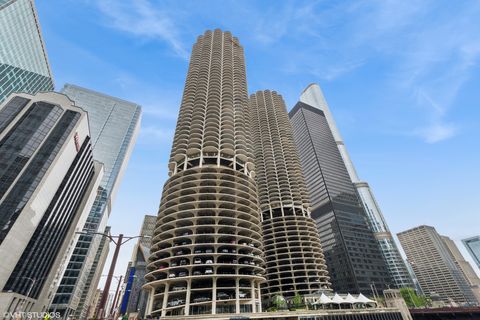
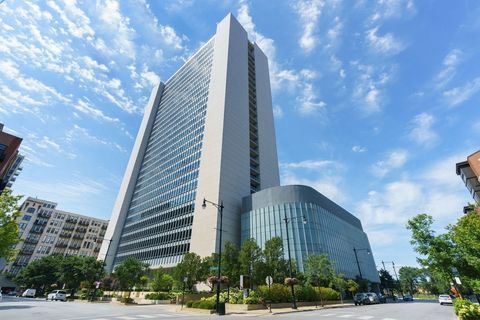
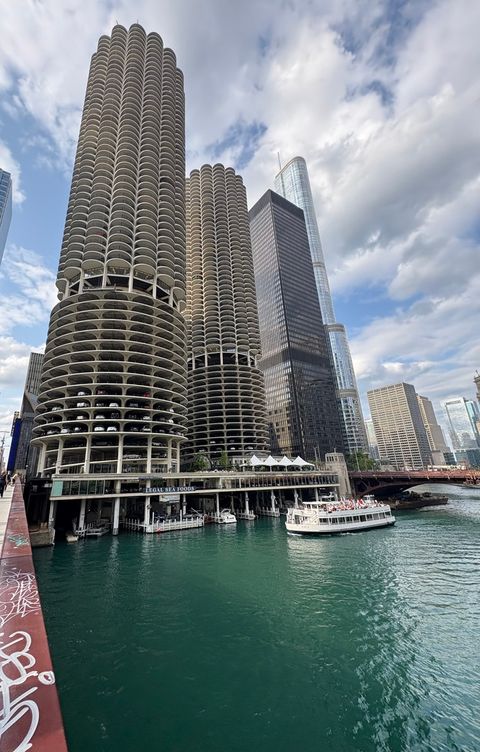
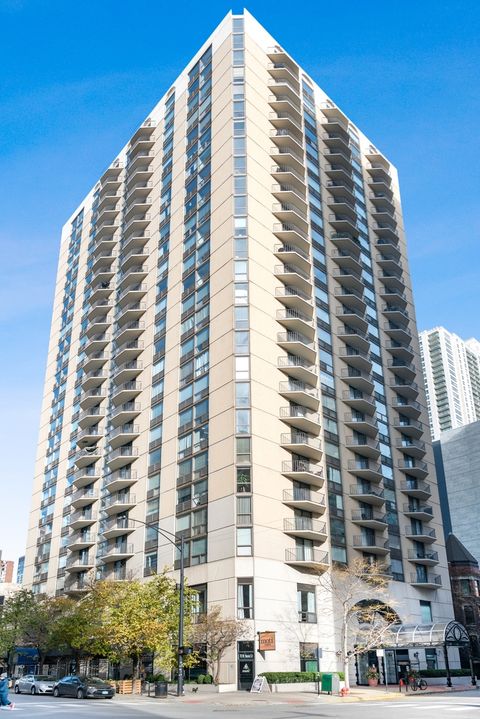
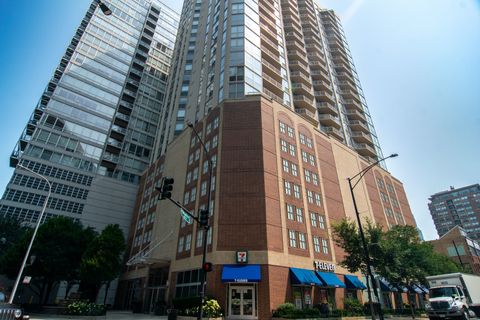
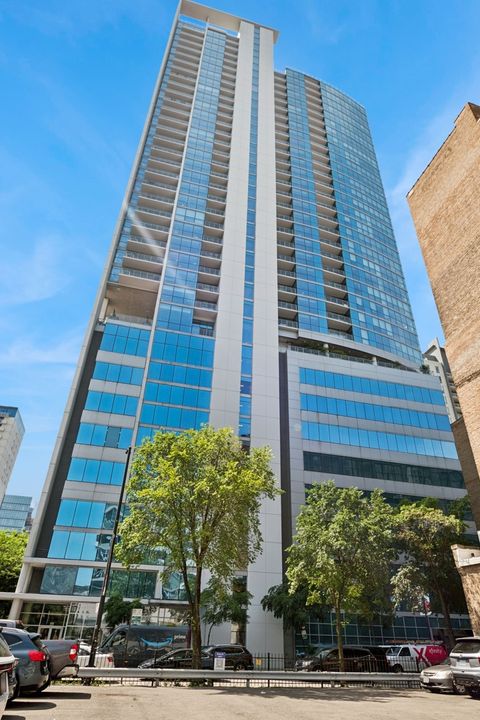
300 N State St, Chicago, IL 60654
$365
Cash flow
11.5%
Cash-on-Cash Return
8.3%
Cap rate
1.6%
Rent to Value Ratio
Active
$199,000
bds
|
1
ba
|
500
sqft
|
built
1962
300 N State St, Chicago, IL 60654
$-369
Cash flow
-9.7%
Cash-on-Cash Return
3.5%
Cap rate
0.9%
Rent to Value Ratio
85 out of 98 properties for sale in 60654
Limited Results Shown
Create a free account, or log in to reveal all property listings and enjoy the complete experience.
Active
$299,000
1
bds
|
1
ba
|
723
sqft
|
built
2010
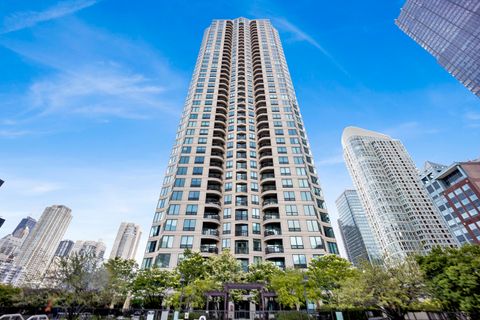
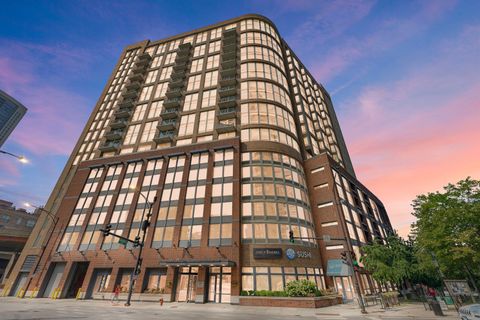
400 N La Salle Dr, Chicago, IL 60654
$-713
Cash flow
-12.4%
Cash-on-Cash Return
2.8%
Cap rate
0.8%
Rent to Value Ratio
Active
$399,900
2
bds
|
2
ba
|
1,141
sqft
|
built
1972
500 W Superior St, Chicago, IL 60654
$-1,508
Cash flow
-19.7%
Cash-on-Cash Return
1.2%
Cap rate
0.9%
Rent to Value Ratio
Active
$475,000
2
bds
|
2
ba
|
1,275
sqft
|
built
2004
200 W Grand Ave, Chicago, IL 60654
$-1,017
Cash flow
-11.2%
Cash-on-Cash Return
3.1%
Cap rate
0.8%
Rent to Value Ratio
Active
$435,000
2
bds
|
2
ba
|
1,350
sqft
|
built
1908
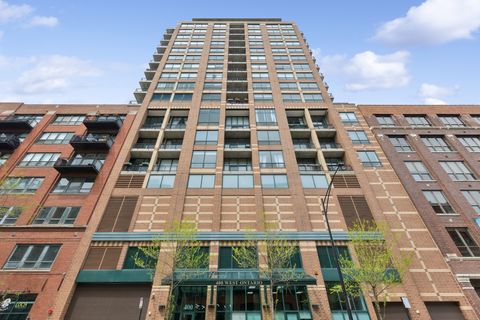
411 W Ontario St, Chicago, IL 60654
$-913
Cash flow
-11.0%
Cash-on-Cash Return
3.2%
Cap rate
0.9%
Rent to Value Ratio
Active
$1,099,000
4
bds
|
4
ba
|
2,617
sqft
|
built
2001
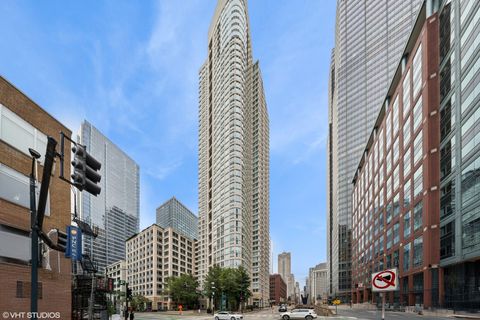
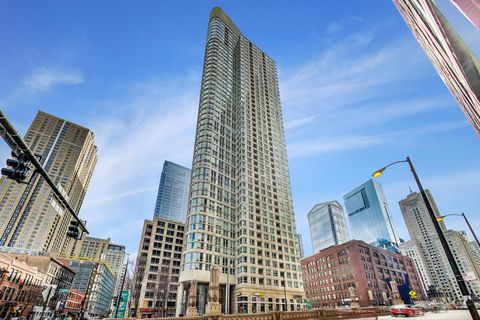
501 N Clinton St, Chicago, IL 60654
$-6,966
Cash flow
-33.1%
Cash-on-Cash Return
-1.9%
Cap rate
0.3%
Rent to Value Ratio
Active
$799,000
3
bds
|
3
ba
|
2,406
sqft
|
built
2002
60 W Erie St, Chicago, IL 60654
$-5,585
Cash flow
-36.5%
Cash-on-Cash Return
-2.7%
Cap rate
0.4%
Rent to Value Ratio
Active
$655,000
3
bds
|
2
ba
|
1,875
sqft
|
built
1888
368 W Huron St, Chicago, IL 60654
$-2,456
Cash flow
-19.6%
Cash-on-Cash Return
1.2%
Cap rate
0.4%
Rent to Value Ratio
Active
$320,000
1
bds
|
1
ba
|
780
sqft
|
built
2007
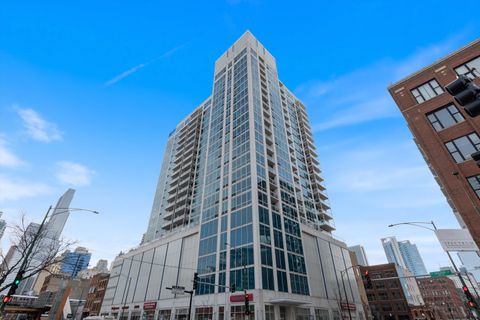
451 W Huron St, Chicago, IL 60654
$-755
Cash flow
-12.3%
Cash-on-Cash Return
2.8%
Cap rate
0.8%
Rent to Value Ratio
Active
$589,000
2
bds
|
2
ba
|
1,285
sqft
|
built
2000
501 N Clinton St, Chicago, IL 60654
$-1,390
Cash flow
-12.3%
Cash-on-Cash Return
2.8%
Cap rate
0.8%
Rent to Value Ratio
Active
$335,000
1
bds
|
1
ba
|
900
sqft
|
built
2003
545 N Dearborn St, Chicago, IL 60654
$-1,204
Cash flow
-18.8%
Cash-on-Cash Return
1.4%
Cap rate
0.8%
Rent to Value Ratio
Active
$475,000
2
bds
|
2
ba
|
0
sqft
|
built
2003
635 N Dearborn St, Chicago, IL 60654
$-1,780
Cash flow
-19.6%
Cash-on-Cash Return
1.2%
Cap rate
0.8%
Rent to Value Ratio
Active
$315,000
1
bds
|
1
ba
|
728
sqft
|
built
2009
303 W Ohio St, Chicago, IL 60654
$-526
Cash flow
-8.7%
Cash-on-Cash Return
3.7%
Cap rate
1.0%
Rent to Value Ratio
Active
$669,000
2
bds
|
2
ba
|
1,600
sqft
|
built
1924
154 W Hubbard St, Chicago, IL 60654
$-1,562
Cash flow
-12.2%
Cash-on-Cash Return
2.9%
Cap rate
0.7%
Rent to Value Ratio
Active
$445,000
2
bds
|
2
ba
|
1,361
sqft
|
built
2003
33 W Ontario St, Chicago, IL 60654
$-1,663
Cash flow
-19.5%
Cash-on-Cash Return
1.2%
Cap rate
0.8%
Rent to Value Ratio
Active
$257,000
1
bds
|
1
ba
|
725
sqft
|
built
1962
300 N State St, Chicago, IL 60654
$-869
Cash flow
-17.6%
Cash-on-Cash Return
1.6%
Cap rate
0.9%
Rent to Value Ratio
Active
$335,000
1
bds
|
1
ba
|
900
sqft
|
built
2003
545 N Dearborn St, Chicago, IL 60654
$-1,147
Cash flow
-17.9%
Cash-on-Cash Return
1.6%
Cap rate
0.8%
Rent to Value Ratio
Active
$550,000
2
bds
|
2
ba
|
1,191
sqft
|
built
2000
400 N Clinton St, Chicago, IL 60654
$-1,809
Cash flow
-17.2%
Cash-on-Cash Return
1.7%
Cap rate
0.7%
Rent to Value Ratio
Active
$375,000
2
bds
|
1
ba
|
947
sqft
|
built
2009
303 W Ohio St, Chicago, IL 60654
$-765
Cash flow
-10.6%
Cash-on-Cash Return
3.2%
Cap rate
0.9%
Rent to Value Ratio
Active
$425,000
2
bds
|
2
ba
|
1,170
sqft
|
built
1972
500 W Superior St, Chicago, IL 60654
$-1,488
Cash flow
-18.3%
Cash-on-Cash Return
1.5%
Cap rate
1.0%
Rent to Value Ratio
Active
$340,000
1
bds
|
1
ba
|
702
sqft
|
built
2003
400 N La Salle Dr, Chicago, IL 60654
$-726
Cash flow
-11.1%
Cash-on-Cash Return
3.1%
Cap rate
0.8%
Rent to Value Ratio
Active
$799,000
2
bds
|
3
ba
|
1,900
sqft
|
built
2002
60 W Erie St, Chicago, IL 60654
$-3,660
Cash flow
-23.9%
Cash-on-Cash Return
0.2%
Cap rate
0.6%
Rent to Value Ratio
Active
$765,000
2
bds
|
3
ba
|
1,850
sqft
|
built
1996
363 W Superior St, Chicago, IL 60654
$-2,162
Cash flow
-14.7%
Cash-on-Cash Return
2.3%
Cap rate
0.6%
Rent to Value Ratio
Active
$299,500
1
bds
|
1
ba
|
725
sqft
|
built
1968
300 N State St, Chicago, IL 60654
$-775
Cash flow
-13.5%
Cash-on-Cash Return
2.6%
Cap rate
1.0%
Rent to Value Ratio
Active
$1,800,000
4
bds
|
5
ba
|
4,924
sqft
|
built
2002
600 N Kingsbury St, Chicago, IL 60654
$-12,387
Cash flow
-35.9%
Cash-on-Cash Return
-2.6%
Cap rate
0.2%
Rent to Value Ratio
Active
$310,000
1
bds
|
1
ba
|
850
sqft
|
built
2002
345 N La Salle Dr, Chicago, IL 60654
$-644
Cash flow
-10.8%
Cash-on-Cash Return
3.2%
Cap rate
0.8%
Rent to Value Ratio
Active
$580,000
2
bds
|
2
ba
|
1,325
sqft
|
built
2008
757 N Orleans St, Chicago, IL 60654
$-1,875
Cash flow
-16.9%
Cash-on-Cash Return
1.8%
Cap rate
0.8%
Rent to Value Ratio
Active
$270,000
1
bds
|
1
ba
|
875
sqft
|
built
1985
70 W Huron St, Chicago, IL 60654
$-423
Cash flow
-8.2%
Cash-on-Cash Return
3.8%
Cap rate
1.1%
Rent to Value Ratio
Active
$375,000
2
bds
|
2
ba
|
1,000
sqft
|
built
2001
600 N Dearborn St, Chicago, IL 60654
$-1,420
Cash flow
-19.8%
Cash-on-Cash Return
1.1%
Cap rate
0.7%
Rent to Value Ratio
Active
$374,900
2
bds
|
2
ba
|
1,100
sqft
|
built
2005
330 W Grand Ave, Chicago, IL 60654
$-960
Cash flow
-13.4%
Cash-on-Cash Return
2.6%
Cap rate
0.8%
Rent to Value Ratio
Active
$475,000
2
bds
|
2
ba
|
0
sqft
|
built
2000
400 W Ontario St, Chicago, IL 60654
$-2,169
Cash flow
-23.8%
Cash-on-Cash Return
0.2%
Cap rate
0.5%
Rent to Value Ratio
Active
$349,900
1
bds
|
2
ba
|
930
sqft
|
built
2002
645 N Kingsbury St, Chicago, IL 60654
$-1,036
Cash flow
-15.4%
Cash-on-Cash Return
2.1%
Cap rate
0.8%
Rent to Value Ratio
Active
$330,000
1
bds
|
1
ba
|
860
sqft
|
built
2001
345 N La Salle Dr, Chicago, IL 60654
$-837
Cash flow
-13.2%
Cash-on-Cash Return
2.6%
Cap rate
0.8%
Rent to Value Ratio
Active
$299,000
1
bds
|
1
ba
|
877
sqft
|
built
2005
330 W Grand Ave, Chicago, IL 60654
$-782
Cash flow
-13.6%
Cash-on-Cash Return
2.5%
Cap rate
0.8%
Rent to Value Ratio
Active
$595,000
3
bds
|
2
ba
|
0
sqft
|
built
1920
758 N Larrabee St, Chicago, IL 60654
$-2,407
Cash flow
-21.1%
Cash-on-Cash Return
0.8%
Cap rate
0.5%
Rent to Value Ratio
Active
$535,000
2
bds
|
2
ba
|
1,300
sqft
|
built
2009
303 W Ohio St, Chicago, IL 60654
$-2,126
Cash flow
-20.7%
Cash-on-Cash Return
0.9%
Cap rate
0.5%
Rent to Value Ratio
Active
$325,000
1
bds
|
1
ba
|
0
sqft
|
built
2006
700 N Larrabee St, Chicago, IL 60654
$-781
Cash flow
-12.5%
Cash-on-Cash Return
2.8%
Cap rate
0.9%
Rent to Value Ratio
Active
$1,679,999
3
bds
|
3
ba
|
2,320
sqft
|
built
2020
366 W Superior St, Chicago, IL 60654
$-6,963
Cash flow
-21.6%
Cash-on-Cash Return
0.7%
Cap rate
0.5%
Rent to Value Ratio
Active
$650,000
2
bds
|
2
ba
|
1,404
sqft
|
built
2009
110 W Superior St, Chicago, IL 60654
$-2,889
Cash flow
-23.2%
Cash-on-Cash Return
0.3%
Cap rate
0.5%
Rent to Value Ratio