60661 Investment Properties for Sale
Browse homes for sale and investment properties in 60661. Refine your search by price, property type, or more.
Best cash flowing properties in 60661
Active
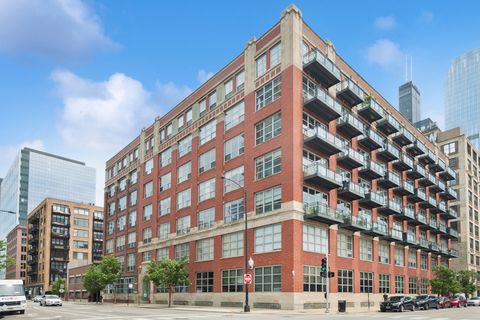
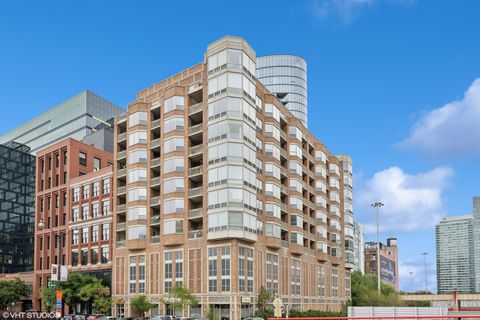
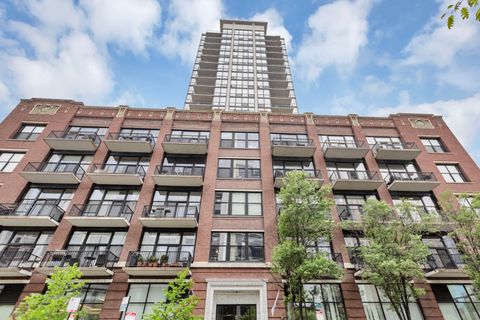
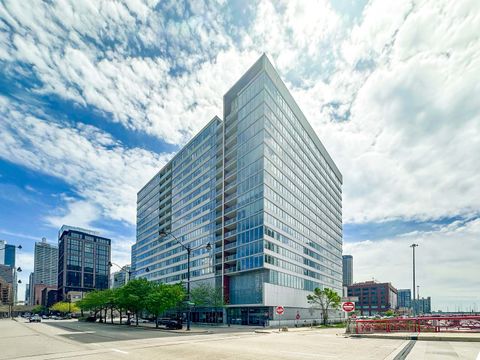
$320,000
1
bds
|
1
ba
|
1,050
sqft
|
built
2003
333 S Desplaines St, Chicago, IL 60661
$-599
Cash flow
-9.8%
Cash-on-Cash Return
3.4%
Cap rate
0.9%
Rent to Value Ratio

Active
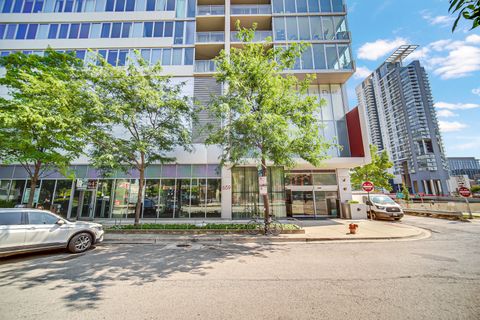
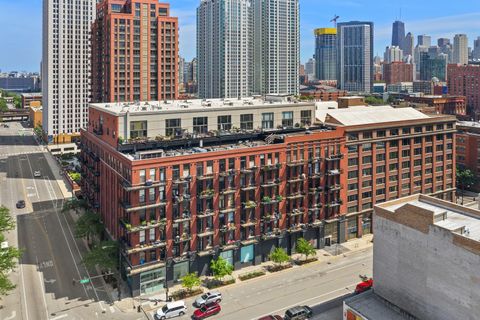
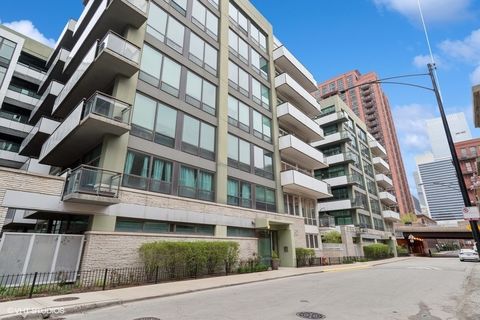
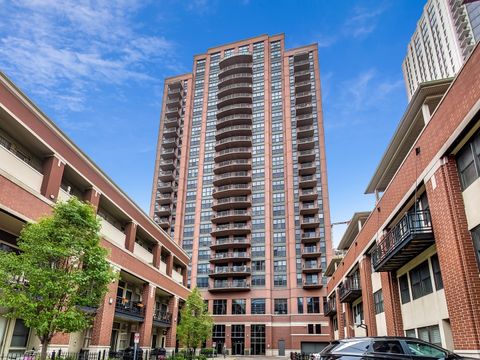
$389,000
1
bds
|
2
ba
|
900
sqft
|
built
1999
333 N Jefferson St, Chicago, IL 60661
$-602
Cash flow
-8.1%
Cash-on-Cash Return
3.8%
Cap rate
0.8%
Rent to Value Ratio
19 out of 23 properties for sale in 60661
Limited Results Shown
Create a free account, or log in to reveal all property listings and enjoy the complete experience.
Active
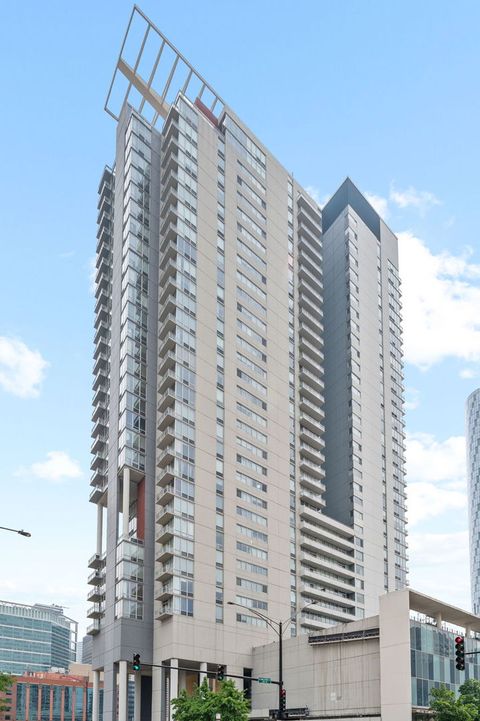
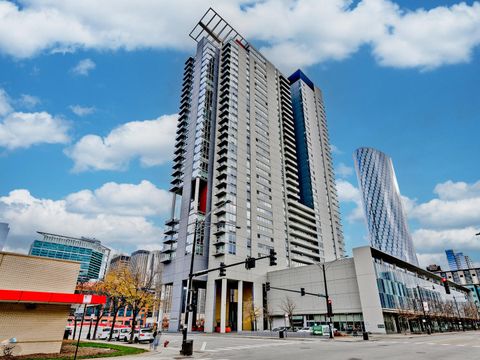
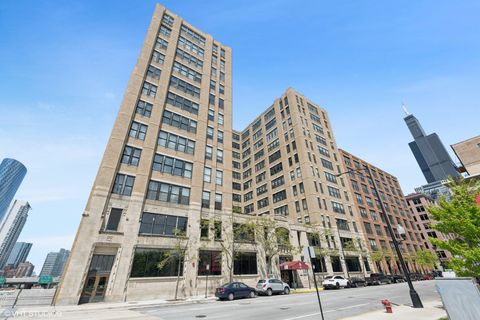
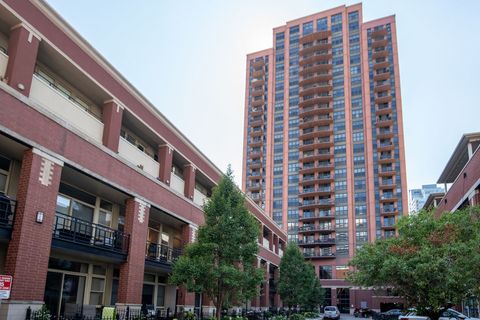
$440,000
2
bds
|
2
ba
|
1,200
sqft
|
built
2008
659 W Randolph St, Chicago, IL 60661
$-1,688
Cash flow
-20.0%
Cash-on-Cash Return
1.1%
Cap rate
0.7%
Rent to Value Ratio
Active
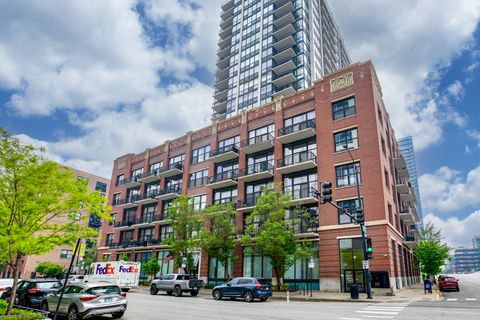
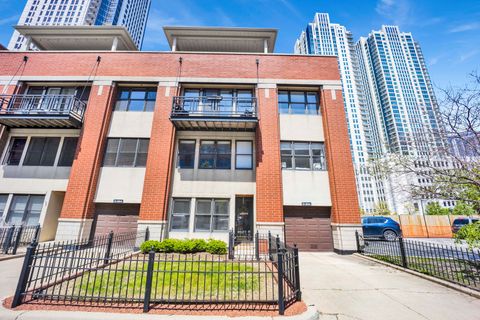
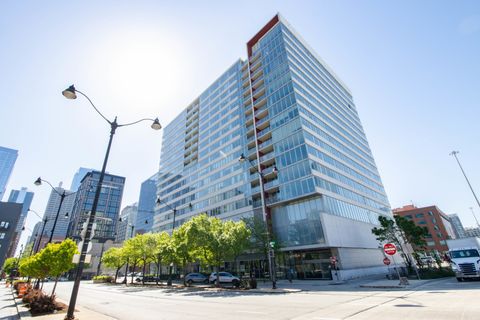
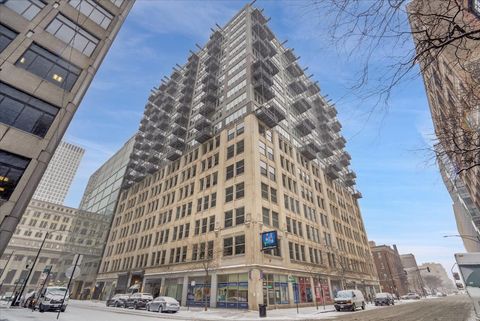
$375,000
1
bds
|
1
ba
|
975
sqft
|
built
2003
737 W Washington Blvd, Chicago, IL 60661
$-1,401
Cash flow
-19.5%
Cash-on-Cash Return
1.2%
Cap rate
0.7%
Rent to Value Ratio
Active
$359,000
1
bds
|
2
ba
|
0
sqft
|
built
2004
210 S Desplaines St, Chicago, IL 60661
$-1,241
Cash flow
-18.0%
Cash-on-Cash Return
2.1%
Cap rate
0.7%
Rent to Value Ratio
Active
$565,000
2
bds
|
2
ba
|
1,500
sqft
|
built
2003
720 W Randolph St, Chicago, IL 60661
$-2,769
Cash flow
-25.6%
Cash-on-Cash Return
0.4%
Cap rate
0.4%
Rent to Value Ratio
Active
$570,000
2
bds
|
2
ba
|
0
sqft
|
built
1881
616 W Fulton St, Chicago, IL 60661
$-1,986
Cash flow
-18.2%
Cash-on-Cash Return
1.5%
Cap rate
0.5%
Rent to Value Ratio
Active
$669,000
2
bds
|
3
ba
|
1,512
sqft
|
built
2004
737 W Washington Blvd, Chicago, IL 60661
$-2,468
Cash flow
-19.2%
Cash-on-Cash Return
1.3%
Cap rate
0.7%
Rent to Value Ratio
Active
$875,000
3
bds
|
3
ba
|
2,600
sqft
|
built
2004
334 N Jefferson St, Chicago, IL 60661
$-1,657
Cash flow
-9.9%
Cash-on-Cash Return
3.4%
Cap rate
0.7%
Rent to Value Ratio

Active
$468,000
2
bds
|
2
ba
|
0
sqft
|
built
2009
565 W Quincy St, Chicago, IL 60661
$-1,464
Cash flow
-16.3%
Cash-on-Cash Return
1.9%
Cap rate
0.7%
Rent to Value Ratio

Active
$650,000
2
bds
|
2
ba
|
1,739
sqft
|
built
2003
737 W Washington Blvd, Chicago, IL 60661
$-2,979
Cash flow
-23.9%
Cash-on-Cash Return
0.2%
Cap rate
0.8%
Rent to Value Ratio
Active
$500,000
2
bds
|
2
ba
|
1,250
sqft
|
built
2005
210 S Desplaines St, Chicago, IL 60661
$-1,141
Cash flow
-11.9%
Cash-on-Cash Return
2.9%
Cap rate
0.7%
Rent to Value Ratio
Active
$530,000
2
bds
|
2
ba
|
1,250
sqft
|
built
2008
660 W Wayman St, Chicago, IL 60661
$-1,520
Cash flow
-15.0%
Cash-on-Cash Return
2.2%
Cap rate
0.7%
Rent to Value Ratio
Active
$420,000
2
bds
|
2
ba
|
1,385
sqft
|
built
1894
728 W Jackson Blvd, Chicago, IL 60661
$-903
Cash flow
-11.2%
Cash-on-Cash Return
3.1%
Cap rate
0.9%
Rent to Value Ratio
Active
$299,000
1
bds
|
1
ba
|
826
sqft
|
built
2008
659 W Randolph St, Chicago, IL 60661
$-940
Cash flow
-16.4%
Cash-on-Cash Return
1.9%
Cap rate
0.9%
Rent to Value Ratio
Active
$299,995
1
bds
|
1
ba
|
840
sqft
|
built
2009
659 W Randolph St, Chicago, IL 60661
$-763
Cash flow
-13.3%
Cash-on-Cash Return
2.6%
Cap rate
0.9%
Rent to Value Ratio
Active
$335,000
1
bds
|
1
ba
|
875
sqft
|
built
2000
330 N Jefferson St, Chicago, IL 60661
$-1,155
Cash flow
-18.0%
Cash-on-Cash Return
1.5%
Cap rate
0.8%
Rent to Value Ratio
Active
$355,000
1
bds
|
1
ba
|
857
sqft
|
built
2001
330 N Jefferson St, Chicago, IL 60661
$-982
Cash flow
-14.4%
Cash-on-Cash Return
2.4%
Cap rate
0.8%
Rent to Value Ratio
Active
$425,000
2
bds
|
2
ba
|
1,280
sqft
|
built
2010
565 W Quincy St, Chicago, IL 60661
$-1,020
Cash flow
-12.5%
Cash-on-Cash Return
2.8%
Cap rate
0.8%
Rent to Value Ratio