61021 Investment Properties for Sale
Browse homes for sale and investment properties in 61021. Refine your search by price, property type, or more.
Best cash flowing properties in 61021
Active
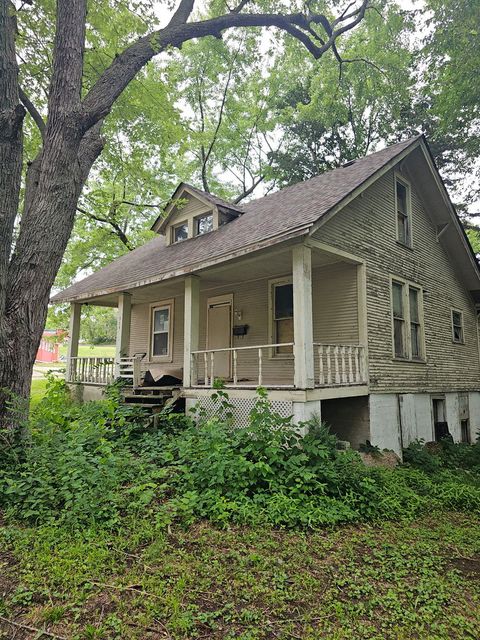
$37,900
3
bds
|
1
ba
|
1,080
sqft
|
built
1910
904 Walnut Ave, Dixon, IL 61021
$690
Cash flow
21.2%
Cash-on-Cash Return
21.8%
Cap rate
3.2%
Rent to Value Ratio
Active
$69,000
2
bds
|
1
ba
|
516
sqft
|
built
1941
1323 Woodlawn St, Dixon, IL 61021
$634
Cash flow
10.7%
Cash-on-Cash Return
11.0%
Cap rate
1.6%
Rent to Value Ratio
18 out of 20 properties for sale in 61021
Limited Results Shown
Create a free account, or log in to reveal all property listings and enjoy the complete experience.
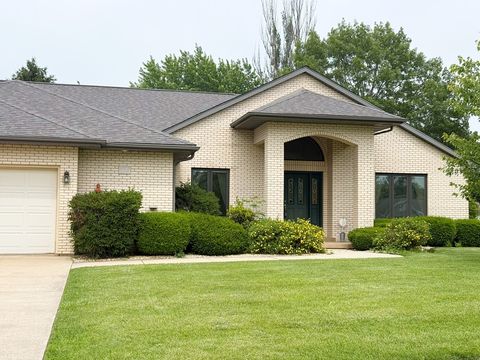
Active
$365,000
2
bds
|
3
ba
|
1,532
sqft
|
built
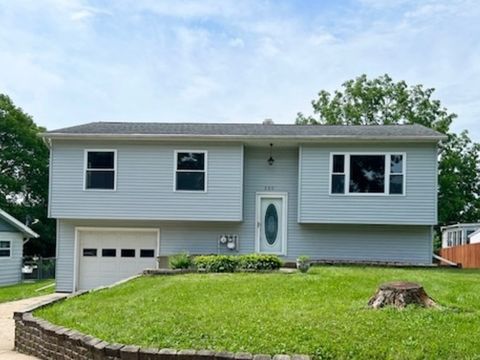
2021
705 Yingling Dr, Dixon, IL 61021
$-1,114
Cash flow
-15.9%
Cash-on-Cash Return
2.0%
Cap rate
0.5%
Rent to Value Ratio
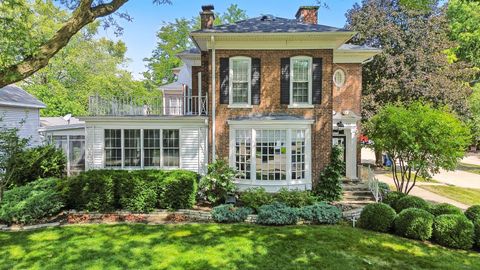
Active
$449,900
4
bds
|
4
ba
|
4,080
sqft
|
built
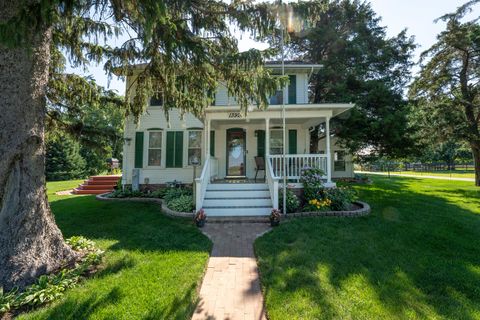
1861
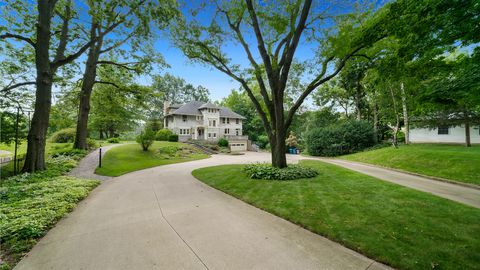
223 E Boyd St, Dixon, IL 61021
$-1,063
Cash flow
-12.3%
Cash-on-Cash Return
2.8%
Cap rate
0.6%
Rent to Value Ratio
Active
$839,900
5
bds
|
3
ba
|
4,594
sqft
|
built
2011
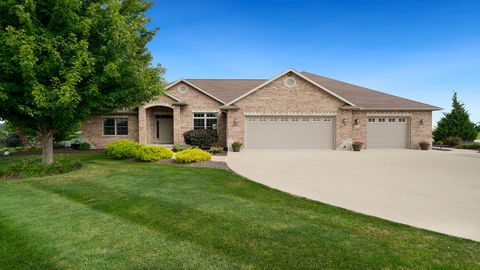
1815 White Pines Dr, Dixon, IL 61021
$-3,190
Cash flow
-19.8%
Cash-on-Cash Return
1.1%
Cap rate
0.3%
Rent to Value Ratio
Active
$469,000
4
bds
|
2
ba
|
2,470
sqft
|
built
1915
706 E Fellows St, Dixon, IL 61021
$-1,346
Cash flow
-15.0%
Cash-on-Cash Return
2.2%
Cap rate
0.5%
Rent to Value Ratio
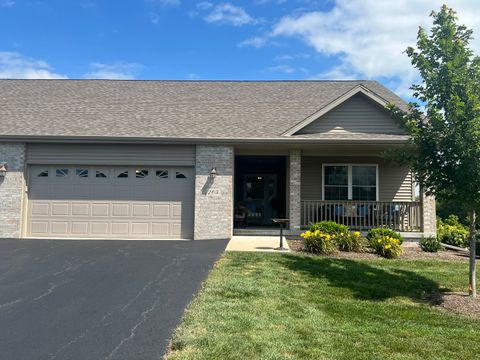
Active
$279,000
2
bds
|
3
ba
|
1,348
sqft
|
built
2007
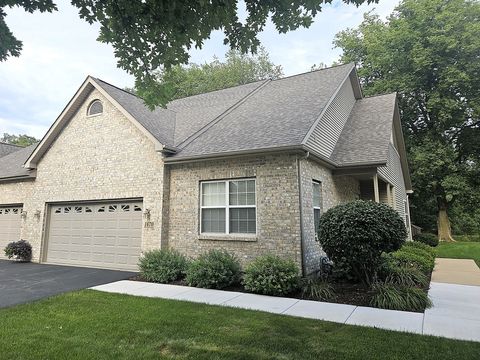
1670 Overlook Dr, Dixon, IL 61021
$-532
Cash flow
-9.9%
Cash-on-Cash Return
3.4%
Cap rate
0.6%
Rent to Value Ratio
Active
$419,000
3
bds
|
4
ba
|
2,231
sqft
|
built
2004
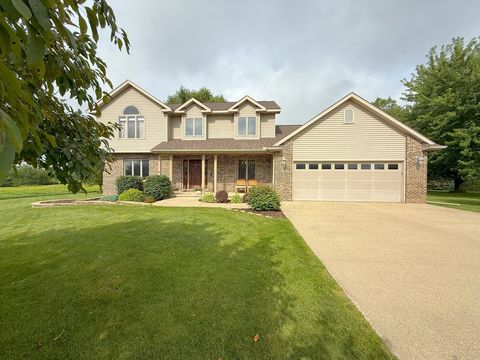
1803 White Pines Dr, Dixon, IL 61021
$-674
Cash flow
-8.4%
Cash-on-Cash Return
3.7%
Cap rate
0.7%
Rent to Value Ratio
Active
$389,900
3
bds
|
3
ba
|
2,754
sqft
|
built
1993
132 Fox Trot, Dixon, IL 61021
$-886
Cash flow
-11.9%
Cash-on-Cash Return
3.0%
Cap rate
0.7%
Rent to Value Ratio
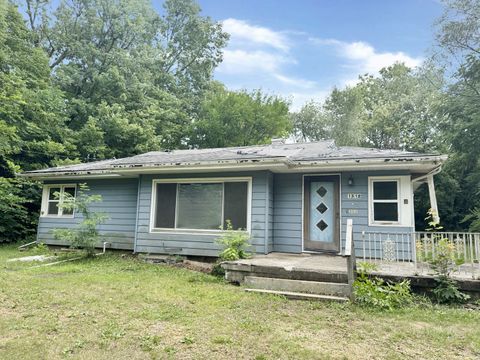
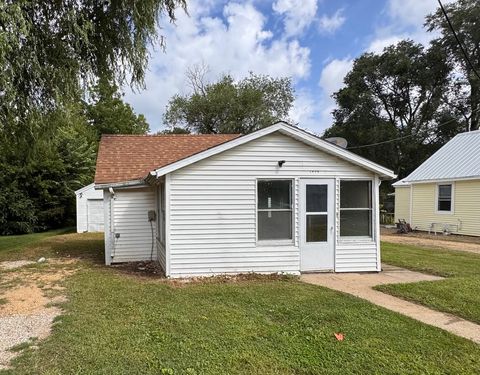
Active
$34,950
3
bds
|
1
ba
|
1,036
sqft
|
built
1960
1312 Christiana Ter, Dixon, IL 61021
$622
Cash flow
20.7%
Cash-on-Cash Return
21.4%
Cap rate
3.1%
Rent to Value Ratio
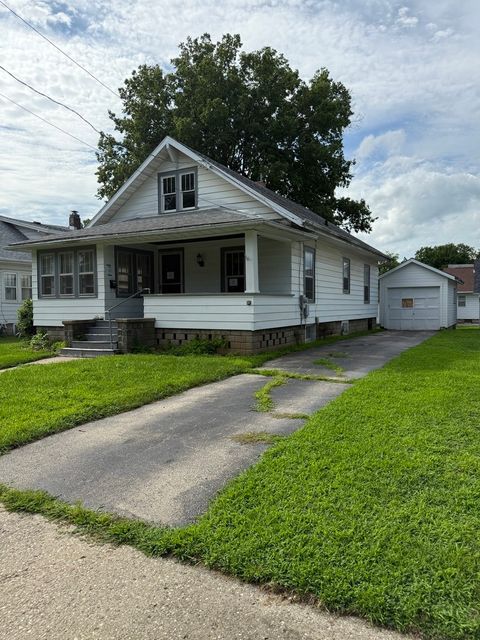
Active
$85,000
2
bds
|
1
ba
|
1,016
sqft
|
built
1926
1707 W 3rd St, Dixon, IL 61021
$195
Cash flow
12.0%
Cash-on-Cash Return
8.4%
Cap rate
1.3%
Rent to Value Ratio
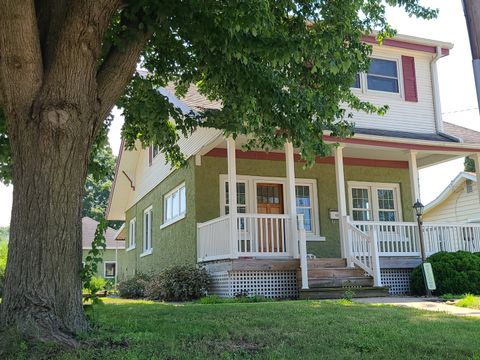
Active
$175,000
3
bds
|
3
ba
|
1,386
sqft
|
built
1925
1902 W 1st St, Dixon, IL 61021
$80
Cash flow
2.4%
Cash-on-Cash Return
6.2%
Cap rate
1.0%
Rent to Value Ratio
Active
$597,500
3
bds
|
2
ba
|
2,224
sqft
|
built
1880
1392 Red Brick Rd, Dixon, IL 61021
$-1,932
Cash flow
-16.9%
Cash-on-Cash Return
1.8%
Cap rate
0.3%
Rent to Value Ratio
Active
$224,900
3
bds
|
2
ba
|
1,610
sqft
|
built
1963
320 Prospect St, Dixon, IL 61021
$-268
Cash flow
-6.2%
Cash-on-Cash Return
4.2%
Cap rate
0.8%
Rent to Value Ratio
Active
$249,000
3
bds
|
3
ba
|
2,502
sqft
|
built
1895
322 Crawford Ave, Dixon, IL 61021
$-86
Cash flow
-1.8%
Cash-on-Cash Return
5.3%
Cap rate
1.0%
Rent to Value Ratio

Active
$339,000
5
bds
|
3
ba
|
2,718
sqft
|
built
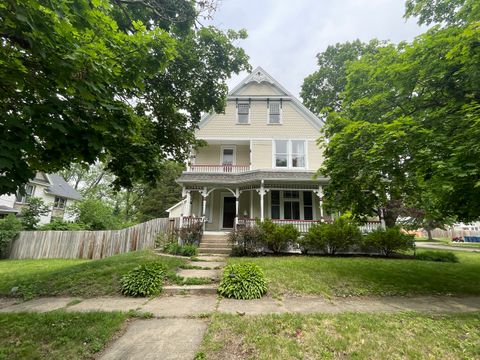
1881
321 E Chamberlin St, Dixon, IL 61021
$-682
Cash flow
-10.5%
Cash-on-Cash Return
3.3%
Cap rate
0.6%
Rent to Value Ratio
Active
$35,000
2
bds
|
1
ba
|
1,008
sqft
|
built
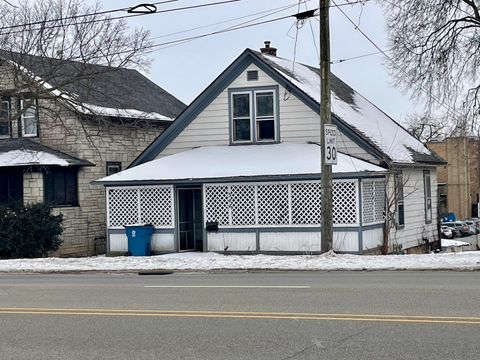
1881
344 W Everett St, Dixon, IL 61021
$497
Cash flow
16.5%
Cash-on-Cash Return
17.0%
Cap rate
2.6%
Rent to Value Ratio
Active
$119,000
6
bds
|
2
ba
|
0
sqft
|
built
1860
109 E Chamberlin St, Dixon, IL 61021
$449
Cash flow
19.7%
Cash-on-Cash Return
10.2%
Cap rate
1.5%
Rent to Value Ratio