61081 Investment Properties for Sale
Browse homes for sale and investment properties in 61081. Refine your search by price, property type, or more.
Best cash flowing properties in 61081
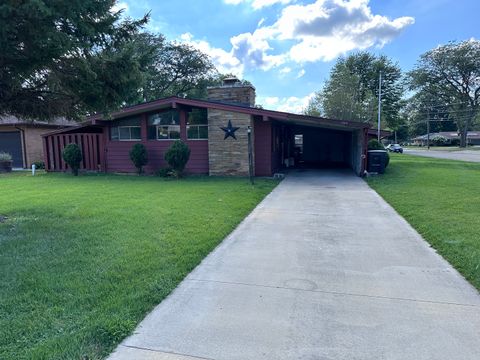
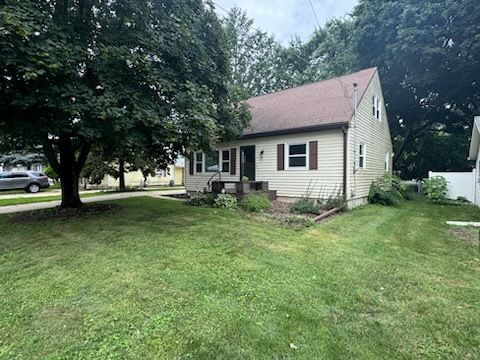
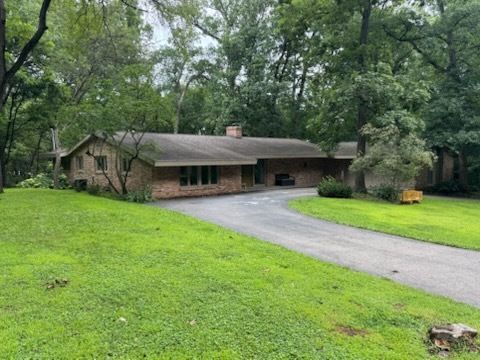
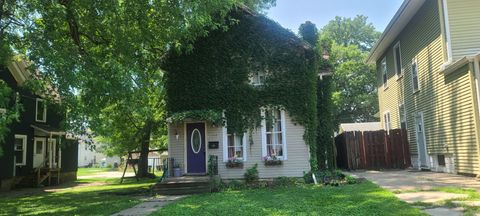
Active
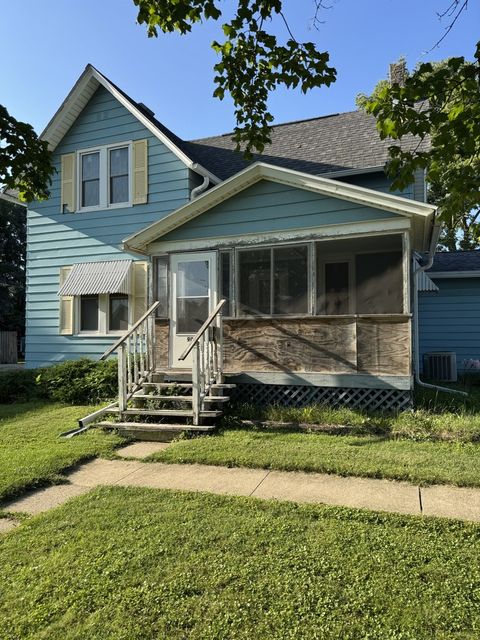
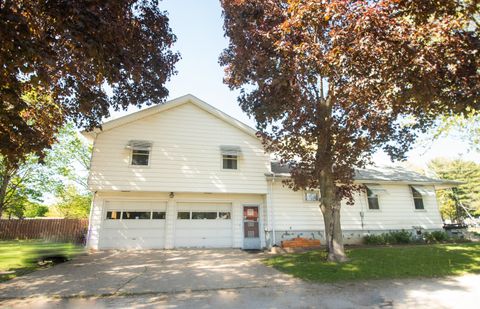
$68,900
4
bds
|
2
ba
|
1,529
sqft
|
built
1970
903 W 7th St, Sterling, IL 61081
$770
Cash flow
13.0%
Cash-on-Cash Return
13.4%
Cap rate
1.9%
Rent to Value Ratio
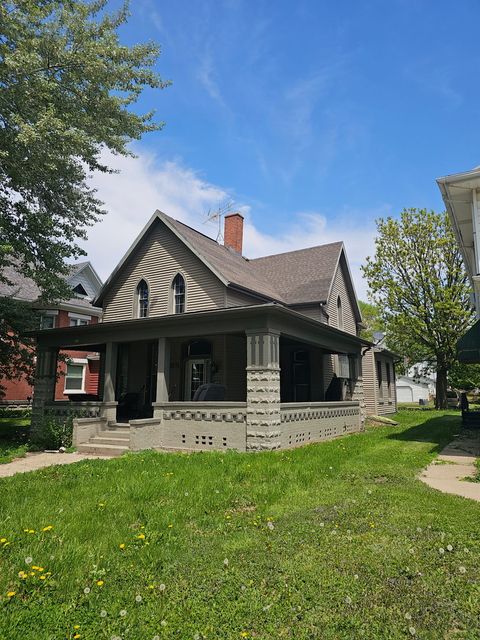
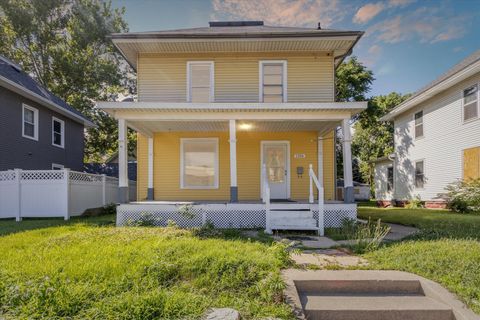
Active
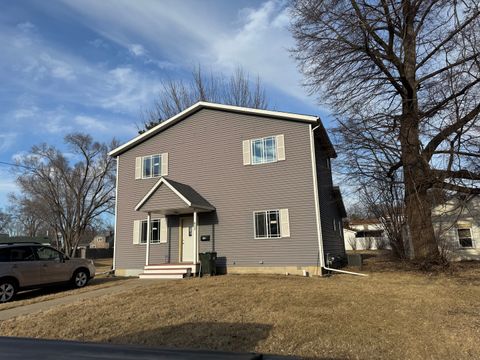
$74,900
3
bds
|
1
ba
|
1,728
sqft
|
built
1900
2203 Deets Rd, Sterling, IL 61081
$742
Cash flow
11.5%
Cash-on-Cash Return
11.9%
Cap rate
1.7%
Rent to Value Ratio
27 out of 28 properties for sale in 61081
Limited Results Shown
Create a free account, or log in to reveal all property listings and enjoy the complete experience.
Active
$93,000
2
bds
|
1
ba
|
811
sqft
|
built
1950
1111 Avenue J, Sterling, IL 61081
$194
Cash flow
10.9%
Cash-on-Cash Return
8.2%
Cap rate
1.3%
Rent to Value Ratio
Active
$105,000
4
bds
|
2
ba
|
1,460
sqft
|
built
1900
505 6th Ave, Sterling, IL 61081
$332
Cash flow
16.5%
Cash-on-Cash Return
9.5%
Cap rate
1.4%
Rent to Value Ratio
Active
$95,000
3
bds
|
1
ba
|
1,174
sqft
|
built
1957
1723 Avenue D, Sterling, IL 61081
$170
Cash flow
9.3%
Cash-on-Cash Return
7.8%
Cap rate
1.5%
Rent to Value Ratio
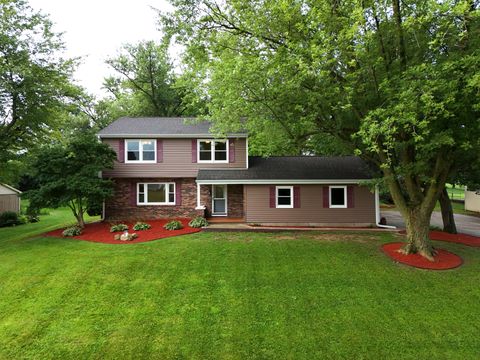
Active
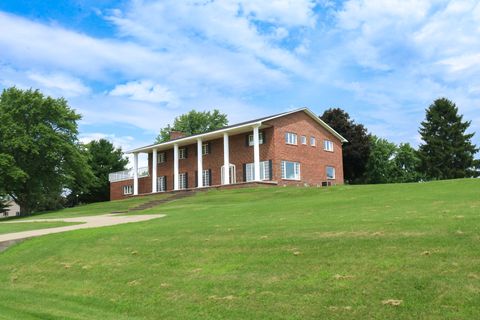
$339,900
3
bds
|
3
ba
|
2,144
sqft
|
built
1974
24049 Hillcrest Dr, Sterling, IL 61081
$-753
Cash flow
-11.6%
Cash-on-Cash Return
3.0%
Cap rate
0.5%
Rent to Value Ratio
Active
$125,000
3
bds
|
2
ba
|
1,459
sqft
|
built
1954
1610 W 9th St, Sterling, IL 61081
$217
Cash flow
9.1%
Cash-on-Cash Return
7.8%
Cap rate
1.0%
Rent to Value Ratio
Active
$145,000
3
bds
|
1
ba
|
1,140
sqft
|
built
1948
1716 17th Ave, Sterling, IL 61081
$110
Cash flow
4.0%
Cash-on-Cash Return
6.6%
Cap rate
1.0%
Rent to Value Ratio
Active
$164,900
4
bds
|
2
ba
|
1,425
sqft
|
built
1970
1827 2nd Ave, Sterling, IL 61081
$-103
Cash flow
-3.3%
Cash-on-Cash Return
4.9%
Cap rate
1.0%
Rent to Value Ratio
Active
$78,000
3
bds
|
2
ba
|
2,150
sqft
|
built
1890
608 2nd Ave, Sterling, IL 61081
$581
Cash flow
38.9%
Cash-on-Cash Return
14.6%
Cap rate
2.2%
Rent to Value Ratio
Active
$94,900
3
bds
|
1
ba
|
1,211
sqft
|
built
1938
1824 16th Ave, Sterling, IL 61081
$220
Cash flow
12.1%
Cash-on-Cash Return
8.5%
Cap rate
1.4%
Rent to Value Ratio
Active
$325,000
3
bds
|
2
ba
|
2,040
sqft
|
built
1960
24455 Fulfs Rd, Sterling, IL 61081
$-869
Cash flow
-14.0%
Cash-on-Cash Return
2.5%
Cap rate
0.5%
Rent to Value Ratio
Active
$272,500
3
bds
|
2
ba
|
1,914
sqft
|
built
1960
17150 Timber Dr, Sterling, IL 61081
$-527
Cash flow
-10.1%
Cash-on-Cash Return
3.4%
Cap rate
0.7%
Rent to Value Ratio
Active
$225,000
4
bds
|
2
ba
|
1,872
sqft
|
built
1946
4404 Emerson Rd, Sterling, IL 61081
$-260
Cash flow
-6.0%
Cash-on-Cash Return
4.3%
Cap rate
0.6%
Rent to Value Ratio

Active
$85,000
4
bds
|
2
ba
|
1,800
sqft
|
built
1920
721 Broadway Ave, Sterling, IL 61081
$319
Cash flow
19.6%
Cash-on-Cash Return
10.2%
Cap rate
1.5%
Rent to Value Ratio
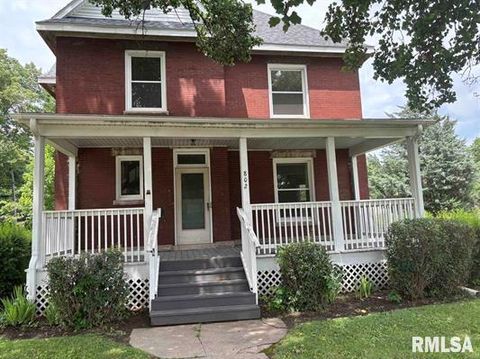
Active
$225,000
5
bds
|
2
ba
|
2,732
sqft
|
built
1821
802 W 4th St, Sterling, IL 61081
$288
Cash flow
6.7%
Cash-on-Cash Return
7.2%
Cap rate
1.0%
Rent to Value Ratio
Active
$689,000
4
bds
|
3
ba
|
3,100
sqft
|
built
1981
1606 Gregden Shores Dr, Sterling, IL 61081
$-2,073
Cash flow
-15.7%
Cash-on-Cash Return
2.1%
Cap rate
0.4%
Rent to Value Ratio
Active
$106,500
3
bds
|
1
ba
|
1,970
sqft
|
built
1900
109 6th Ave, Sterling, IL 61081
$249
Cash flow
12.2%
Cash-on-Cash Return
8.5%
Cap rate
1.2%
Rent to Value Ratio
Active
$105,000
3
bds
|
3
ba
|
1,800
sqft
|
built
1932
1304 E 4th St, Sterling, IL 61081
$271
Cash flow
13.5%
Cash-on-Cash Return
8.8%
Cap rate
1.2%
Rent to Value Ratio
Active
$77,500
2
bds
|
1
ba
|
832
sqft
|
built
1923
610 1/2 W 7th St, Sterling, IL 61081
$153
Cash flow
10.3%
Cash-on-Cash Return
8.1%
Cap rate
1.4%
Rent to Value Ratio
Active
$98,000
3
bds
|
1
ba
|
1,636
sqft
|
built
1908
603 7th Ave, Sterling, IL 61081
$312
Cash flow
16.6%
Cash-on-Cash Return
9.5%
Cap rate
1.3%
Rent to Value Ratio
Active
$146,000
3
bds
|
2
ba
|
1,915
sqft
|
built
1948
1807 3rd Ave, Sterling, IL 61081
$258
Cash flow
9.2%
Cash-on-Cash Return
7.8%
Cap rate
1.2%
Rent to Value Ratio
Active
$199,900
4
bds
|
3
ba
|
1,818
sqft
|
built
612 15th Ave, Sterling, IL 61081
$-7
Cash flow
-0.2%
Cash-on-Cash Return
5.6%
Cap rate
0.9%
Rent to Value Ratio
Active
$569,387
5
bds
|
6
ba
|
5,600
sqft
|
built
1980
3900 Pine Hill Rd, Sterling, IL 61081
$-1,229
Cash flow
-11.3%
Cash-on-Cash Return
3.1%
Cap rate
0.6%
Rent to Value Ratio
Active
$418,500
5
bds
|
3
ba
|
3,365
sqft
|
built
1973
17421 Timber Dr, Sterling, IL 61081
$-231
Cash flow
-2.9%
Cash-on-Cash Return
5.0%
Cap rate
0.8%
Rent to Value Ratio
Active
$925,000
4
bds
|
4
ba
|
5,168
sqft
|
built
1999
17619 Grandview Dr, Sterling, IL 61081
$-2,710
Cash flow
-15.3%
Cash-on-Cash Return
2.2%
Cap rate
0.4%
Rent to Value Ratio
Active
$457,500
6
bds
|
5
ba
|
3,984
sqft
|
built
1997
1275 Winn Rd, Sterling, IL 61081
$-373
Cash flow
-4.3%
Cash-on-Cash Return
4.7%
Cap rate
0.7%
Rent to Value Ratio