61103 Investment Properties for Sale
Browse homes for sale and investment properties in 61103. Refine your search by price, property type, or more.
Best cash flowing properties in 61103
Active
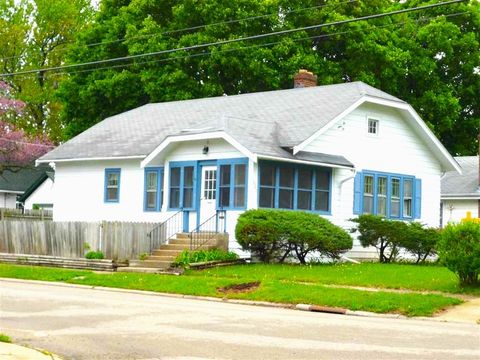
$124,900
3
bds
|
1
ba
|
1,355
sqft
|
built
1939
1602 Price St, Rockford, IL 61103
$387
Cash flow
16.2%
Cash-on-Cash Return
9.4%
Cap rate
1.4%
Rent to Value Ratio
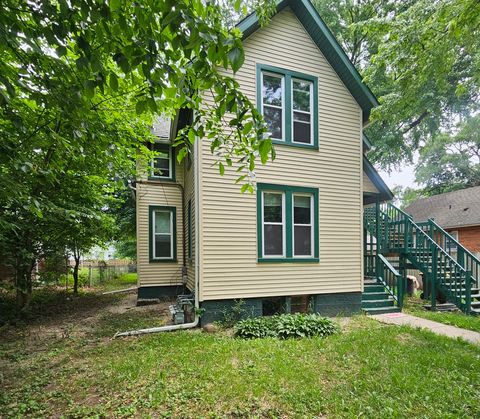
Active
$135,000
3
bds
|
2
ba
|
0
sqft
|
built
1914
2217 Latham St, Rockford, IL 61103
$343
Cash flow
13.3%
Cash-on-Cash Return
8.7%
Cap rate
1.2%
Rent to Value Ratio
7 out of 8 properties for sale in 61103
Limited Results Shown
Create a free account, or log in to reveal all property listings and enjoy the complete experience.
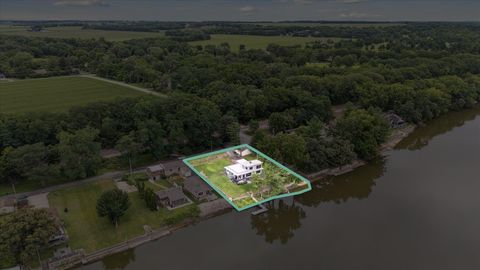
Active
$529,000
3
bds
|
2
ba
|
2,500
sqft
|
built
1950
8239 Beach Dr, Rockford, IL 61103
$-1,010
Cash flow
-10.0%
Cash-on-Cash Return
3.4%
Cap rate
0.5%
Rent to Value Ratio
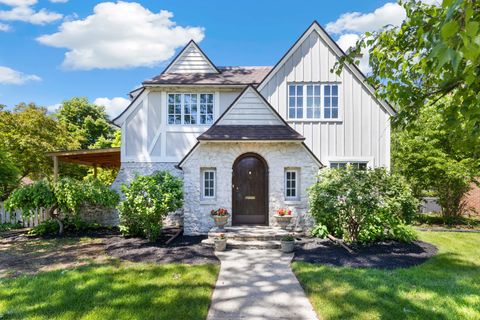
Active
$459,900
5
bds
|
5
ba
|
4,668
sqft
|
built
1928
2412 Harlem Blvd, Rockford, IL 61103
$-955
Cash flow
-10.8%
Cash-on-Cash Return
3.7%
Cap rate
0.8%
Rent to Value Ratio
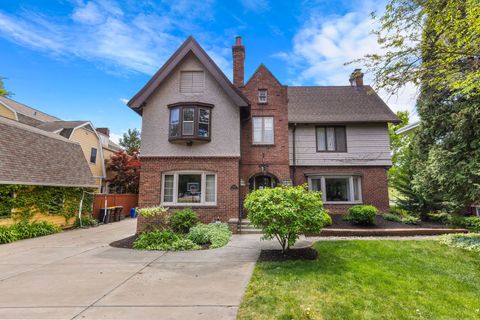
Active
$599,900
3
bds
|
4
ba
|
3,021
sqft
|
built
2005
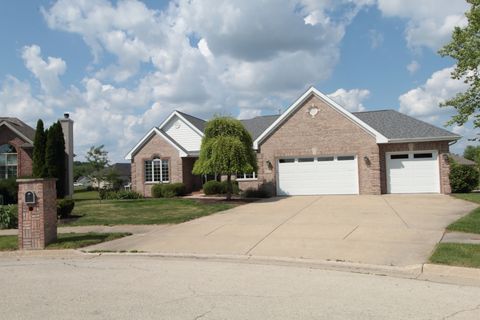
1288 Key Largo Ct, Machesney Park, IL 61103
$-2,668
Cash flow
-23.2%
Cash-on-Cash Return
0.3%
Cap rate
0.4%
Rent to Value Ratio
Active
$499,900
4
bds
|
5
ba
|
5,120
sqft
|
built
1909
1704 National Ave, Rockford, IL 61103
$-1,221
Cash flow
-12.7%
Cash-on-Cash Return
2.7%
Cap rate
0.7%
Rent to Value Ratio
Active
$629,900
5
bds
|
6
ba
|
5,367
sqft
|
built
1907
1419 National Ave, Rockford, IL 61103
$-1,037
Cash flow
-8.6%
Cash-on-Cash Return
3.7%
Cap rate
0.7%
Rent to Value Ratio