61615 Investment Properties for Sale
Browse homes for sale and investment properties in 61615. Refine your search by price, property type, or more.
Best cash flowing properties in 61615
Active
$69,500
3
bds
|
0
ba
|
1,108
sqft
|
built
1949
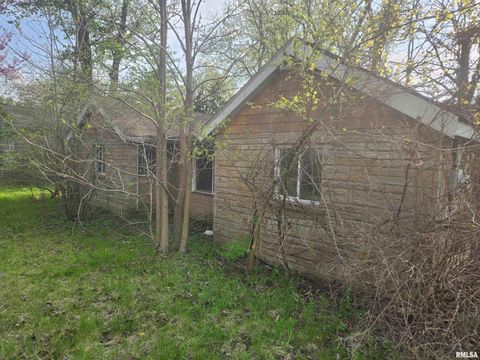
9915 N Blacksoil Ln, Peoria, IL 61615
$1,033
Cash flow
17.3%
Cash-on-Cash Return
17.8%
Cap rate
2.3%
Rent to Value Ratio

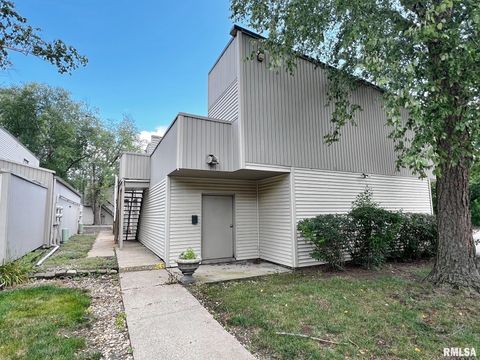
Active
$69,900
2
bds
|
1
ba
|
912
sqft
|
built
1963
3201 W Sylvan Ln, Peoria, IL 61615
$656
Cash flow
10.9%
Cash-on-Cash Return
11.3%
Cap rate
1.9%
Rent to Value Ratio
18 out of 20 properties for sale in 61615
Limited Results Shown
Create a free account, or log in to reveal all property listings and enjoy the complete experience.
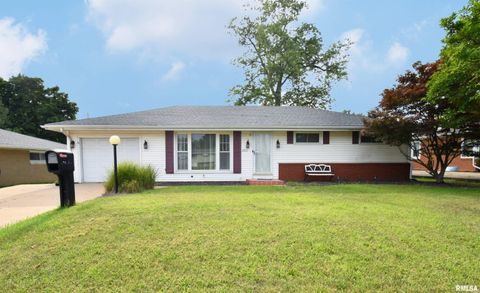
Active
$199,900
3
bds
|
3
ba
|
1,748
sqft
|
built
1961
2301 W Wagner Ln, Peoria, IL 61615
$84
Cash flow
2.2%
Cash-on-Cash Return
6.2%
Cap rate
0.9%
Rent to Value Ratio
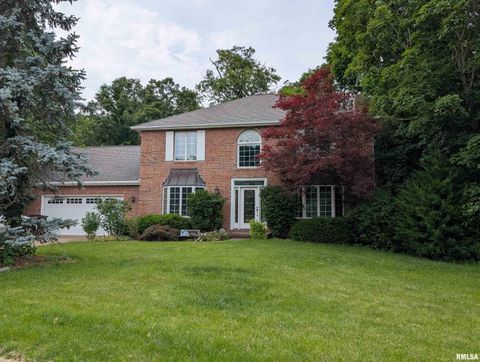
Active
$159,900
4
bds
|
4
ba
|
2,904
sqft
|
built
1974
4327 W Tara Cir, Peoria, IL 61615
$238
Cash flow
7.8%
Cash-on-Cash Return
7.5%
Cap rate
1.3%
Rent to Value Ratio
Active
$750,000
5
bds
|
5
ba
|
5,909
sqft
|
built
2002
4904 N Deermeadow Dr, Peoria, IL 61615
$-3,035
Cash flow
-21.1%
Cash-on-Cash Return
0.8%
Cap rate
0.4%
Rent to Value Ratio
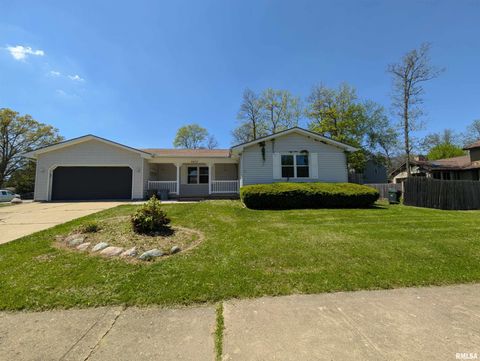
Active
$54,900
1
bds
|
1
ba
|
568
sqft
|
built
1976
6809 N Frostwood Pkwy, Peoria, IL 61615
$530
Cash flow
11.2%
Cash-on-Cash Return
11.6%
Cap rate
1.6%
Rent to Value Ratio
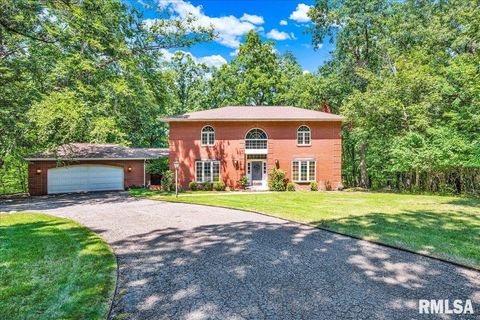
Active
$279,900
4
bds
|
3
ba
|
1,824
sqft
|
built
1976
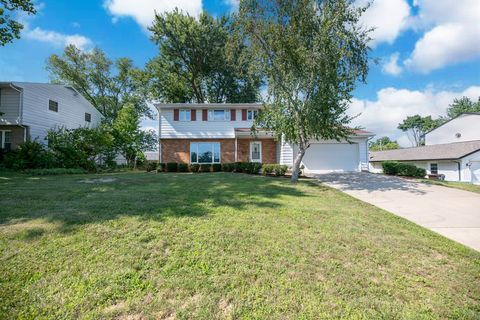
2922 W Larchmont Ln, Peoria, IL 61615
$-390
Cash flow
-7.3%
Cash-on-Cash Return
4.0%
Cap rate
0.6%
Rent to Value Ratio
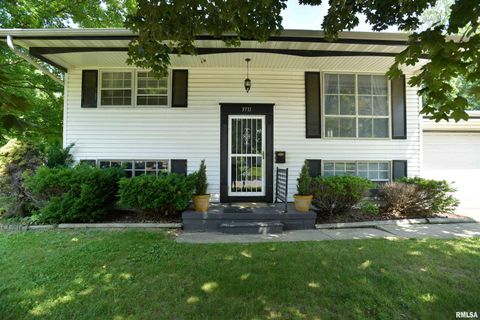
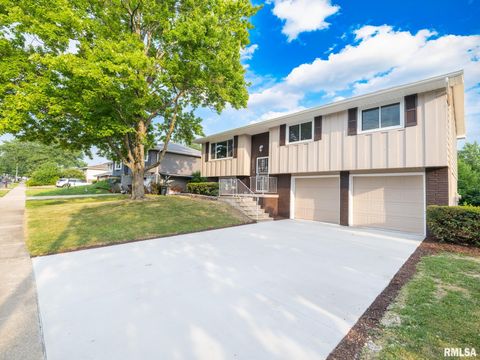
Active
$129,000
2
bds
|
1
ba
|
1,550
sqft
|
built
1968
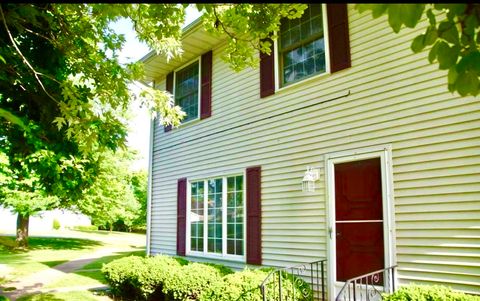
3711 W Creighton Ter, Peoria, IL 61615
$356
Cash flow
14.4%
Cash-on-Cash Return
9.0%
Cap rate
1.3%
Rent to Value Ratio
Active
$175,000
4
bds
|
2
ba
|
1,494
sqft
|
built
1975
2705 W Millbrook Ct, Peoria, IL 61615
$-249
Cash flow
-7.4%
Cash-on-Cash Return
4.0%
Cap rate
0.7%
Rent to Value Ratio

Active
$349,900
4
bds
|
4
ba
|
4,271
sqft
|
built
1989
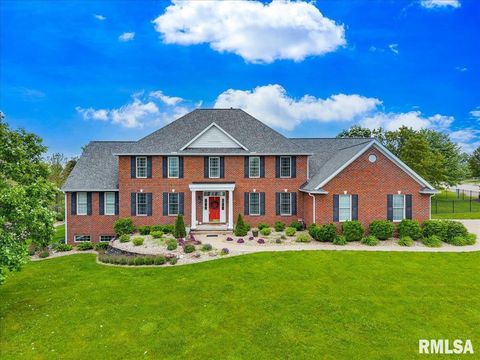
5405 W Teal Wood Ct, Peoria, IL 61615
$-575
Cash flow
-8.6%
Cash-on-Cash Return
3.7%
Cap rate
0.7%
Rent to Value Ratio
Active
$139,900
3
bds
|
2
ba
|
1,424
sqft
|
built
1955
3913 N Sterling Ave, Peoria, IL 61615
$277
Cash flow
10.3%
Cash-on-Cash Return
8.1%
Cap rate
1.1%
Rent to Value Ratio
Active
$494,000
4
bds
|
4
ba
|
3,425
sqft
|
built
1988
1315 W Wexford Pl, Peoria, IL 61615
$-1,256
Cash flow
-13.3%
Cash-on-Cash Return
2.6%
Cap rate
0.6%
Rent to Value Ratio

Active
$912,000
5
bds
|
6
ba
|
5,364
sqft
|
built
2007
3015 W Pilgrims Way, Peoria, IL 61615
$-4,336
Cash flow
-24.8%
Cash-on-Cash Return
0.0%
Cap rate
0.3%
Rent to Value Ratio
Active
$251,900
3
bds
|
2
ba
|
1,700
sqft
|
built
1977
6403 N Talisman Ter, Peoria, IL 61615
$-476
Cash flow
-9.9%
Cash-on-Cash Return
3.4%
Cap rate
0.7%
Rent to Value Ratio
Active
$622,222
3
bds
|
4
ba
|
5,516
sqft
|
built
1988
319 W Ravinwoods Rd, Peoria, IL 61615
$-2,417
Cash flow
-20.3%
Cash-on-Cash Return
1.0%
Cap rate
0.4%
Rent to Value Ratio

Active
$114,900
3
bds
|
1
ba
|
936
sqft
|
built
1957
2724 W Scenic Dr, Peoria, IL 61615
$130
Cash flow
5.9%
Cash-on-Cash Return
7.0%
Cap rate
1.1%
Rent to Value Ratio

Active
$659,900
5
bds
|
5
ba
|
6,141
sqft
|
built
1985
408 W Ravinwoods Rd, Peoria, IL 61615
$-2,764
Cash flow
-21.9%
Cash-on-Cash Return
0.7%
Cap rate
0.4%
Rent to Value Ratio
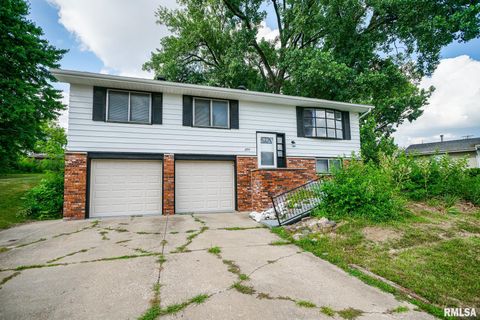
Active
$199,000
4
bds
|
3
ba
|
2,376
sqft
|
built
1959
3720 N Saint Michael Ave, Peoria, IL 61615
$-88
Cash flow
-2.3%
Cash-on-Cash Return
5.1%
Cap rate
0.9%
Rent to Value Ratio