61820 Investment Properties for Sale
Browse homes for sale and investment properties in 61820. Refine your search by price, property type, or more.
Best cash flowing properties in 61820
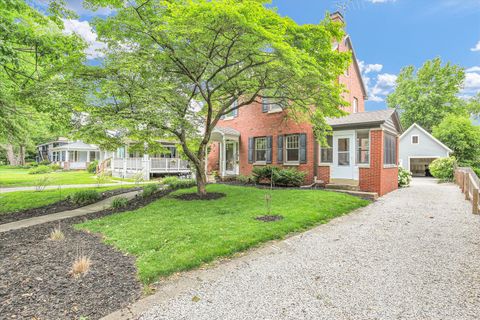
Active
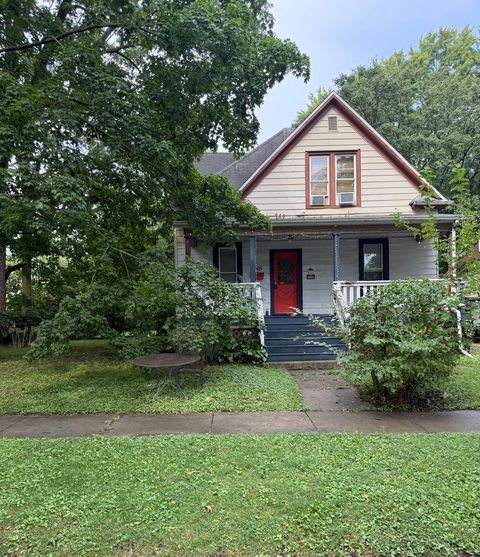
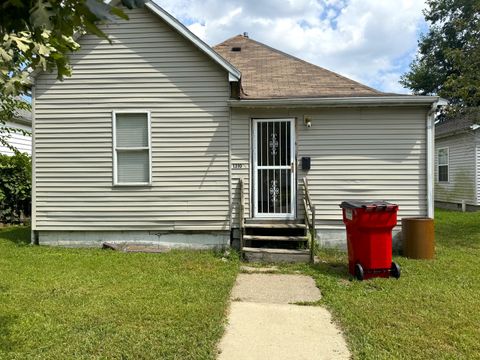
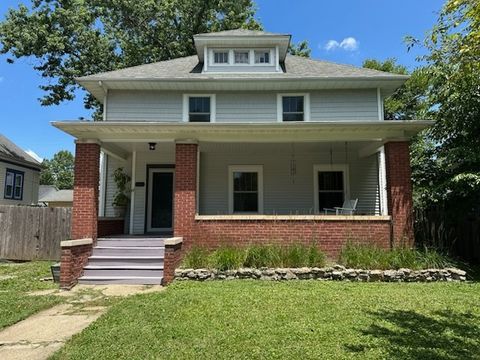
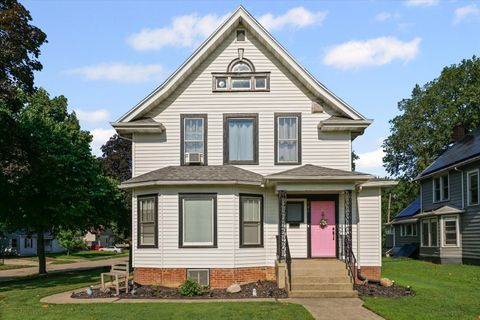
$150,000
4
bds
|
2
ba
|
1,500
sqft
|
built
1915
1305 N Walnut St, Champaign, IL 61820
$931
Cash flow
32.4%
Cash-on-Cash Return
13.1%
Cap rate
1.7%
Rent to Value Ratio
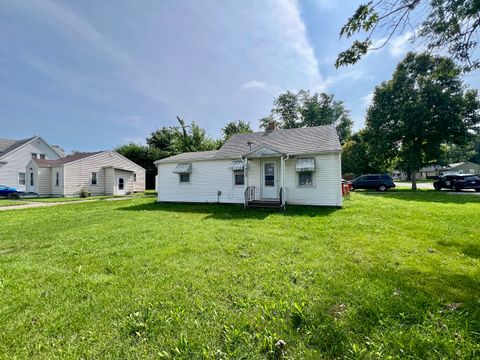
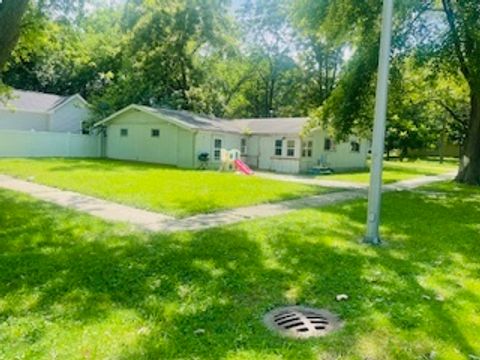
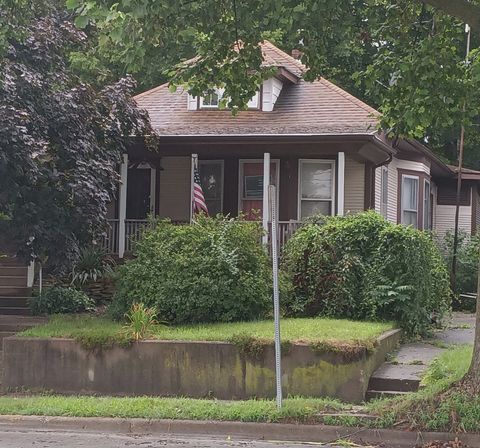
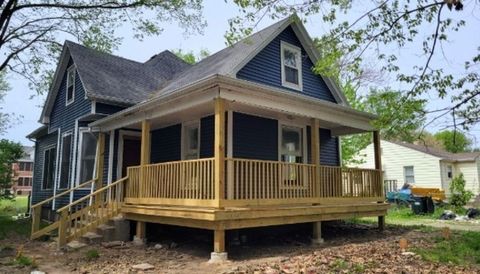
Active
$49,900
2
bds
|
1
ba
|
850
sqft
|
built
1940
1402 N Harris Ave, Champaign, IL 61820
$835
Cash flow
19.5%
Cash-on-Cash Return
20.1%
Cap rate
2.8%
Rent to Value Ratio
21 out of 25 properties for sale in 61820
Limited Results Shown
Create a free account, or log in to reveal all property listings and enjoy the complete experience.
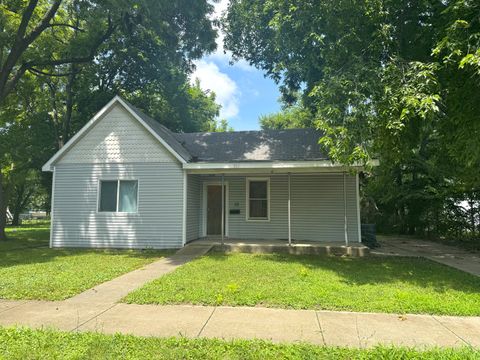
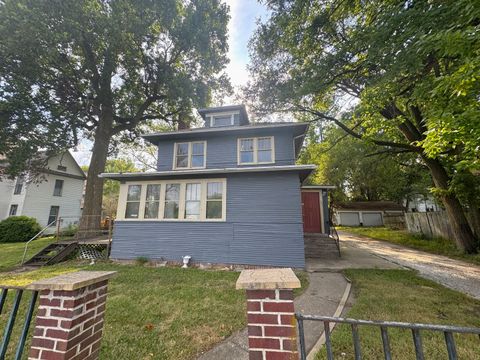
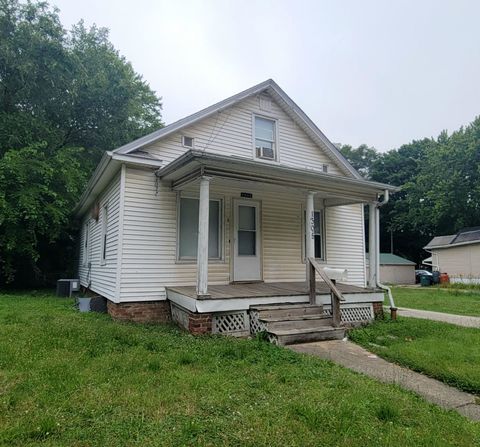
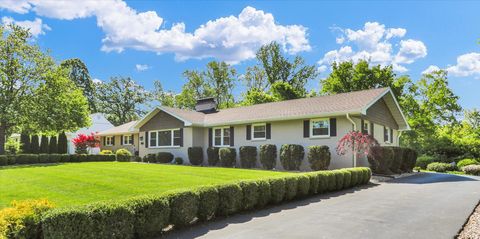
Active
$75,000
2
bds
|
1
ba
|
792
sqft
|
built
1923
610 E Columbia Ave, Champaign, IL 61820
$436
Cash flow
30.3%
Cash-on-Cash Return
12.7%
Cap rate
1.7%
Rent to Value Ratio
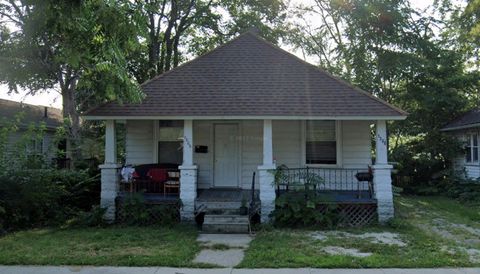
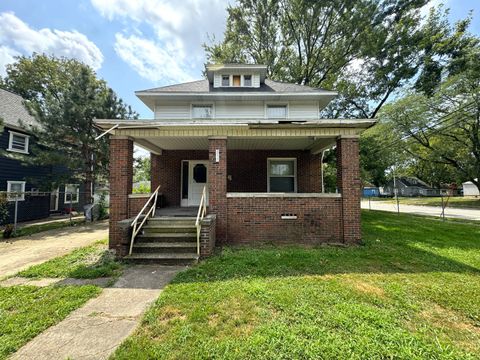
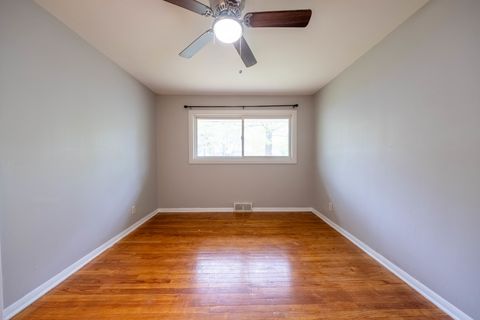
Active
$100,000
3
bds
|
1
ba
|
993
sqft
|
built
1899
1308 N Champaign St, Champaign, IL 61820
$521
Cash flow
27.2%
Cash-on-Cash Return
11.9%
Cap rate
1.6%
Rent to Value Ratio
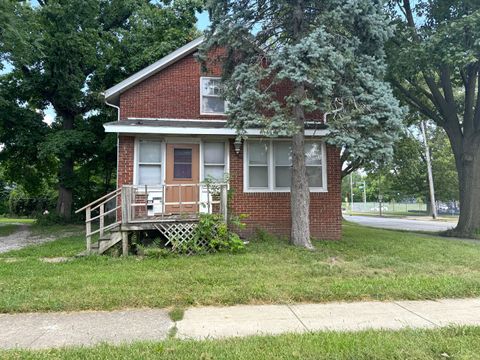
Active
$75,000
3
bds
|
1
ba
|
1,064
sqft
|
built
1903
1310 1/2 N Champaign St, Champaign, IL 61820
$629
Cash flow
43.8%
Cash-on-Cash Return
15.7%
Cap rate
2.1%
Rent to Value Ratio
Active
$120,000
5
bds
|
3
ba
|
1,435
sqft
|
built
1919
1003 N Randolph St, Champaign, IL 61820
$325
Cash flow
14.1%
Cash-on-Cash Return
8.9%
Cap rate
1.3%
Rent to Value Ratio
Active
$130,000
3
bds
|
1
ba
|
1,676
sqft
|
built
1919
211 W Beardsley Ave, Champaign, IL 61820
$557
Cash flow
22.4%
Cash-on-Cash Return
10.8%
Cap rate
1.5%
Rent to Value Ratio
Active
$90,000
3
bds
|
3
ba
|
1,440
sqft
|
built
1915
202 W Beardsley Ave, Champaign, IL 61820
$365
Cash flow
21.2%
Cash-on-Cash Return
10.5%
Cap rate
1.6%
Rent to Value Ratio
Active
$285,000
3
bds
|
2
ba
|
1,846
sqft
|
built
1913
606 W Springfield Ave, Champaign, IL 61820
$-298
Cash flow
-5.5%
Cash-on-Cash Return
4.4%
Cap rate
0.8%
Rent to Value Ratio
Active
$95,000
4
bds
|
1
ba
|
1,970
sqft
|
built
1960
1311 N Walnut St, Champaign, IL 61820
$667
Cash flow
36.6%
Cash-on-Cash Return
14.1%
Cap rate
1.9%
Rent to Value Ratio
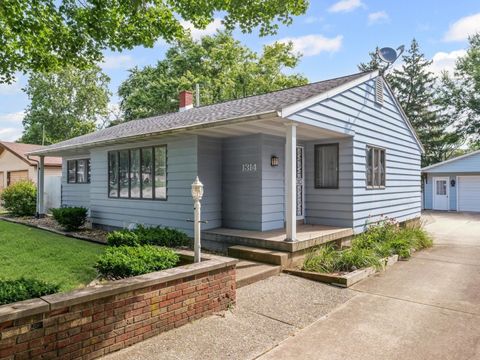
Active
$275,000
3
bds
|
1
ba
|
1,439
sqft
|
built
1947
1314 S State St, Champaign, IL 61820
$-331
Cash flow
-6.3%
Cash-on-Cash Return
4.2%
Cap rate
0.7%
Rent to Value Ratio
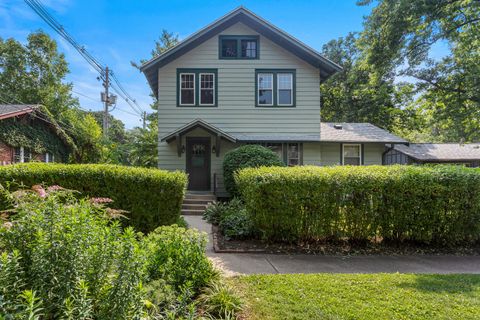
Active
$245,000
3
bds
|
1
ba
|
1,393
sqft
|
built
1913
606 S Elm St, Champaign, IL 61820
$-286
Cash flow
-6.1%
Cash-on-Cash Return
4.3%
Cap rate
0.7%
Rent to Value Ratio
Active
$235,000
4
bds
|
2
ba
|
2,226
sqft
|
built
1932
501 N Prospect Ave, Champaign, IL 61820
$-83
Cash flow
-1.8%
Cash-on-Cash Return
5.3%
Cap rate
0.9%
Rent to Value Ratio
Active
$150,000
3
bds
|
1
ba
|
1,511
sqft
|
built
1912
703 S Randolph St, Champaign, IL 61820
$436
Cash flow
15.2%
Cash-on-Cash Return
9.2%
Cap rate
1.3%
Rent to Value Ratio
Active
$125,000
4
bds
|
2
ba
|
882
sqft
|
built
1904
1305 N Neil St, Champaign, IL 61820
$384
Cash flow
16.0%
Cash-on-Cash Return
9.4%
Cap rate
1.4%
Rent to Value Ratio
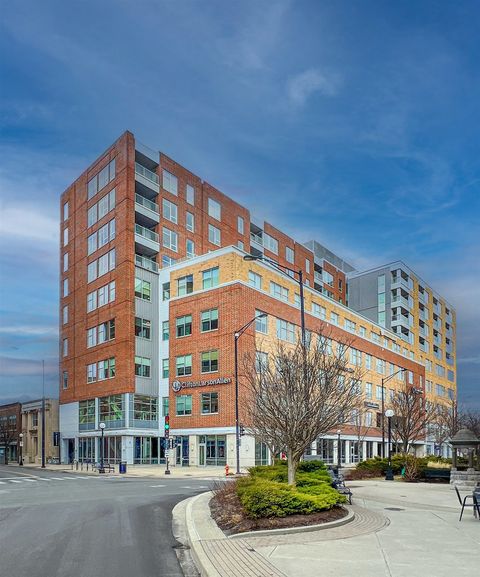
Active
$424,900
2
bds
|
2
ba
|
1,805
sqft
|
built
2009
301 N Neil St, Champaign, IL 61820
$-1,918
Cash flow
-23.6%
Cash-on-Cash Return
0.3%
Cap rate
0.5%
Rent to Value Ratio
Active
$304,000
4
bds
|
2
ba
|
1,898
sqft
|
built
1931
708 W Church St, Champaign, IL 61820
$-50
Cash flow
-0.9%
Cash-on-Cash Return
5.5%
Cap rate
0.9%
Rent to Value Ratio
Active
$99,999
3
bds
|
1
ba
|
1,318
sqft
|
built
1905
1107 N Hickory St, Champaign, IL 61820
$547
Cash flow
28.5%
Cash-on-Cash Return
12.2%
Cap rate
1.6%
Rent to Value Ratio

Active
$345,000
7
bds
|
3
ba
|
0
sqft
|
built
1947
212 W John St, Champaign, IL 61820
$-1,070
Cash flow
-16.2%
Cash-on-Cash Return
2.0%
Cap rate
0.4%
Rent to Value Ratio
Active
$675,000
3
bds
|
4
ba
|
2,496
sqft
|
built
1961
811 Hamilton Dr, Champaign, IL 61820
$-1,369
Cash flow
-10.6%
Cash-on-Cash Return
3.2%
Cap rate
0.6%
Rent to Value Ratio
Active
$232,000
4
bds
|
3
ba
|
1,400
sqft
|
built
1953
615 W Union St, Champaign, IL 61820
$158
Cash flow
3.6%
Cash-on-Cash Return
6.5%
Cap rate
1.0%
Rent to Value Ratio