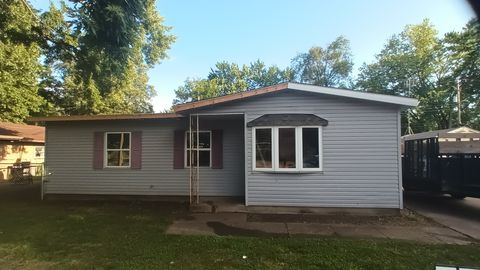
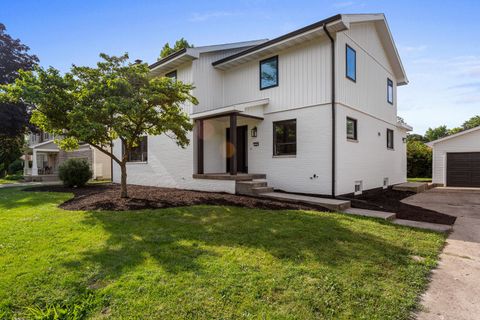
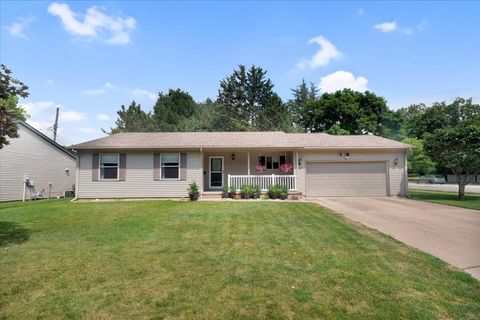
61821 Investment Properties for Sale
Browse homes for sale and investment properties in 61821. Refine your search by price, property type, or more.
Best cash flowing properties in 61821
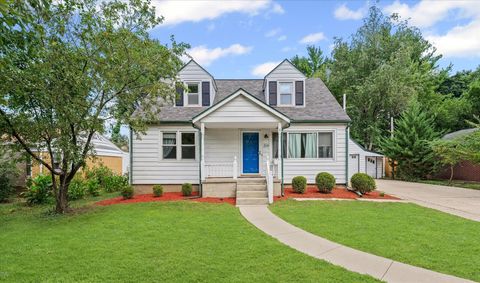
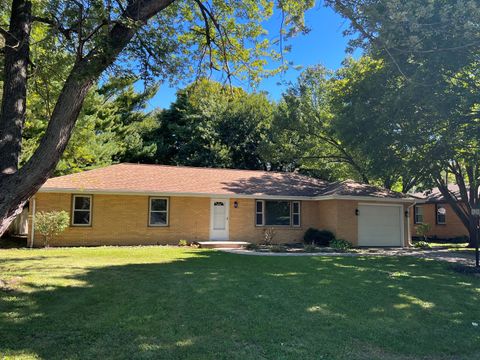
Active
$65,000
1
bds
|
1
ba
|
780
sqft
|
built
1974
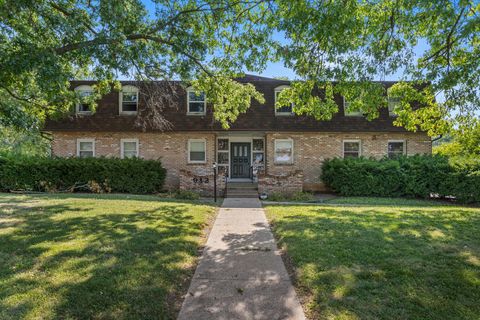
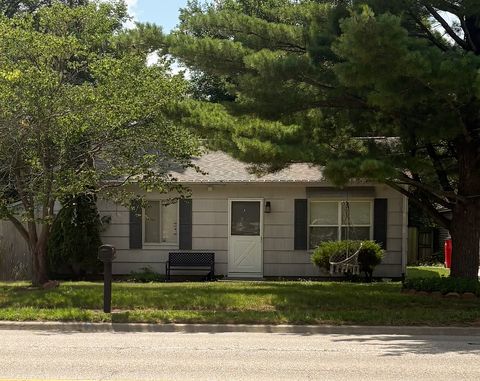
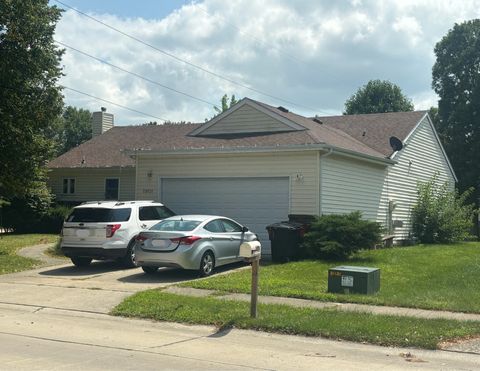
912 Crescent Dr, Champaign, IL 61821
$697
Cash flow
12.5%
Cash-on-Cash Return
12.9%
Cap rate
2.0%
Rent to Value Ratio
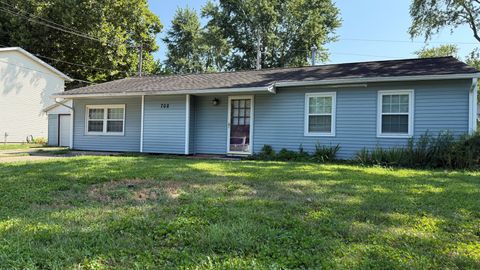
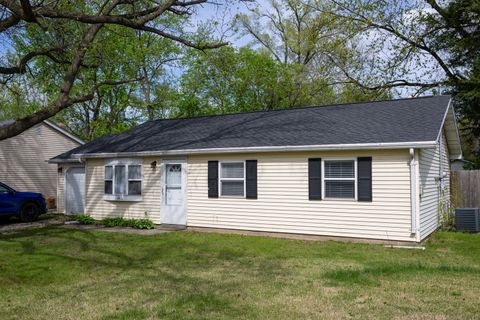
Active
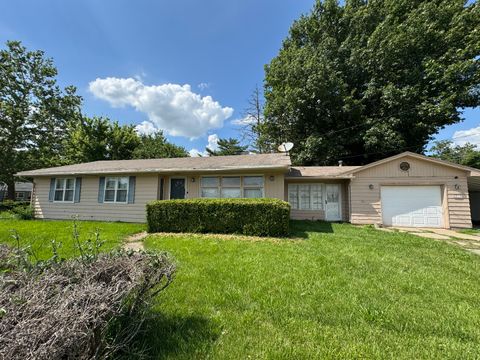
$129,900
4
bds
|
1
ba
|
1,025
sqft
|
built
1956
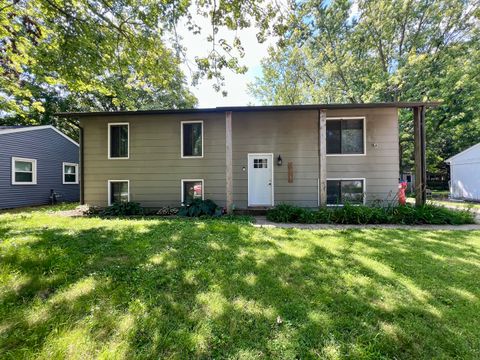
1120 W Beardsley Ave, Champaign, IL 61821
$404
Cash flow
16.2%
Cash-on-Cash Return
9.4%
Cap rate
1.3%
Rent to Value Ratio
30 out of 30 properties for sale in 61821
Limited Results Shown
Create a free account, or log in to reveal all property listings and enjoy the complete experience.
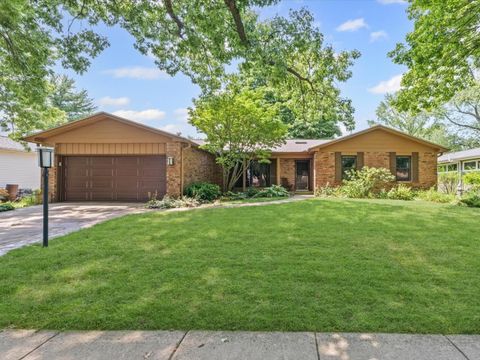
Active
$99,000
2
bds
|
1
ba
|
870
sqft
|
built
1988
2001 S Mattis Ave, Champaign, IL 61821
$300
Cash flow
15.8%
Cash-on-Cash Return
9.3%
Cap rate
1.6%
Rent to Value Ratio
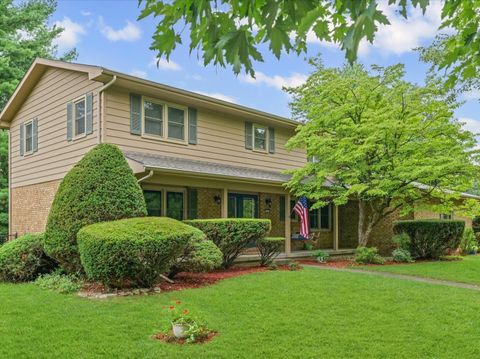
Active
$215,000
3
bds
|
2
ba
|
1,341
sqft
|
built
1964
909 Westfield Dr, Champaign, IL 61821
$98
Cash flow
2.4%
Cash-on-Cash Return
6.2%
Cap rate
0.9%
Rent to Value Ratio
Active
$279,900
3
bds
|
2
ba
|
1,430
sqft
|
built
1949
314 Elmwood Dr, Champaign, IL 61821
$-227
Cash flow
-4.2%
Cash-on-Cash Return
4.7%
Cap rate
0.8%
Rent to Value Ratio
Active
$140,000
2
bds
|
1
ba
|
1,225
sqft
|
built
1968
708 S Duncan Rd, Champaign, IL 61821
$135
Cash flow
5.0%
Cash-on-Cash Return
6.8%
Cap rate
1.1%
Rent to Value Ratio
Active
$379,900
4
bds
|
4
ba
|
2,518
sqft
|
built
1967
2119 Galen Dr, Champaign, IL 61821
$-564
Cash flow
-7.7%
Cash-on-Cash Return
3.9%
Cap rate
0.7%
Rent to Value Ratio
Active
$365,000
4
bds
|
3
ba
|
2,328
sqft
|
built
1972
1005 Page Dr, Champaign, IL 61821
$-729
Cash flow
-10.4%
Cash-on-Cash Return
3.3%
Cap rate
0.7%
Rent to Value Ratio
Active
$89,900
1
bds
|
1
ba
|
420
sqft
|
built
1944
922 W Vine St, Champaign, IL 61821
$179
Cash flow
10.4%
Cash-on-Cash Return
8.1%
Cap rate
1.2%
Rent to Value Ratio
Active
$169,900
2
bds
|
1
ba
|
821
sqft
|
built
1924
1605 W Park Ave, Champaign, IL 61821
$16
Cash flow
0.5%
Cash-on-Cash Return
5.8%
Cap rate
1.0%
Rent to Value Ratio
Active
$430,000
4
bds
|
4
ba
|
3,302
sqft
|
built
1960
1202 Foothill Dr, Champaign, IL 61821
$-999
Cash flow
-12.1%
Cash-on-Cash Return
2.9%
Cap rate
0.6%
Rent to Value Ratio
Active
$229,900
5
bds
|
2
ba
|
1,937
sqft
|
built
1970
2605 Trafalgar Sq, Champaign, IL 61821
$255
Cash flow
5.8%
Cash-on-Cash Return
7.0%
Cap rate
1.1%
Rent to Value Ratio

Active
$424,900
4
bds
|
3
ba
|
2,950
sqft
|
built
1899
910 W Park Ave, Champaign, IL 61821
$-788
Cash flow
-9.7%
Cash-on-Cash Return
3.5%
Cap rate
0.7%
Rent to Value Ratio

Active
$179,900
2
bds
|
1
ba
|
1,034
sqft
|
built
1954
808 S Victor St, Champaign, IL 61821
$138
Cash flow
4.0%
Cash-on-Cash Return
6.6%
Cap rate
1.0%
Rent to Value Ratio
Active
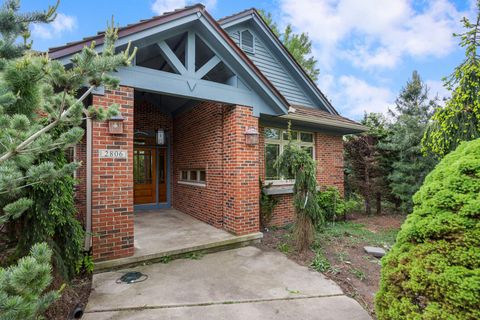
$725,000
4
bds
|
4
ba
|
3,402
sqft
|
built
2002
2806 Oakmont Ct, Champaign, IL 61821
$-3,268
Cash flow
-23.5%
Cash-on-Cash Return
0.3%
Cap rate
0.4%
Rent to Value Ratio
Active
$160,000
4
bds
|
1
ba
|
931
sqft
|
built
1957
2003 W Kirby Ave, Champaign, IL 61821
$171
Cash flow
5.6%
Cash-on-Cash Return
7.0%
Cap rate
1.1%
Rent to Value Ratio

Active
$259,000
3
bds
|
2
ba
|
1,419
sqft
|
built
1937
1005 W John St, Champaign, IL 61821
$-250
Cash flow
-5.0%
Cash-on-Cash Return
4.5%
Cap rate
0.8%
Rent to Value Ratio
Active
$525,000
4
bds
|
3
ba
|
2,570
sqft
|
built
1963
1205 Broadmoor Dr, Champaign, IL 61821
$-1,259
Cash flow
-12.5%
Cash-on-Cash Return
2.8%
Cap rate
0.5%
Rent to Value Ratio
Active
$234,900
3
bds
|
2
ba
|
1,356
sqft
|
built
2000
320 Royal Ct, Champaign, IL 61821
$-135
Cash flow
-3.0%
Cash-on-Cash Return
5.0%
Cap rate
0.9%
Rent to Value Ratio

Active
$725,000
3
bds
|
2
ba
|
2,644
sqft
|
built
1949
32 Greencroft Dr, Champaign, IL 61821
$-2,111
Cash flow
-15.2%
Cash-on-Cash Return
2.2%
Cap rate
0.5%
Rent to Value Ratio
Active
$135,000
3
bds
|
1
ba
|
957
sqft
|
built
1957
2203 W Kirby Ave, Champaign, IL 61821
$198
Cash flow
7.7%
Cash-on-Cash Return
7.4%
Cap rate
1.2%
Rent to Value Ratio
Active
$150,000
3
bds
|
2
ba
|
1,454
sqft
|
built
1953
1612 W Kirby Ave, Champaign, IL 61821
$370
Cash flow
12.9%
Cash-on-Cash Return
8.6%
Cap rate
1.3%
Rent to Value Ratio
Active
$684,000
5
bds
|
5
ba
|
3,255
sqft
|
built
2000
1404 Waterford Pl, Champaign, IL 61821
$-2,894
Cash flow
-22.1%
Cash-on-Cash Return
0.6%
Cap rate
0.4%
Rent to Value Ratio
Active
$125,999
3
bds
|
1
ba
|
1,034
sqft
|
built
1982
1413 Garden Hills Dr, Champaign, IL 61821
$377
Cash flow
15.6%
Cash-on-Cash Return
9.3%
Cap rate
1.3%
Rent to Value Ratio
Active
$258,900
3
bds
|
2
ba
|
1,630
sqft
|
built
1958
1808 Bellamy Dr, Champaign, IL 61821
$-123
Cash flow
-2.5%
Cash-on-Cash Return
5.1%
Cap rate
0.8%
Rent to Value Ratio
Active
$182,000
3
bds
|
2
ba
|
1,185
sqft
|
built
1952
1410 S Mattis Ave, Champaign, IL 61821
$258
Cash flow
7.4%
Cash-on-Cash Return
7.4%
Cap rate
1.1%
Rent to Value Ratio

Active
$349,500
3
bds
|
4
ba
|
2,594
sqft
|
built
1888
907 W Church St, Champaign, IL 61821
$-701
Cash flow
-10.5%
Cash-on-Cash Return
3.3%
Cap rate
0.6%
Rent to Value Ratio
Active
$469,500
3
bds
|
4
ba
|
2,500
sqft
|
built
1994
1318 Broadmoor Dr, Champaign, IL 61821
$3
Cash flow
0.0%
Cash-on-Cash Return
5.7%
Cap rate
0.9%
Rent to Value Ratio
Active
$589,000
5
bds
|
3
ba
|
3,780
sqft
|
built
1994
1726 Georgetown Dr, Champaign, IL 61821
$-914
Cash flow
-8.1%
Cash-on-Cash Return
3.8%
Cap rate
0.7%
Rent to Value Ratio
Active
$249,000
3
bds
|
2
ba
|
1,937
sqft
|
built
1981
1901 Branch Rd, Champaign, IL 61821
$-205
Cash flow
-4.3%
Cash-on-Cash Return
4.7%
Cap rate
0.8%
Rent to Value Ratio